How i trade This is how i trade.
Looking at AUDJPY, I want to show you step by step how i trade using volume, momentum and rsi, looking at each timeframe from the monthly to the 5 min.
Jpy

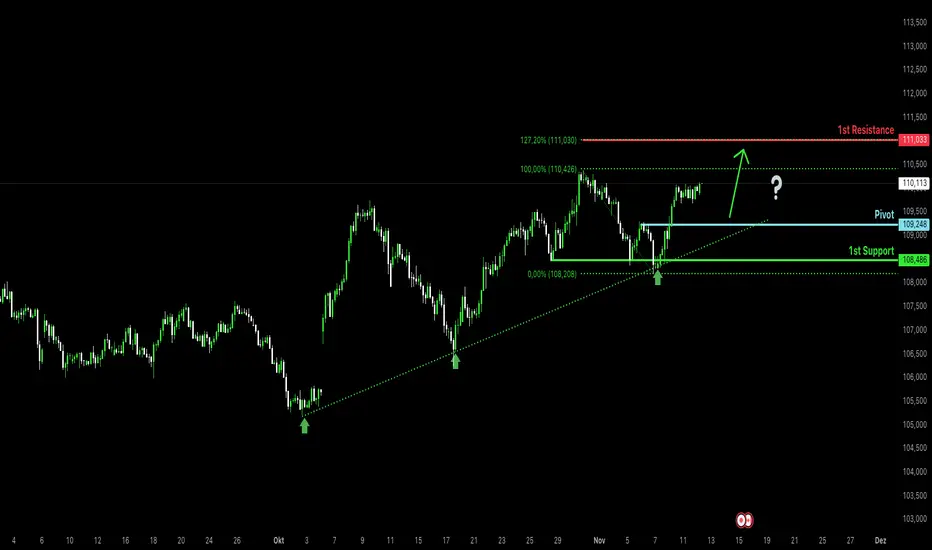
Bullish momentum to extend?CAD/JPY is declining toward the pivot level, which has been identified as a pullback support. A rebound from this area could target the first resistance level, aligning with the 127.2% Fibonacci extension.
Pivot: 109.24
1st Support: 108.8
1st Resistance: 111.03
Disclaimer:
The above opinions given constitute general market commentary, and do not constitute the opinion or advice of IC Markets or any form of personal or investment advice.
Any opinions, news, research, analyses, prices, other information, or links to third-party sites contained on this website are provided on an "as-is" basis, are intended only to be informative, is not an advice nor a recommendation, nor research, or a record of our trading prices, or an offer of, or solicitation for a transaction in any financial instrument and thus should not be treated as such. The information provided does not involve any specific investment objectives, financial situation and needs of any specific person who may receive it. Please be aware, that past performance is not a reliable indicator of future performance and/or results. Past Performance or Forward-looking scenarios based upon the reasonable beliefs of the third-party provider are not a guarantee of future performance. Actual results may differ materially from those anticipated in forward-looking or past performance statements. IC Markets makes no representation or warranty and assumes no liability as to the accuracy or completeness of the information provided, nor any loss arising from any investment based on a recommendation, forecast or any information supplied by any third-party.
NZDJPY to find buyers at market price?NZDJPY - 24h expiry
Prices have reacted from 85.89.
Short term oscillators have turned positive.
A break of the recent high at 87.32 should result in a further move higher.
Offers ample risk/reward to buy at the market.
The bias is to break to the upside.
We look to Buy at 87.01 (stop at 86.59)
Our profit targets will be 88.27 and 88.47
Resistance: 87.32 / 87.70 / 88.34
Support: 86.84 / 86.66 / 86.30
Risk Disclaimer
The trade ideas beyond this page are for informational purposes only and do not constitute investment advice or a solicitation to trade. This information is provided by Signal Centre, a third-party unaffiliated with OANDA, and is intended for general circulation only. OANDA does not guarantee the accuracy of this information and assumes no responsibilities for the information provided by the third party. The information does not take into account the specific investment objectives, financial situation, or particular needs of any particular person. You should take into account your specific investment objectives, financial situation, and particular needs before making a commitment to trade, including seeking, under a separate engagement, as you deem fit.
You accept that you assume all risks in independently viewing the contents and selecting a chosen strategy.
Where the research is distributed in Singapore to a person who is not an Accredited Investor, Expert Investor or an Institutional Investor, Oanda Asia Pacific Pte Ltd (“OAP“) accepts legal responsibility for the contents of the report to such persons only to the extent required by law. Singapore customers should contact OAP at 6579 8289 for matters arising from, or in connection with, the information/research distributed.

Bullish bounce off pullback support?NZD/JPY has bounced off the support level, which serves as a pullback support that aligns with the 38.2% Fibonacci retracement and could rise from this level to our take-profit target.
Entry: 86.64
Why we like it:
There is a pullback support that aligns with the 38.2% Fibonacci retracement.
Stop loss: 86.64
Why we like it:
There is a pullback support level that aligns with the 61.8% Fibonacci retracement.
Take profit: 87.40
Why we like it:
There is a support level that aligns with the 50% Fibonacci retracement.
Enjoying your TradingView experience? Review us!
Please be advised that the information presented on TradingView is provided to Vantage (‘Vantage Global Limited’, ‘we’) by a third-party provider (‘Everest Fortune Group’). Please be reminded that you are solely responsible for the trading decisions on your account. There is a very high degree of risk involved in trading. Any information and/or content is intended entirely for research, educational and informational purposes only and does not constitute investment or consultation advice or investment strategy. The information is not tailored to the investment needs of any specific person and therefore does not involve a consideration of any of the investment objectives, financial situation or needs of any viewer that may receive it. Kindly also note that past performance is not a reliable indicator of future results. Actual results may differ materially from those anticipated in forward-looking or past performance statements. We assume no liability as to the accuracy or completeness of any of the information and/or content provided herein and the Company cannot be held responsible for any omission, mistake nor for any loss or damage including without limitation to any loss of profit which may arise from reliance on any information supplied by Everest Fortune Group.

USDJPY Intraday Technical AnalysisUSDJPY Intraday Technical Analysis - 10 Nov 2025
USDJPY at 154.039 (12:25 PM UTC+4) coiling in a tight range before its next major move.
Market Context: Wyckoff distribution pattern forming after a strong uptrend. Dow Theory shows trend exhaustion.
Daily/4H View: 1D shows a spinning top candle, signaling indecision. 4H chart reveals a clear range between 153.80 and 154.25, with RSI bearish divergence.
1H/30M View: A tight Bollinger Band squeeze on the 30M chart confirms imminent volatility. Price is oscillating around a flat VWAP.
15M/5M View: A symmetrical triangle is forming, indicating a breakout is near. Price action is choppy, ideal for range-bound scalps.
Range-Bound Short Setup:
Entry: 154.20-154.25 (Range High).
SL: 154.40.
TP: 154.00, 153.85.
Range-Bound Long Setup:
Entry: 153.80-153.85 (Range Low).
SL: 153.65.
TP: 154.00, 154.20.
Breakout Long Setup: Enter on a confirmed 1H close > 154.30. SL: 154.10, TP: 154.60.
Breakdown Short Setup: Enter on a confirmed 1H close < 153.75. SL: 153.95, TP: 153.40.
Key Levels:
Resistance: 154.25, 154.50, 154.80.
Support: 153.80, 153.50, 153.20.
Indicators: 4H RSI bearish divergence, 30M BB Squeeze, flat VWAP, bearish Tenkan/Kijun cross on 1H Ichimoku.
Risk: High risk of sharp moves (intervention risk). Wait for confirmation on breakouts.
This is an educational analysis, not financial advice. Trade with a plan.

Forex: Weekly Review I found the week starting Monday 3 November to be a difficult trading environment.
On the surface, all is well. Central banks are cutting interest rates during a reasonably strong economic environment. Inflation is gradually falling, the US and China trade negotiations are tentatively positive. Company earnings continue to exceed expectations. All in all, although it's been years in the making (and may still take years to be confirmed), the 'soft landing narrative' is alive and well.
But, a potentially slower pace of FED rate cuts, a resurfacing of US / CHINA tension (particularly regarding rare earth), suggestions AI stocks are overvalued...All combined with the ongoing government shutdown to ensure a negative tone throughout the week.
We did get a bit of private sector data, Monday's 'soft' manufacturing data kick-started the negative mood. Wednesday's 'positive' ADP JOBS and ISM SERVICE data provided us with the only 'positive sentiment' day of the week. But the positivity evaporated once the 'overvalued tech concerns' kicked in.
A 'still hawkish RBA' didn't help the AUD as the commodity currencies struggled in the overall negative environment. But a 'BOE hold' did give the GBP some restpite from recent woes, perhaps a bit of profit taking after a couple of weeks negativity.
All in all, the fact the VIX barely rose above 20 suggests to me the negativity isn't too concerning and 'risk on' trades could resume soon. But I begin the new week with an open mind.
On a personal note, it was a bit of a disappointing week of two trades, AUD JPY long during Wednesday's positivity, perhaps I was a little late to the party. A trade immediately after ADP data may well have hit profit, it's always tricky when two pieces of data are released an hour apart, do you go with the initial release or wait for the second piece of data? Whichever option you choose, sometimes it goes for you, sometimes it goes against you. All you can do is make a decision that feels right in the moment.
By Friday, I felt the JPY strength was overdone and placed a USD JPY long, based on diverging interest rate speculation. The trade was eventually closed for a small profit.
Let's see what the new week brings.

USDJPY Real Price Levels🎯 USDJPY TECHNICAL DEEP DIVE: WEEKLY FORECAST NOV 10-14, 2025
Close Price: 153.419 (8th Nov 2025, 12:54 UTC+4) | Analysis Period: Intraday Swing Trading Framework
📊 MULTI-TIMEFRAME ANALYSIS OVERVIEW
This comprehensive analysis covers 5M, 15M, 30M, 1H, 4H & 1D timeframes using advanced Elliott Wave Theory, Japanese Candlestick patterns, Dow Theory, Wyckoff accumulation/distribution phases, harmonic ratios, and Gann principles. USDJPY exhibits critical support/resistance levels with significant breakout potential for the week ahead.
🔴 KEY TECHNICAL LEVELS & SUPPORT/RESISTANCE ZONES
Major Resistance: 155.200, 154.800, 154.120 | Minor Resistance: 153.950, 153.700
Major Support: 152.500, 151.800, 150.950 | Minor Support: 153.100, 152.950
Pivot Point: 153.419 (Current equilibrium) | Critical confluence zone for breakout confirmation
⚡ ELLIOTT WAVE STRUCTURE & IMPULSE IDENTIFICATION
Current analysis suggests USDJPY is completing Wave 4 consolidation within a larger 5-wave impulse cycle. The formation of lower highs and higher lows creates a classic triangle pattern signaling Wave 5 breakout potential. Confirmation threshold: Break above 154.120 (5M-15M) = Wave 5 initiation with targets 155.850 .
💹 CANDLESTICK PATTERN FORMATIONS (Multi-Timeframe)
4H Timeframe: Engulfing bearish pattern → Bullish Hammer forming at support | Rising Wedge rejection signals correction bounce
1H Timeframe: Bullish Flag within ascending channel | VWAP acting as dynamic support | RSI oversold bounce confirmed
30M Timeframe: Inverted Cup & Handle pattern (bullish reversal) | Breakout target 154.500 with volume confirmation
15M Timeframe: Bearish Pennant consolidation + Double Bottom forming | Reversal hammer at 152.950 support
5M Timeframe: Rapid oscillation between 153.200-153.600 | High-probability entry zones after RSI oversold/overbought extremes
🎲 DOW THEORY: TREND CONFIRMATION FRAMEWORK
Primary Trend: Uptrend intact - Higher highs/higher lows maintained on 4H-1D. Secondary Trend: Consolidation phase within established uptrend. Tertiary Trend (Intraday): Mixed ranging behavior with increased volatility zones
Dow principles confirm trend strength remains bullish while respecting key support. Volume analysis shows institutional accumulation near 153.000-153.200 levels (Wyckoff accumulation phase).
📈 WYCKOFF METHOD: ACCUMULATION/DISTRIBUTION ANALYSIS
Accumulation Phase: Spring pattern near 152.500 broke support temporarily, indicating institutional absorption
Mark-Up Phase: 4H-1D showing absorption of selling pressure with higher closes (bullish distribution)
Distribution Signals: Watch for climax volume near resistance 155.200 (potential reversal trigger)
Volume Profile: VWAP resistance 154.800 + Bollinger Band upper band 155.100 = Critical confluence rejection zone
🌊 HARMONIC PATTERNS & FIBONACCI RATIOS
USDJPY exhibits Gartley Pattern (0.618 retracement) structure: D-point completion at 153.419 creates potential reversal entry. Fibonacci extensions suggest: 161.8% = 156.200 (Wave 5 target), 127.2% = 155.450 (conservative target).
Harmonic Ratio Confluence: Inverse Head & Shoulders formation at 1D level with neckline 153.950 breakout = 261.8% extension targeting 156.500.
📐 GANN THEORY: PRICE-TIME ANGLES & GEOMETRIC ANGLES
Gann 45° angle (1:1 angle) intersects near 154.300 on 4H timeframe, creating strong support/resistance confluence. Gann Square angles: 25%, 45%, 75% angles all converge near resistance cluster 154.500-155.000 (timing window Nov 12-13).
🔧 TECHNICAL INDICATORS SYNTHESIS
RSI (14 Period):
- 1H: 35-40 zone (oversold bounce setup) → Entry signal above 45
- 4H: 48-52 zone (neutral) → Divergence warning if resistance rejected
- 1D: 55-60 zone (bullish bias maintained) → Avoid shorting from these levels
Bollinger Bands (20,2):
- 4H: Price consolidating near middle band (153.500) | Upper band 155.100 = resistance
- 1H: Compression phase ending (volatility breakout imminent) | Band width narrowing 60-70 pips
- Entry Strategy: Long breakout above upper band with confirmation (Volume + RSI)
VWAP (Volume Weighted Average Price):
- Daily VWAP: 153.850 (dynamic support) | Institutional buying zone
- 4H VWAP: 153.620 (intraday equilibrium) | Mean reversion trades from this level
- Best trade setup: Long entries on VWAP bounce + oversold RSI + Bullish candlestick
Moving Averages (EMA/SMA):
- EMA 50 (4H): 153.200 ✅ Acting as support | Below = trend change warning
- EMA 200 (1D): 152.100 | Strong support floor (only break = major sell signal)
- SMA 20 (1H): 153.450 | Intraday resistance/support oscillator
- Golden Cross Status: EMA 50 > EMA 200 confirmed bullish alignment on 1D
Ichimoku Cloud (9,26,52):
- Cloud Top: 154.200 | Cloud Bottom: 152.800 (current price above cloud = bullish)
- Tenkan (Red Line 9): 153.600 | Kijun (Blue Line 26): 153.800 | Bullish alignment
- Chikou Span: Above price (bullish signal) | Lagging indicator confirms uptrend
- Cloud breakout target: Above 154.200 confirms sustained strength to 155.500
⏰ INTRADAY SWING TRADE SETUP (5M-30M Timeframes)
ENTRY SIGNALS (Next Week):
PRIMARY LONG ENTRY: Break 153.950 with close above 154.100 (RSI >45, Volume >Avg) | Target 154.600 (1:1.5 R/R)
AGGRESSIVE ENTRY: VWAP bounce from 153.620 (5M hammer) + Bollinger Band middle band + RSI oversold | Stop 153.450
CONTRARIAN SHORT: Rejection above 155.100 BB upper band (after overbought spike) | Target 154.200 support
SCALP ENTRY: 5M Bollinger Band squeeze breakout (width <20 pips) → Both directions tradeable with tight 15-pip stops
🎯 EXIT & PROFIT TAKING STRATEGY
1st Target (Short-term): 154.600 - Take 30% profit (quick scalp win, trailing stop above entry)
2nd Target (Swing): 155.100-155.200 - Take 50% profit (Bollinger Band + Harmonic resistance confluence)
3rd Target (Trend): 155.850 - Take final 20% (Elliott Wave 5 target + Fibonacci 161.8%)
Stop Loss Protocol: Max loss 30 pips below entry | Trail stops by 15-pips once +50 pips profit locked
🚨 REVERSAL IDENTIFICATION & BREAKOUT CONFIRMATION
BULLISH REVERSALS (HIGH PROBABILITY): Double Bottom at 152.950 (Nov 10 likely) + Inverted Head & Shoulders confirmation on 1H = Reversal signal. Price closes above 153.950 on higher volume = Breakout confirmation.
BEARISH REVERSALS: Only if price breaks below EMA 50 (153.200) on 4H close + RSI divergence + Volume spike = Reversal to 152.500 support zone.
🌪️ VOLATILITY FORECAST & OVERBOUGHT/OVERSOLD ZONES
Expected ATR (4H): 80-120 pips | Increased volatility Nov 11-12 (BOJ economic data risk)
OVERBOUGHT RSI (>70): Expect pullback from 155.100-155.200 resistance zones
OVERSOLD RSI (<30): Bounce probability 85% from 152.950-153.100 support cluster
Bollinger Band Width Expansion: Volatility breakout imminent when width >100 pips on 1H
📋 TRADING PLAN SUMMARY (NOV 10-14, 2025)
Week Outlook: Bullish bias maintained with correction bounces creating optimal entry zones. Most probable scenario: Consolidation break above 154.120 → Wave 5 impulse toward 155.850 by end of week.
Monday-Tuesday: Watch VWAP bounces + RSI oversold condition recovery | Entry zone 153.200-153.600
Wednesday-Thursday: Breakout attempt resistance 154.100-154.500 | Major breakout window with elevated volatility
Friday: Trending day likely with follow-through buying | Potential final leg to 155.500-155.850 target
⚙️ RISK MANAGEMENT ESSENTIALS
Position Size: Max 2% risk per trade | Stop Loss: 25-30 pips | Profit Target: 75-150 pips (3:1 - 5:1 R/R minimum). Never risk more than account 2% on single setup. Use trailing stops once +50 pips profit locked in.
🏆 CRITICAL SUCCESS FACTORS FOR THIS WEEK
✅ Confirmation of Ichimoku Cloud breakout above 154.200
✅ Daily close above 154.100 with volume confirmation
✅ RSI divergence bounce from oversold zones (5M-1H timeframes)
✅ VWAP acting as institutional support (accumulation ongoing)
✅ Harmonic pattern completion at D-point (current price 153.419)
❌ INVALIDATION SIGNALS (STAY OUT OR REVERSE):
❌ Break below EMA 50 (153.200) on 4H daily close
❌ Close below 152.950 support (major bearish signal)
❌ RSI breakdown below 30 + Volume spike = Trend reversal initiated
❌ Bollinger Band inversion (compression to expansion to compression = exhaustion)
📲 HASHTAGS FOR COMMUNITY ENGAGEMENT
#USDJPY #ForexTrading #TechnicalAnalysis #SwingTrade #Intraday #ElliottWave #FibonacciRatio #DayTradingStrategy #JapaneseYen #BreakoutTrade #RSI #BollingerBands #VolumeProfile #GannTheory #WyckoffMethod #HarmonicPatterns #TradingView #ForexSignals #Forex #FXTrading #CurrencyTrading #TradeSetup #PriceAction #ChartAnalysis #TA #TechnicalIndicators #CryptoTrading #MoneyManagement #RiskManagement #EditorsPicks #TradingCommunity #WeeklyForecast
📌 DISCLAIMER
This analysis is for educational purposes and technical study only. Not financial advice. Always conduct your own due diligence. Past performance ≠ future results. Use proper risk management and position sizing. Trade at your own risk.
✨ ANALYSIS GENERATED: November 8, 2025 | FORECAST PERIOD: Nov 10-14, 2025 | ASSET: USDJPY (Spot Forex)

USDJPY Eyes 153.000 Support as Hawkish Fed Keeps Dollar Bid!Hey Traders,
In the coming week, we’re monitoring USDJPY for a buying opportunity around the 153.000 zone. The pair remains in a clear uptrend and is currently in a correction phase, approaching a key support and resistance area at 153.000.
Fundamentally, the Fed’s recent hawkish tone emphasizing stronger than expected labor data and pushing back against December rate cut bets continues to support USD strength, keeping upward pressure on the pair.
A sustained reaction at 153.000 could signal the next leg higher.
Trade safe,
Joe.

USD JPY. LONG The message coming from the FED remains 'a slower pace of rate cuts' (all bar one member). Japan's new president inserts a 'dovish team, all in all, I feel JPY strength is 'overdone'.
Once again it was a coin toss whether to long USD or AUD.
The risk to the trade is negative market sentiment, it is very early in the trading day and anything can happen.
Because it's early in the trading day, I've gone for a 1 5:1 risk reward. I will close the trade before end of day (if it's ongoing), to avoid weekend risk.
I have found it difficult to form a strong conviction in the direction of the currencies this week. I've not been able to commit to the negative sentiment, Due to the overall uncertainty I suspect there has been some profit taking across all assets. Hopefully next week will bring a little more clarity and cohesion.

GBPJPY H4 | Potential Bullish ReversalBased on the H4 chart analysis, we can see that the price has bounced off the buy entry, which is an overlap support, and could rise from this level to the take profit.
Buy entry is at 200.45, whichis an overlap support.
Stop loss is at 199.01, whichis a pullback support.
Take profit is at 202.03, whichis a pullback resistance.
Stratos Markets Limited (tradu.com ):
CFDs are complex instruments and come with a high risk of losing money rapidly due to leverage. 68% of retail investor accounts lose money when trading CFDs with this provider. You should consider whether you understand how CFDs work and whether you can afford to take the high risk of losing your money.
Stratos Europe Ltd (tradu.com ):
CFDs are complex instruments and come with a high risk of losing money rapidly due to leverage. 70% of retail investor accounts lose money when trading CFDs with this provider. You should consider whether you understand how CFDs work and whether you can afford to take the high risk of losing your money.

USDJPY H1 | Bearish ReversalUSDJPY is rising towards the sell entry, whichis a pullback resitance that aligns with the 38.2% Fibonacci retracemnt and could reverse to the downside.
Sell entry is at 153.37, whichis a pullback resistance that aligns withthe 38.2% Fibonacci retracement.
Stop loss is at 153.81, whichis a pullback resistance that lines up witht he 61.8% Fibonacci retracement.
Take profit is at 152.36, whichis an overlap support that lines up witht he 138.2% Fibonacci extension.
Stratos Markets Limited (tradu.com ):
CFDs are complex instruments and come with a high risk of losing money rapidly due to leverage. 68% of retail investor accounts lose money when trading CFDs with this provider. You should consider whether you understand how CFDs work and whether you can afford to take the high risk of losing your money.
Stratos Europe Ltd (tradu.com ):
CFDs are complex instruments and come with a high risk of losing money rapidly due to leverage. 70% of retail investor accounts lose money when trading CFDs with this provider. You should consider whether you understand how CFDs work and whether you can afford to take the high risk of losing your money.

Bullish bounce off pullback support?USD/JPY is falling towards the pivot, which acts as a pullback support and could bounce to the 1st resistance.
Pivot: 152.41
1st Support: 151.15
1st Resistance: 154.45
Disclaimer:
The above opinions given constitute general market commentary, and do not constitute the opinion or advice of IC Markets or any form of personal or investment advice.
Any opinions, news, research, analyses, prices, other information, or links to third-party sites contained on this website are provided on an "as-is" basis, are intended only to be informative, is not an advice nor a recommendation, nor research, or a record of our trading prices, or an offer of, or solicitation for a transaction in any financial instrument and thus should not be treated as such. The information provided does not involve any specific investment objectives, financial situation and needs of any specific person who may receive it. Please be aware, that past performance is not a reliable indicator of future performance and/or results. Past Performance or Forward-looking scenarios based upon the reasonable beliefs of the third-party provider are not a guarantee of future performance. Actual results may differ materially from those anticipated in forward-looking or past performance statements. IC Markets makes no representation or warranty and assumes no liability as to the accuracy or completeness of the information provided, nor any loss arising from any investment based on a recommendation, forecast or any information supplied by any third-party.

USD/JPY(20251107)Today's AnalysisMarket News:
Revelo Labs, a US private data provider, reported that US non-farm payrolls decreased by 9,100 in October; Challenger job cuts in the US surged 175% year-over-year in October, and year-to-date layoffs increased by 65%; Chicago Fed data showed the October unemployment rate was approximately 4.36%, a four-year high. Federal Reserve officials remain cautious. Chicago Fed President Goolsby believes a lack of reliable inflation data and remains hesitant about interest rate cuts; Cleveland Fed President Hammarck emphasized inflation risks and opposed further rate cuts; however, Governor Milan continues to expect a Fed rate cut in December; New York Fed President Williams believes the model-based estimate of the US neutral interest rate is around 1%. Governor Barr pointed out that the impact of artificial intelligence may be affecting hiring in some industries.
Technical Analysis:
Today's Buy/Sell Threshold:
153.33
Support and Resistance Levels:
154.63
154.15
153.83
152.83
152.52
152.03
Trading Strategy:
If the price breaks above 153.33, consider buying with a first target price of 153.83.
If the price breaks below 152.83, consider selling with a first target price of 152.52.

NZDJPY to find buyers at previous swing low?NZDJPY - 24h expiry
Dip buying offers good risk/reward.
Short term momentum is bearish.
Early pessimism is likely to lead to losses although extended attempts lower are expected to fail.
85.38 has been pivotal.
Buying posted close to the previous low of 85.35.
We look to Buy at 85.72 (stop at 85.22)
Our profit targets will be 87.22 and 87.52
Resistance: 86.70 / 87.32 / 87.60
Support: 85.70 / 85.35 / 85.00
Risk Disclaimer
The trade ideas beyond this page are for informational purposes only and do not constitute investment advice or a solicitation to trade. This information is provided by Signal Centre, a third-party unaffiliated with OANDA, and is intended for general circulation only. OANDA does not guarantee the accuracy of this information and assumes no responsibilities for the information provided by the third party. The information does not take into account the specific investment objectives, financial situation, or particular needs of any particular person. You should take into account your specific investment objectives, financial situation, and particular needs before making a commitment to trade, including seeking, under a separate engagement, as you deem fit.
You accept that you assume all risks in independently viewing the contents and selecting a chosen strategy.
Where the research is distributed in Singapore to a person who is not an Accredited Investor, Expert Investor or an Institutional Investor, Oanda Asia Pacific Pte Ltd (“OAP“) accepts legal responsibility for the contents of the report to such persons only to the extent required by law. Singapore customers should contact OAP at 6579 8289 for matters arising from, or in connection with, the information/research distributed.

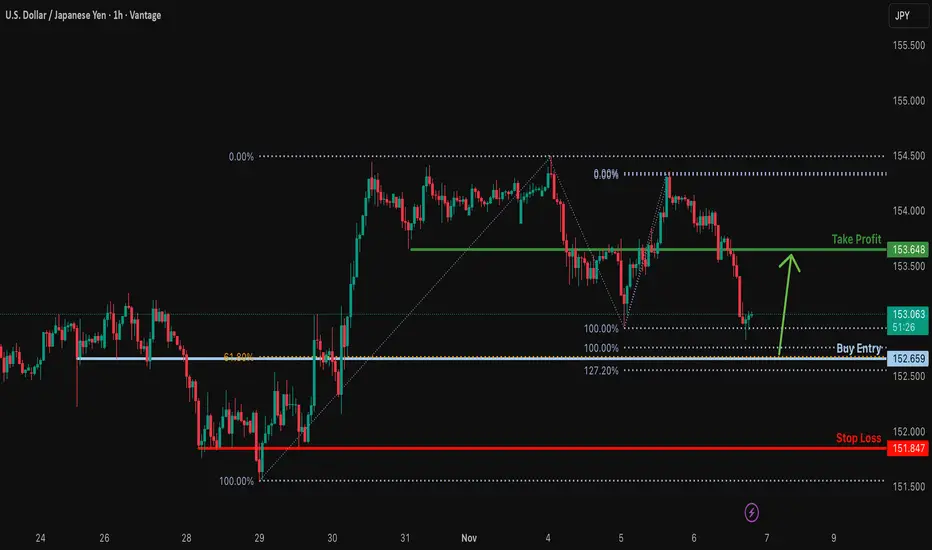
Falling towards Fibonacci conflunce?USD/JPY is falling towards the support level, which is an overlap support that aligns with the 61.8% Fibonacci retracement, the 127.2% Fibonacci extension and the 100% Fibonacci projection and could bounce from this level to our take profit.
Entry: 152.65
Why we like it:
There is an overlap support that aligns with the 61.8% Fibonacci retracement, the 127.2% Fibonacci extension and the 100% Fibonacci projection.
Stop loss: 151.84
Why we like it:
There is a pullback support level.
Take profit: 153.64
Why we like it:
There is an overlap resistance level.
Enjoying your TradingView experience? Review us!
Please be advised that the information presented on TradingView is provided to Vantage (‘Vantage Global Limited’, ‘we’) by a third-party provider (‘Everest Fortune Group’). Please be reminded that you are solely responsible for the trading decisions on your account. There is a very high degree of risk involved in trading. Any information and/or content is intended entirely for research, educational and informational purposes only and does not constitute investment or consultation advice or investment strategy. The information is not tailored to the investment needs of any specific person and therefore does not involve a consideration of any of the investment objectives, financial situation or needs of any viewer that may receive it. Kindly also note that past performance is not a reliable indicator of future results. Actual results may differ materially from those anticipated in forward-looking or past performance statements. We assume no liability as to the accuracy or completeness of any of the information and/or content provided herein and the Company cannot be held responsible for any omission, mistake nor for any loss or damage including without limitation to any loss of profit which may arise from reliance on any information supplied by Everest Fortune Group.
USDJPY (4H) – Bearish Divergence & Rising Wedge Breakdown Ahead4-hour chart of ICMARKETS:USDJPY is showing a clear bearish divergence on RSI, signaling potential exhaustion in the recent bullish leg. Price has formed a rising wedge pattern, now testing the lower trendline support — a key inflection point for the pair.
A confirmed breakdown below the recent Higher Low (HL) will invalidate the bullish structure and could trigger a shift in market sentiment, marking the beginning of a new bearish phase with price starting to print Lower Highs (LH) and Lower Lows (LL).
📉 Bearish Outlook:
A decisive break close bewlow–152.750 could accelerate downside momentum.
Next downside target sits near 151.550, aligning with the recent high low 0.5 FIB retracement.
Further below, an unfilled price gap between 149.000–147.400 may attract price to fill before any meaningful reversal.
📈 Invalidation:
If price breaks and closes above 154.500, the bearish scenario will be invalidated and momentum may resume new higher.
BIAS support a bearish unless bulls reclaim control above key resistance.

Bullish reversal setup?EUR/JPY is falling towards the support level, which is a pullback support that lines up wth the 38.2% Fibonacci retracement and could bounce from this level to our take profit.
Entry: 176.64
Why we like it:
There is a pullback support that aligns with the 38.2% Fibonacci retracement.
Stop loss: 175.70
Why we like it:
There is a swing low support level.
Take profit: 177.55
Why we like it:
There is an overlap resistance that is slightly below the 61.8% Fibonacci retracement.
Enjoying your TradingView experience? Review us!
Please be advised that the information presented on TradingView is provided to Vantage (‘Vantage Global Limited’, ‘we’) by a third-party provider (‘Everest Fortune Group’). Please be reminded that you are solely responsible for the trading decisions on your account. There is a very high degree of risk involved in trading. Any information and/or content is intended entirely for research, educational and informational purposes only and does not constitute investment or consultation advice or investment strategy. The information is not tailored to the investment needs of any specific person and therefore does not involve a consideration of any of the investment objectives, financial situation or needs of any viewer that may receive it. Kindly also note that past performance is not a reliable indicator of future results. Actual results may differ materially from those anticipated in forward-looking or past performance statements. We assume no liability as to the accuracy or completeness of any of the information and/or content provided herein and the Company cannot be held responsible for any omission, mistake nor for any loss or damage including without limitation to any loss of profit which may arise from reliance on any information supplied by Everest Fortune Group.

Bearish reversal off 50% Fibonacci resistnce?NZD/JPY is rising towards the resistance level, which serves as a pullback resistance that aligns with the 50% Fibonacci retracement and could reverse from this level to take a profit.
Entry: 87.50
Why we like it:
There is a pullback resistance that aligns with the 50% Fibonacci retracement
Stop loss: 88.13
Why we like it:
There is a pullback resistance that is slightly below the 78.6% Fibonacci retracement.
Take profit: 86.64
Why we like it:
There is a pullback support level.
Enjoying your TradingView experience? Review us!
Please be advised that the information presented on TradingView is provided to Vantage (‘Vantage Global Limited’, ‘we’) by a third-party provider (‘Everest Fortune Group’). Please be reminded that you are solely responsible for the trading decisions on your account. There is a very high degree of risk involved in trading. Any information and/or content is intended entirely for research, educational and informational purposes only and does not constitute investment or consultation advice or investment strategy. The information is not tailored to the investment needs of any specific person and therefore does not involve a consideration of any of the investment objectives, financial situation or needs of any viewer that may receive it. Kindly also note that past performance is not a reliable indicator of future results. Actual results may differ materially from those anticipated in forward-looking or past performance statements. We assume no liability as to the accuracy or completeness of any of the information and/or content provided herein and the Company cannot be held responsible for any omission, mistake nor for any loss or damage including without limitation to any loss of profit which may arise from reliance on any information supplied by Everest Fortune Group.

GBPJPY H4 | Major Resistance AheadGBP/JPY is rising towards the sell entry, which is an overlap resistance that aligns with the 50% Fibonacci retracement and could reverse from this level to the downside.
Sell entry is at 201.07, which is a swing low support.
Stop loss is at 203.04, which is a pullback resistance.
Take profit is at 197.77, which is a swing low support.
Stratos Markets Limited (tradu.com ):
CFDs are complex instruments and come with a high risk of losing money rapidly due to leverage. 68% of retail investor accounts lose money when trading CFDs with this provider. You should consider whether you understand how CFDs work and whether you can afford to take the high risk of losing your money.
Stratos Europe Ltd (tradu.com ):
CFDs are complex instruments and come with a high risk of losing money rapidly due to leverage. 70% of retail investor accounts lose money when trading CFDs with this provider. You should consider whether you understand how CFDs work and whether you can afford to take the high risk of losing your money.

EURJPY SELL SETUP🎯 4. Entry Strategy
✅ Step 1 – Wait for Price to Enter Supply Zone
Be patient and wait until price reaches the red zone (176.600–176.700).
This ensures you’re not entering early during the retracement.
✅ Step 2 – Look for Confirmation (on Lower Timeframes)
Switch to a 5-minute or 1-minute chart inside the supply zone and look for:
Liquidity grab (a wick or small breakout above previous highs).
Change of Character (ChoCH) to the downside (break of minor structure).
Bearish engulfing candle or strong downward move confirming seller presence.
✅ Step 3 – Execute the Entry
Sell after confirmation of bearish structure shift (post-ChoCH).
Place Stop Loss just above the zone (above 176.700).
Place Take Profit at the next demand zone (175.400 area).

Could we see a drop from here?EUR/JPY is rising towards the pivot which has been identified as a pullback resistance that lines up with the 38.2% Fibonacci retracemnt and could drop to the overlap support.
Pivot: 176.71
1st Support: 174.92
1st Resistance: 178.04
Disclaimer:
The above opinions given constitute general market commentary, and do not constitute the opinion or advice of IC Markets or any form of personal or investment advice.
Any opinions, news, research, analyses, prices, other information, or links to third-party sites contained on this website are provided on an "as-is" basis, are intended only to be informative, is not an advice nor a recommendation, nor research, or a record of our trading prices, or an offer of, or solicitation for a transaction in any financial instrument and thus should not be treated as such. The information provided does not involve any specific investment objectives, financial situation and needs of any specific person who may receive it. Please be aware, that past performance is not a reliable indicator of future performance and/or results. Past Performance or Forward-looking scenarios based upon the reasonable beliefs of the third-party provider are not a guarantee of future performance. Actual results may differ materially from those anticipated in forward-looking or past performance statements. IC Markets makes no representation or warranty and assumes no liability as to the accuracy or completeness of the information provided, nor any loss arising from any investment based on a recommendation, forecast or any information supplied by any third-party.

Bullish reversal off Fibonacci confluence?CAD/JPY is falling towards the pivot, which acts as a pullback support and could bounce to the pullback resistance.
Pivot: 107.92
1st Support: 106.86
1st Resistance: 109.49
Disclaimer:
The above opinions given constitute general market commentary, and do not constitute the opinion or advice of IC Markets or any form of personal or investment advice.
Any opinions, news, research, analyses, prices, other information, or links to third-party sites contained on this website are provided on an "as-is" basis, are intended only to be informative, is not an advice nor a recommendation, nor research, or a record of our trading prices, or an offer of, or solicitation for a transaction in any financial instrument and thus should not be treated as such. The information provided does not involve any specific investment objectives, financial situation and needs of any specific person who may receive it. Please be aware, that past performance is not a reliable indicator of future performance and/or results. Past Performance or Forward-looking scenarios based upon the reasonable beliefs of the third-party provider are not a guarantee of future performance. Actual results may differ materially from those anticipated in forward-looking or past performance statements. IC Markets makes no representation or warranty and assumes no liability as to the accuracy or completeness of the information provided, nor any loss arising from any investment based on a recommendation, forecast or any information supplied by any third-party.

USD/JPY(20251105)Today's AnalysisMarket News:
The US government shutdown stalemate continues, and the 35-day record is about to be broken.
Technical Analysis:
Today's Buy/Sell Threshold:
153.81
Support and Resistance Levels:
154.97
154.54
154.26
153.37
153.09
152.66
Trading Strategy:
Consider buying if the price breaks above 153.81, with a first target price of 154.26.
Consider selling if the price breaks below 153.37, with a first target price of 153.09.
