USDJPY is forming an M pattern with strong bearish momentum.
After the impulsive move to the downside, price may retrace toward the 50% Fibonacci level, where there is a clear imbalance zone. From that area, a continuation to the downside is expected.
However, since we have high-impact Forex news later today, it is best to remain patient and wait for confirmation. As long as the price does not break above 157, the bearish scenario remains valid.
This setup offers a solid sell swing opportunity if the rejection is confirmed.
JPYUSD

Selena | USDJPY 1H–Bullish Reversal Setup Toward 157.800 TargetFX:USDJPY
After an aggressive sell-off into 154.80–155.00 demand, USDJPY produced a strong impulsive recovery, reclaiming broken structure. Price is now compressing under the descending trendline and retesting the 155.50–155.70 entry zone, forming a potential higher-low setup. Bias remains bullish above this zone, aiming for a structural reversal toward major resistance.
Key Scenarios
✅ Bullish Case 🚀
Entry around 155.40–155.70 retest zone
Break & close above the descending trendline → continuation wave
🎯 Target 1: 156.96 (major resistance)
🎯 Final Target: 157.80–158.00 liquidity zone
❌ Bearish Case 📉
Only valid if price breaks below 155.20
Downside continuation into 154.80 demand zone
Below 154.70, structure turns fully bearish again
Current Levels to Watch
Resistance 🔴: 156.00 / 156.95
Support 🟢: 155.40 / 155.20 / 154.80
⚠️ Disclaimer: This analysis is for educational purposes only. Not financial advice.

Price Is Sitting on a High-Probability Demand Zone 📌 MARKET OUTLOOK
USDJPY continues to move inside a well-defined descending channel, forming a clean sequence of Lower Highs and Lower Lows.
Right now, price has tapped the Demand Zone at the bottom of the channel — a level that has consistently acted as a reaction point. After rejecting this zone, the market created a small pullback, forming a clearer Entry Zone for a potential bullish correction.
The structure shows a classic pattern:
➡️ Bounce from Demand → Pullback → Higher Low → Long Setup
This gives us a high-probability opportunity to follow the upcoming corrective leg of the channel.
🎯 TRADE SETUP (Entry – SL – TP)
✅ ENTRY ZONE
155.10 – 155.25
(Aligned with the pullback and the retest highlighted in the chart.)
❌ STOP LOSS (SL ZONE)
154.70 – 154.85
(Placed safely below the Demand Zone and channel support to avoid noise.)
🥇 TAKE PROFIT 1 (TP1)
155.90 – 156.10
(Targeting the upper boundary of the channel.)
🥈 TAKE PROFIT 2 (TP2 – Extended Move)
156.60 – 157.00
(If price breaks market structure and shifts momentum upward.)

JPY/USD – Bullish Momentum StrengthensJPY/USD – Bullish Momentum Strengthens as Price Breaks Short-Term Structure
JPY/USD continues to build upward momentum on the H1 timeframe after reclaiming the short-term structure and breaking above minor resistance areas. The market has respected multiple demand zones below, forming a sequence of higher lows that signals a potential continuation toward higher levels.
The bullish drive is also supported by the 9-period DEMA, which is turning upward and aligning closely with price, showing that buyers remain in control in the short term.
1. Technical Outlook – Buyers Regain Control
Recent price action shows:
A clean break above short-term consolidation.
Higher lows forming above key demand levels.
DEMA (9) sloping upward, confirming bullish pressure.
Strong impulsive candles pushing through intraday liquidity.
This structure strongly favors a continuation toward previous swing highs on the right side of your chart.
2. Key Support and Resistance Zones
Demand Zones (Support)
These levels have acted as strong reactions and remain valid for pullback entries:
0.006380 – 0.006386
0.006365 – 0.006372
0.006348 – 0.006355
As long as price stays above these zones, buyers maintain advantage.
Immediate Resistance
0.006450 – 0.006460
This is the first target zone and potential reaction area.
A breakout above this region opens the path toward the next bullish expansion.
3. Trading Strategy for Today
Primary Scenario: Buy Continuation
The current setup shows a clean bullish continuation model.
Entry: On a minor pullback toward 0.006430 – 0.006435
Stop Loss: Below 0.006412 (structure invalidation)
Take Profit:
TP1: 0.006455
TP2: 0.006465 (extension target)
This aligns with the long-position zone drawn on your chart.
Alternative Scenario: Buy the Deeper Pullback
If price retraces deeper:
Entry: 0.006380 – 0.006386
SL: Below 0.006365
TP: 0.006450 – 0.006460
This setup uses demand zone confluence for a stronger risk-reward.
4. Summary
JPY/USD is showing a well-defined bullish structure supported by upward DEMA alignment and strong demand. As long as price remains above the highlighted demand levels, the market condition favors buying the pullbacks and targeting 0.006455 and beyond.

USDJPY Intraday AnalysisUSDJPY Intraday Analysis: Price Forms Bullish Reversal Structure and Targets Upper Resistance Zone
USDJPY is developing a constructive bullish pattern on the H1 timeframe as price continues to form higher lows above key demand zones. Market structure suggests a potential accumulation phase, with buyers gradually stepping in each time price retests intraday support. As long as price remains above the highlighted demand areas, the probability of a bullish continuation toward the upper resistance remains high.
This analysis focuses on structural behavior, EMA9 momentum, and clear support–resistance interaction.
Technical Outlook
1. Market Structure
USDJPY has completed multiple swing-low rejections around the 0.006375 – 0.006385 zone, forming a clean inverse V-shaped recovery pattern. Price is now stabilizing, moving inside a tightening range that hints at consolidation before a potential upside breakout.
The repeated higher lows indicate that buyers are defending the structure strongly.
2. EMA9 Behavior
The EMA9 is currently flattening, which is typical during accumulation phases. Once price closes above EMA9 with strong candles, bullish momentum is expected to return quickly. A breakout above the mid-range would further confirm buyer dominance.
3. Support and Resistance Zones
Support Levels
0.006375 – 0.006385 (intraday demand, key accumulation layer)
0.006355 – 0.006365 (major demand zone, deeper liquidity pocket)
Resistance Levels
0.006415 – 0.006425 (primary bullish target)
Break above this level opens the path for extended upside continuation.
Intraday Trade Scenarios
Scenario A: Bullish Continuation (High Probability)
If price maintains above the intraday demand:
Entry: 0.006385 – 0.006395
Targets: 0.006415, 0.006425
Stop-loss: Below 0.006370
This scenario aligns with the projected bullish pattern in the chart.
Scenario B: Deeper Pullback Before Lift-Off
If price dips into the lower demand zone:
Entry: 0.006360 – 0.006370
Targets: 0.006395, 0.006420
Stop-loss: Below 0.006350
This setup offers a better risk-reward for patient traders.
Bullish Invalidation
If price closes below 0.006350, the bullish accumulation structure breaks, signaling a shift into a deeper correction.
Conclusion
USDJPY is forming a clear bullish accumulation pattern, supported by firm higher lows and repeated reactions from key demand zones. As long as price remains above 0.006375, the market favors a move toward 0.006420. Traders should watch for a confirmed breakout above EMA9 and mid-range structure to validate bullish momentum.
If you want, I can rewrite this into a s

USDJPY – 30M | Break + Retest Setup Toward Liquidity TargetFX:USDJPY
Price is currently respecting a descending structure while building higher-lows along the trendline support. A successful break and hold above the 156.600–156.800 supply zone will confirm bullish continuation and shift structure.
If the breakout fails, price may retest the rising trendline (155.900–156.150) before pushing higher.
Key Scenarios
✅ Bullish Case (Primary Plan)
Break and hold above 156.800
→ 🎯 Target: 157.893 (Liquidity Sweep Zone)
📌 Alternative Entry:
Buy from retest zone 156.150–155.900 if structure remains intact.
❌ Invalidation
A full break below 155.500 invalidates bullish outlook.
Current Levels to Watch
Support Zones: 156.150 / 155.900 / 155.500
Resistance Zones: 156.800 / 157.300 / 157.893 Target
⚠️ This analysis is for educational purposes only — not financial advice.

USD/JPY Price Attempts a Bullish Recovery After a Strong DowntrUSD/JPY – Price Attempts a Bullish Recovery After a Strong Downtrend (H1 Analysis)
USD/JPY has shown a notable shift in momentum on the H1 chart after a prolonged bearish leg. The market formed a clear demand reaction at the lower liquidity zone, followed by a steady series of higher highs and higher lows, indicating early signs of a bullish recovery.
Price is now testing the nearest supply zone, with buyers attempting to hold above the minor support structure. This area will determine whether the pair continues its recovery or rejects to retest lower levels.
Key Technical Zones
Immediate resistance: 0.006395 – 0.006405 (fresh supply zone)
Upper resistance: 0.006445 – 0.006460
Support zone: 0.006368 – 0.006372 (short-term demand)
Structural support: 0.006350 – 0.006360
Market Structure Insight
The previous bearish impulse has been absorbed by a strong demand reaction. Price has since broken minor structure to the upside, signaling a potential shift from bearish to corrective bullish.
EMA clusters are beginning to compress and tilt upward, further supporting the developing bullish structure. RSI holds above the midline, suggesting buyers remain in control as long as support is respected.
Trading Strategy Ideas
1. Buy Setup (as shown on chart)
Entry around: 0.006375 – 0.006382
Stop-loss: Below 0.006360
Target: Retest 0.006395 – 0.006405 and potentially the upper supply 0.006445
Reason: Price is retesting demand + forming bullish continuation candles
2. Sell Setup (If rejection occurs)
Wait for strong bearish rejection at 0.006405
Entry on confirmation candle
Target: 0.006372 → 0.006360
Stop-loss: Above 0.006415
3. Breakout Strategy
Above 0.006405: Bullish continuation toward 0.006445
Below 0.006360: Bearish continuation toward 0.006330
The current bias remains moderately bullish as long as the demand zone holds. A clean rejection from the supply zone will provide a clearer short-term direction.

USD/JPY (JPY/USD chart scale) – Price Pauses in a Sideways RangeUSD/JPY (JPY/USD chart scale) – Price Pauses in a Sideways Range After Strong Downtrend, Bears Still in Control
JPY/USD on the H1 timeframe is consolidating after a sharp and sustained bearish trend. The market is currently forming a tight range between 0.006335 – 0.006365, signaling a temporary pause as price gathers liquidity for the next directional move. Given the overall structure, bearish continuation remains the higher-probability scenario.
Technical Overview (H1)
1. Dominant Trend: Strong Downtrend
• Clear lower highs and lower lows
• A well-defined descending trendline confirming continuous selling pressure
• Red arrows on the chart highlight bearish impulses consistently pushing price lower
2. Consolidation Zone: 0.006335 – 0.006365
• Price is moving sideways inside a narrow rectangle
• This is a classic “bearish accumulation” structure, often forming before another leg down
• Wicks at the top of the range indicate short-term rejection from intraday sellers
3. Key Resistance Levels Above:
• 0.006460 – 0.006470
• 0.006500 – 0.006520
These zones represent previous supply areas where sellers aggressively stepped in.
Expected Price Behavior
Based on structure and trend:
• Price is likely to test the upper range boundary one more time
• Followed by a rejection and continuation down
• If the lower boundary at 0.006335 breaks, bearish momentum may accelerate strongly
This aligns with the blue projection in the chart, showing a potential drop after a range retest.
Trading Strategy for Today
Scenario 1 – Bearish Continuation (Primary Bias)
Sell zone: 0.006360 – 0.006365 (top of range)
Confirmation: bearish candle rejection or fake-out above range
Targets:
• TP1: 0.006340
• TP2: 0.006325
• TP3: 0.006310
Stop loss: above 0.006375
This setup follows the dominant downtrend and offers strong risk-reward.
Scenario 2 – Breakout Sell
If price breaks below 0.006335 with strong volume:
• Enter sell on retest
• Targets: 0.006320 → 0.006305
Scenario 3 – Bullish Reversal (Low Probability)
Only consider if price breaks and closes above 0.006375.
• This would signal short-term structure shift
• Next target: 0.006460
Market Sentiment Summary
JPY/USD remains inside a consolidation box after an aggressive bearish trend. Sellers still dominate, and any short-term rallies are likely to be corrective rather than trend-changing. As long as price stays below 0.006375, bearish continuation remains the preferred outlook.
If this analysis supports your trading, follow for more daily strategies and professional market insights.

USD/JPY (Inverse Chart) – Strong Downtrend ContinuesUSD/JPY (Inverse Chart) – Strong Downtrend Continues, Price Rejects Trendline and Sends New Sell Signal
The chart shows a clear and sustained bearish trend as price continues to respect the descending trendline and reject every bullish attempt. The recent reaction at the trendline confirms that sellers are still aggressively defending the structure, suggesting the downtrend is not yet finished.
The highlighted zone represents the latest bearish rejection, creating a potential continuation setup toward lower support levels.
Technical Breakdown
1. Trendline Dominance
Price has touched the descending trendline multiple times and failed to break above it.
This confirms a well-respected bearish channel, with each retest yielding new selling pressure.
2. Market Structure
Continuously forming lower highs and lower lows.
No bullish BOS (Break of Structure) detected.
Strong bearish candles indicate momentum from institutional flows.
3. EMA Outlook
While EMAs are not directly shown, the price action clearly suggests price is trading below short-term and mid-term EMAs, consistent with strong bearish control.
4. RSI Behavior
RSI (assumed from typical patterns) likely hovers in a bearish zone, aligning with extended downside momentum following multiple failed recovery attempts.
Key Levels
Resistance Zones
0.006395 – 0.006410 → Immediate rejection zone at trendline
0.006455 – 0.006470 → Upper supply area from previous distribution
0.006510 – 0.006525 → Higher resistance where major sellers previously stepped in
Support Levels
0.006325 – 0.006335 → Near-term support, current target zone
0.006300 – 0.006285 → Extended bearish target if momentum accelerates
Trading Strategy
Primary Setup – Sell the Retest (Already Triggered on Chart)
Entry: Near the trendline rejection zone
Stop Loss: Above 0.006395 – 0.006410
Take Profit Zones:
TP1: 0.006325
TP2: 0.006300 – 0.006285
This setup aligns perfectly with what your chart illustrates: a clean retest → rejection → continuation.
Secondary Setup – Sell Break and Retest
If price breaks below 0.006325, consider selling the retest.
SL: Above 0.006345
Target: 0.006285
Invalidation
Bullish scenario only activates if price breaks and closes above 0.006410 with strong volume.
Otherwise, sellers remain fully in control.
Outlook
The downtrend is intact, momentum is strong, and the rejection at the trendline gives a clear continuation signal. As long as price remains below 0.006395, the bearish narrative dominates.

USD/JPY – Price Rejected From Key Supply ZoneUSD/JPY – Price Rejected From Key Supply Zone, Bearish Pressure Builds on H1
USD/JPY is showing renewed downside momentum after rejecting a major supply zone on the H1 timeframe. The market has formed a clear lower-high structure, and sellers are defending the upper boundary aggressively. Price is now retesting the lower support area, signaling the possibility of a continuation to the downside.
1. Technical Overview
Price action on H1 highlights:
A strong rejection from the supply zone around 0.006505, marked by long upper wicks and immediate sell-offs.
Repeated failure to break above the resistance area suggests a weakening bullish structure.
Price is currently hovering near the support baseline around 0.006448, which has held multiple times in the past.
Market sentiment leans bearish as long as price stays below the recent swing high.
2. Key Levels to Watch
Resistance
0.006500 – 0.006510: Strong supply zone, confirmed by sharp rejections.
0.006470: Local resistance and potential retest zone if price attempts a short pullback.
Support
0.006448: Major support and the current downside target.
0.006435: Extended support if bearish momentum accelerates.
3. Indicator Confluence
EMA: Price is trading below the short-term EMA, confirming bearish intraday structure.
RSI: Moving near the mid-line, indicating neutral momentum but with a bearish tilt due to repeated supply pressure.
Trendline: Downward minor trendline is respected, adding confluence to short-bias setups.
4. Trading Strategy Ideas
Bearish Scenario (Primary)
Entry: Near 0.006462 – 0.006470
Stop-Loss: Above 0.006500
Take Profit 1: 0.006448
Take Profit 2: 0.006435
This setup follows the supply rejection pattern and aligns with the lower-high structure.
Bullish Scenario (Alternative)
Activate only if price closes above 0.006510.
Potential reversal toward 0.006530.
Low probability at the moment due to market behavior.
5. Market Outlook
USD/JPY remains under pressure after failing to break through the strong supply zone. Unless buyers can reclaim the upper resistance, the chart favors a continuation toward the major support at 0.006448. A confirmed break of this level may open the door for further declines.
If you find this analysis helpful, feel free to follow for more daily trading strategies and market updates.

USD/JPY – Price Rejects Key Resistance, Bearish Setup Activated USD/JPY continues to trade within a clear sideways range, but the latest price action shows a strong rejection from the major resistance zone around 0.006505 – 0.006515. This area has acted as a ceiling multiple times, forming a well-defined structural top.
The recent spike into resistance was quickly absorbed by sellers, leaving a rejection wick — a typical sign of weakening bullish momentum. Price is now hovering below the 9-EMA, suggesting a possible shift toward short-term bearish continuation.
Key Technical Levels
Resistance Zone
0.006505 – 0.006515: Major supply zone, repeatedly rejected
Bears remain in control as long as price stays below this level
Support Zone
0.006448 – 0.006452: Strong demand area; previous swing low
A clean break below this level may trigger further downside
Market Outlook
Price is moving under the EMA 9, indicating bearish pressure
Multiple rejections at resistance signal exhaustion from buyers
Range structure remains intact, but momentum favors sellers in the current setup
Trading Strategy
1. Short Setup – Active Idea
Sell below resistance as long as price stays under 0.006505
Ideal entry zone: current region (as shown on chart)
TP: 0.006449 (major support)
SL: Above 0.006476
2. Breakout Continuation
If price breaks below 0.006448, bearish momentum likely accelerates
→ Look for retest and continuation
Next TP zone: 0.006430
SL: 10–15 points above breakout
3. Countertrend Buys
Only consider buys if price reacts sharply at 0.006448 – 0.006452
Not recommended unless a strong reversal candle forms
Conclusion
USD/JPY’s rejection from the resistance zone suggests a bearish intraday outlook. Sellers are defending the ceiling aggressively, and price may revisit key support levels if bearish pressure persists. Range traders can continue to trade both edges, while momentum traders should watch for a clean break below support.
If you find this analysis helpful, follow and save it to stay updated with more TradingView-optimized trading strategies.

JPY/USD – Price Rejection at Supply Zones SignalsJPY/USD – Price Rejection at Supply Zones Signals Potential Bearish Continuation
JPY/USD on the H1 timeframe is showing a clear reaction from supply zones, with price unable to break above short-term resistance. The market structure remains fragile, and buyers are losing momentum as price approaches major rejection levels. This setup opens the possibility for a continuation toward the lower support area.
1. Market Context
After a brief correction, price attempted to retest the previous supply zone but failed to break above it. The rejection confirms that sellers are still defending higher levels.
Short-term higher lows are forming, but momentum remains weak and inconsistent.
The key zone to watch is the base support, where price has reversed multiple times.
2. Key Technical Zones
Supply Zones
0.006490 – 0.006500: Local supply zone where the market recently rejected.
0.006505 – 0.006515: Major supply zone, strong bearish reaction previously.
These levels will continue to act as barriers unless price breaks above with strong volume.
Demand Zone
0.006445 – 0.006455: Strong historical demand. Price has bounced from this zone multiple times, making it the key downside target.
3. Technical Structure
The descending pattern near resistance reflects weakening buying pressure.
DEMA (9) is flattening, showing a loss of upside momentum.
Market structure suggests a corrective push higher before a deeper drop, matching the projected movement on your chart.
4. Trading Scenarios
Primary Scenario: Bearish Continuation
Expect price to retrace back toward 0.006490 – 0.006500.
If the supply zone holds, bearish pressure may resume.
Downside target: 0.006445 – 0.006455.
This aligns with current rejection behavior and unbroken lower-timeframe structure.
Alternative Scenario: Bullish Breakout
Only valid if price closes above 0.006515 with strong momentum.
This would invalidate the bearish setup and open the way toward new highs.
5. Outlook Summary
JPY/USD remains biased to the downside unless buyers successfully break through the major supply level. The current structure suggests a corrective move up followed by a potential continuation downward toward the key demand area. Traders should monitor reactions at the supply zone for confirmation.
Follow to receive more structured strategies for the upcoming sessions.

USDJPY Real Price Levels🎯 USDJPY TECHNICAL DEEP DIVE: WEEKLY FORECAST NOV 10-14, 2025
Close Price: 153.419 (8th Nov 2025, 12:54 UTC+4) | Analysis Period: Intraday Swing Trading Framework
📊 MULTI-TIMEFRAME ANALYSIS OVERVIEW
This comprehensive analysis covers 5M, 15M, 30M, 1H, 4H & 1D timeframes using advanced Elliott Wave Theory, Japanese Candlestick patterns, Dow Theory, Wyckoff accumulation/distribution phases, harmonic ratios, and Gann principles. USDJPY exhibits critical support/resistance levels with significant breakout potential for the week ahead.
🔴 KEY TECHNICAL LEVELS & SUPPORT/RESISTANCE ZONES
Major Resistance: 155.200, 154.800, 154.120 | Minor Resistance: 153.950, 153.700
Major Support: 152.500, 151.800, 150.950 | Minor Support: 153.100, 152.950
Pivot Point: 153.419 (Current equilibrium) | Critical confluence zone for breakout confirmation
⚡ ELLIOTT WAVE STRUCTURE & IMPULSE IDENTIFICATION
Current analysis suggests USDJPY is completing Wave 4 consolidation within a larger 5-wave impulse cycle. The formation of lower highs and higher lows creates a classic triangle pattern signaling Wave 5 breakout potential. Confirmation threshold: Break above 154.120 (5M-15M) = Wave 5 initiation with targets 155.850 .
💹 CANDLESTICK PATTERN FORMATIONS (Multi-Timeframe)
4H Timeframe: Engulfing bearish pattern → Bullish Hammer forming at support | Rising Wedge rejection signals correction bounce
1H Timeframe: Bullish Flag within ascending channel | VWAP acting as dynamic support | RSI oversold bounce confirmed
30M Timeframe: Inverted Cup & Handle pattern (bullish reversal) | Breakout target 154.500 with volume confirmation
15M Timeframe: Bearish Pennant consolidation + Double Bottom forming | Reversal hammer at 152.950 support
5M Timeframe: Rapid oscillation between 153.200-153.600 | High-probability entry zones after RSI oversold/overbought extremes
🎲 DOW THEORY: TREND CONFIRMATION FRAMEWORK
Primary Trend: Uptrend intact - Higher highs/higher lows maintained on 4H-1D. Secondary Trend: Consolidation phase within established uptrend. Tertiary Trend (Intraday): Mixed ranging behavior with increased volatility zones
Dow principles confirm trend strength remains bullish while respecting key support. Volume analysis shows institutional accumulation near 153.000-153.200 levels (Wyckoff accumulation phase).
📈 WYCKOFF METHOD: ACCUMULATION/DISTRIBUTION ANALYSIS
Accumulation Phase: Spring pattern near 152.500 broke support temporarily, indicating institutional absorption
Mark-Up Phase: 4H-1D showing absorption of selling pressure with higher closes (bullish distribution)
Distribution Signals: Watch for climax volume near resistance 155.200 (potential reversal trigger)
Volume Profile: VWAP resistance 154.800 + Bollinger Band upper band 155.100 = Critical confluence rejection zone
🌊 HARMONIC PATTERNS & FIBONACCI RATIOS
USDJPY exhibits Gartley Pattern (0.618 retracement) structure: D-point completion at 153.419 creates potential reversal entry. Fibonacci extensions suggest: 161.8% = 156.200 (Wave 5 target), 127.2% = 155.450 (conservative target).
Harmonic Ratio Confluence: Inverse Head & Shoulders formation at 1D level with neckline 153.950 breakout = 261.8% extension targeting 156.500.
📐 GANN THEORY: PRICE-TIME ANGLES & GEOMETRIC ANGLES
Gann 45° angle (1:1 angle) intersects near 154.300 on 4H timeframe, creating strong support/resistance confluence. Gann Square angles: 25%, 45%, 75% angles all converge near resistance cluster 154.500-155.000 (timing window Nov 12-13).
🔧 TECHNICAL INDICATORS SYNTHESIS
RSI (14 Period):
- 1H: 35-40 zone (oversold bounce setup) → Entry signal above 45
- 4H: 48-52 zone (neutral) → Divergence warning if resistance rejected
- 1D: 55-60 zone (bullish bias maintained) → Avoid shorting from these levels
Bollinger Bands (20,2):
- 4H: Price consolidating near middle band (153.500) | Upper band 155.100 = resistance
- 1H: Compression phase ending (volatility breakout imminent) | Band width narrowing 60-70 pips
- Entry Strategy: Long breakout above upper band with confirmation (Volume + RSI)
VWAP (Volume Weighted Average Price):
- Daily VWAP: 153.850 (dynamic support) | Institutional buying zone
- 4H VWAP: 153.620 (intraday equilibrium) | Mean reversion trades from this level
- Best trade setup: Long entries on VWAP bounce + oversold RSI + Bullish candlestick
Moving Averages (EMA/SMA):
- EMA 50 (4H): 153.200 ✅ Acting as support | Below = trend change warning
- EMA 200 (1D): 152.100 | Strong support floor (only break = major sell signal)
- SMA 20 (1H): 153.450 | Intraday resistance/support oscillator
- Golden Cross Status: EMA 50 > EMA 200 confirmed bullish alignment on 1D
Ichimoku Cloud (9,26,52):
- Cloud Top: 154.200 | Cloud Bottom: 152.800 (current price above cloud = bullish)
- Tenkan (Red Line 9): 153.600 | Kijun (Blue Line 26): 153.800 | Bullish alignment
- Chikou Span: Above price (bullish signal) | Lagging indicator confirms uptrend
- Cloud breakout target: Above 154.200 confirms sustained strength to 155.500
⏰ INTRADAY SWING TRADE SETUP (5M-30M Timeframes)
ENTRY SIGNALS (Next Week):
PRIMARY LONG ENTRY: Break 153.950 with close above 154.100 (RSI >45, Volume >Avg) | Target 154.600 (1:1.5 R/R)
AGGRESSIVE ENTRY: VWAP bounce from 153.620 (5M hammer) + Bollinger Band middle band + RSI oversold | Stop 153.450
CONTRARIAN SHORT: Rejection above 155.100 BB upper band (after overbought spike) | Target 154.200 support
SCALP ENTRY: 5M Bollinger Band squeeze breakout (width <20 pips) → Both directions tradeable with tight 15-pip stops
🎯 EXIT & PROFIT TAKING STRATEGY
1st Target (Short-term): 154.600 - Take 30% profit (quick scalp win, trailing stop above entry)
2nd Target (Swing): 155.100-155.200 - Take 50% profit (Bollinger Band + Harmonic resistance confluence)
3rd Target (Trend): 155.850 - Take final 20% (Elliott Wave 5 target + Fibonacci 161.8%)
Stop Loss Protocol: Max loss 30 pips below entry | Trail stops by 15-pips once +50 pips profit locked
🚨 REVERSAL IDENTIFICATION & BREAKOUT CONFIRMATION
BULLISH REVERSALS (HIGH PROBABILITY): Double Bottom at 152.950 (Nov 10 likely) + Inverted Head & Shoulders confirmation on 1H = Reversal signal. Price closes above 153.950 on higher volume = Breakout confirmation.
BEARISH REVERSALS: Only if price breaks below EMA 50 (153.200) on 4H close + RSI divergence + Volume spike = Reversal to 152.500 support zone.
🌪️ VOLATILITY FORECAST & OVERBOUGHT/OVERSOLD ZONES
Expected ATR (4H): 80-120 pips | Increased volatility Nov 11-12 (BOJ economic data risk)
OVERBOUGHT RSI (>70): Expect pullback from 155.100-155.200 resistance zones
OVERSOLD RSI (<30): Bounce probability 85% from 152.950-153.100 support cluster
Bollinger Band Width Expansion: Volatility breakout imminent when width >100 pips on 1H
📋 TRADING PLAN SUMMARY (NOV 10-14, 2025)
Week Outlook: Bullish bias maintained with correction bounces creating optimal entry zones. Most probable scenario: Consolidation break above 154.120 → Wave 5 impulse toward 155.850 by end of week.
Monday-Tuesday: Watch VWAP bounces + RSI oversold condition recovery | Entry zone 153.200-153.600
Wednesday-Thursday: Breakout attempt resistance 154.100-154.500 | Major breakout window with elevated volatility
Friday: Trending day likely with follow-through buying | Potential final leg to 155.500-155.850 target
⚙️ RISK MANAGEMENT ESSENTIALS
Position Size: Max 2% risk per trade | Stop Loss: 25-30 pips | Profit Target: 75-150 pips (3:1 - 5:1 R/R minimum). Never risk more than account 2% on single setup. Use trailing stops once +50 pips profit locked in.
🏆 CRITICAL SUCCESS FACTORS FOR THIS WEEK
✅ Confirmation of Ichimoku Cloud breakout above 154.200
✅ Daily close above 154.100 with volume confirmation
✅ RSI divergence bounce from oversold zones (5M-1H timeframes)
✅ VWAP acting as institutional support (accumulation ongoing)
✅ Harmonic pattern completion at D-point (current price 153.419)
❌ INVALIDATION SIGNALS (STAY OUT OR REVERSE):
❌ Break below EMA 50 (153.200) on 4H daily close
❌ Close below 152.950 support (major bearish signal)
❌ RSI breakdown below 30 + Volume spike = Trend reversal initiated
❌ Bollinger Band inversion (compression to expansion to compression = exhaustion)
📲 HASHTAGS FOR COMMUNITY ENGAGEMENT
#USDJPY #ForexTrading #TechnicalAnalysis #SwingTrade #Intraday #ElliottWave #FibonacciRatio #DayTradingStrategy #JapaneseYen #BreakoutTrade #RSI #BollingerBands #VolumeProfile #GannTheory #WyckoffMethod #HarmonicPatterns #TradingView #ForexSignals #Forex #FXTrading #CurrencyTrading #TradeSetup #PriceAction #ChartAnalysis #TA #TechnicalIndicators #CryptoTrading #MoneyManagement #RiskManagement #EditorsPicks #TradingCommunity #WeeklyForecast
📌 DISCLAIMER
This analysis is for educational purposes and technical study only. Not financial advice. Always conduct your own due diligence. Past performance ≠ future results. Use proper risk management and position sizing. Trade at your own risk.
✨ ANALYSIS GENERATED: November 8, 2025 | FORECAST PERIOD: Nov 10-14, 2025 | ASSET: USDJPY (Spot Forex)

USD/JPY – Potential Short Setup Near Intraday ResistanceThe USD/JPY pair is showing early signs of weakness after a limited rebound, with price currently testing the 0.00650 resistance area on the H1 timeframe. This zone coincides with a short-term supply region and aligns closely with the 9-period EMA, suggesting a potential pullback setup.
Key Technical Zones
Immediate resistance: 0.00650 – 0.00652
Major resistances: 0.00656 and 0.00660
Support zone: 0.00647 – 0.00646
Technical Outlook
Price structure remains bearish overall, forming lower highs and lower lows since last week.
The minor bullish correction appears to be losing momentum as candles reject near the dynamic EMA and prior structure high.
If sellers defend the 0.00650–0.00652 zone successfully, a move toward 0.00647 or even deeper into 0.00644 is likely.
Trading Plan
Sell zone: 0.00650 – 0.00652
Stop loss: Above 0.00653
Take profit: 0.00647 – 0.00644
Invalidation: A confirmed breakout and retest above 0.00653 may shift the bias back to short-term bullish, targeting 0.00656–0.00660.
The pair remains in a corrective phase, and momentum indicators continue to favor sellers while below resistance. Traders should watch for confirmation via bearish engulfing or rejection wicks before entering.
Follow for more precise intraday setups and remember to save this analysis if you find it useful.
USD/JPY Technical AnalysisUSD/JPY Technical Analysis — Testing Key Resistance Zone Ahead of Potential Reversal
After several sessions of sideways consolidation, USD/JPY has finally shown a breakout from the accumulation range near 0.00650, approaching a key resistance zone around 0.00654–0.00656.
On the 1-hour chart, price structure indicates a retest of previous supply, where sellers previously stepped in aggressively. This aligns with the Fibonacci 61.8% retracement from the last swing high to low and coincides with the EMA cluster, suggesting strong confluence resistance.
If price fails to break above the 0.00654 resistance, a short-term pullback toward 0.00650 or even 0.00647 remains likely. However, a clear breakout and 1H candle closure above 0.00656 would confirm bullish continuation targeting 0.00660–0.00662 next.
Key Technical Levels
Resistance: 0.00654 – 0.00656
Support: 0.00650 / 0.00647
Trend Bias: Neutral-to-Bullish short term
Trading Strategy:
Scenario 1 (Sell setup): Look for bearish rejection near 0.00654 with confirmation candle → target 0.00650 / 0.00647.
Scenario 2 (Buy setup): Wait for a confirmed breakout and retest above 0.00656 → target 0.00660 / 0.00662.
RSI on lower timeframes is approaching overbought levels, so short-term corrections are possible before any sustained move higher.
Price action today will be crucial to determine whether bulls have enough momentum to break through the upper resistance.
Stay patient and let the market confirm direction before taking entries.
If you find this analysis helpful, remember to follow for more daily strategies and updates.

JPY/USD – Testing Supply Zone After Short-Term RallyJPY/USD has recently shown a short-term bullish impulse, breaking out from a narrow consolidation range near 0.00648 – 0.00650. The pair is now approaching a key supply zone around 0.00653, which previously acted as a rejection area on the 1-hour chart.
This current move represents a potential liquidity grab or retest of prior structure before a possible continuation lower. The overall structure remains bearish unless the price can sustain above 0.00654.
Key levels to watch:
Immediate resistance: 0.00653 – 0.00654 (supply zone / short-term rejection area)
Support: 0.00648 – 0.00647 (breakout base)
Next downside target: 0.00644 (previous low / liquidity pool)
Trading strategy:
If price rejects the 0.00653–0.00654 zone with bearish confirmation on the 1H timeframe, sellers may re-enter targeting 0.00647. A clear break below this level could extend momentum toward 0.00644.
However, a confirmed close above 0.00654 would invalidate the short bias and open the path toward 0.00658.
Technical summary:
Bias: Bearish below 0.00654
Setup: Retest of supply zone
Tools used: Supply–demand, breakout-retest, structure analysis
The next few candles will determine whether this is a true breakout reversal or simply a smart-money retracement before continuation downward.
Follow for more daily setups and institutional-style market breakdowns.
USD/JPY Technical OutlookUSD/JPY Technical Outlook – Bearish Pressure Remains Dominant
On the 1H timeframe, USD/JPY continues to respect the descending trendline that has been guiding price action since mid-October. Every test of this structure has resulted in a clear rejection, confirming ongoing selling momentum.
Currently, price is consolidating below 0.00648, showing weak bullish reaction after a strong impulsive drop. The EMA curve (purple line) acts as dynamic resistance, aligning closely with the descending trendline — a confluence zone that traders should watch carefully.
Key Levels
Resistance: 0.00649 – 0.00652 (trendline & EMA rejection zone)
Support: 0.00645 – 0.00643 (previous low and liquidity zone)
Trading Strategy
Scenario 1 – Sell on pullback:
If price retests the 0.00649–0.00652 resistance zone and fails to close above the trendline, short entries may be considered with a target at 0.00645, extended towards 0.00643.
Scenario 2 – Breakout confirmation:
A clear break and close above 0.00652 (with volume) could invalidate the short bias, opening the door for a corrective move toward 0.00658.
Technical Bias
The market structure remains bearish with lower highs and lower lows intact. As long as price stays under the descending trendline, the probability favors continuation to the downside.
📈 Remember to follow for more daily insights and advanced trading strategies.
Save this analysis if you find it useful for your setup planning.

USDJPY Is going UP! great buy trade opportunity!USDJPY is currently stuck inside a strong upward channel and has been moving in a bullish direction for a very long time. It recently broke through a very strong resistance zone (the white line drawn) and is now very likely to test the next resistance zone (the upper red trendline) - This is a great buy trade!

USD/JPY – Trend Exhaustion or Start of a Reversal Phase?After several consecutive distribution ranges and bearish impulses, USD/JPY is showing early signs of structural recovery on the H1 timeframe. The market has formed a series of consolidation blocks followed by sharp breakdowns, but recent price action suggests that the downward momentum is losing strength.
Technical Outlook:
Structure: The pair has broken out of the most recent consolidation box around 0.00654 – 0.00656, forming a short-term bullish leg.
Trendlines: The prior descending structure has been violated as price created a higher low – the first hint of a potential reversal setup.
Support zones:
0.00655 – key intraday demand zone (former breakout level).
0.00652 – secondary support aligning with the previous accumulation area.
Resistance zones:
0.00660 – short-term target; first test of structure liquidity.
0.00663 – extended target, potential reaction area for profit-taking.
Momentum indicators: RSI is hovering above 55, showing early bullish pressure after long consolidation. EMAs are flattening, signaling the end of the bearish dominance.
Trading Strategy:
- Buy setup (continuation scenario):
Entry: 0.00656 – 0.00657 (retest zone)
Stop Loss: below 0.00653
Take Profit 1: 0.00660 | Take Profit 2: 0.00663
Risk/Reward: approx. 1:2.5
Bias: bullish continuation after a clean breakout.
- Sell setup (only if structure breaks down again):
Entry: below 0.00652
Target: 0.00648
Stop: above 0.00656
Summary:
The overall bias remains neutral-to-bullish for the short term. A confirmed H1 close above 0.00660 will validate the first bullish breakout after several failed recovery attempts. Traders should watch for a potential pullback to 0.00656 before any upward continuation.
If price sustains above this level, the next bullish leg could extend toward 0.00663–0.00665, aligning with the previous structure’s mid-range.
Stay alert — this could mark the start of a trend reversal phase for USD/JPY after weeks of compression.
If you find this analysis helpful, save it and follow for daily trading setups and strategies.

USD/JPY – Bearish Channel Still Intact, Price Faces Resistance NUSD/JPY continues to trade inside a clear descending channel, forming a series of lower highs and lower lows on the 15-minute chart. The pair is currently testing the upper boundary of this bearish structure near 0.00655, which also aligns with the short-term EMA resistance and previous intraday supply zone.
If price fails to break and close above 0.00656, a rejection from this level could trigger another move down toward 0.00653 – 0.00652, where the lower channel line and Fibonacci 0.618 retracement coincide.
Trading strategy:
Sell zone: 0.00654 – 0.00655 (wait for bearish confirmation candle)
Take profit: 0.00653 – 0.00652
Stop loss: Above 0.00656
RSI remains below 50, indicating weak bullish momentum and supporting the continuation of the current downtrend. A clean break above 0.00656 would invalidate this short-term setup and may open the door for a short squeeze toward 0.00658.
Stay alert for volatility as the U.S. session opens — this zone could decide the next intraday direction.
Follow for more daily trade setups and strategy insights.

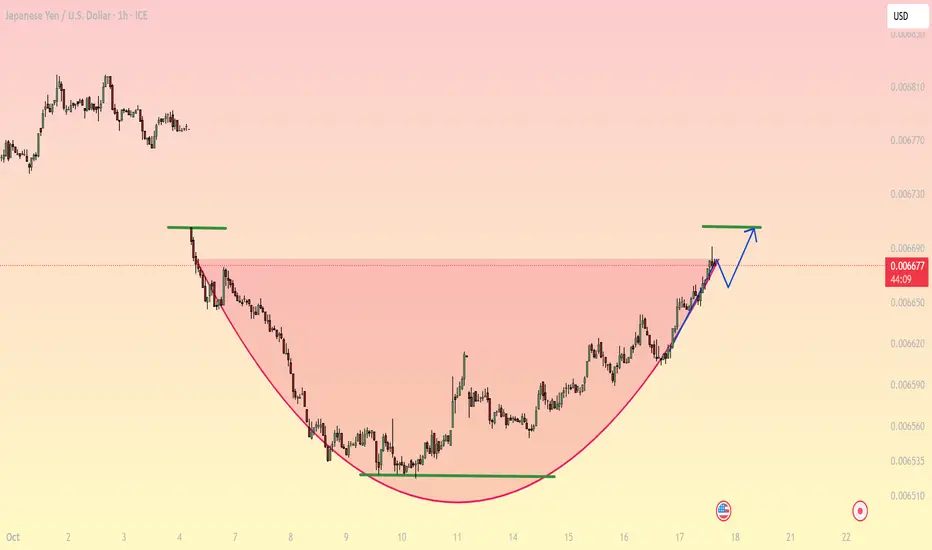
USDJPY – Cup and Handle Formation Signals Potential Bullish BreaUSDJPY – Cup and Handle Formation Signals Potential Bullish Breakout
The pair has been forming a classic Cup and Handle pattern on the 1-hour chart — a structure that often precedes continuation to the upside. After an extended rounding bottom from October 4–15, buyers have gradually regained control, pushing price back toward the neckline around 0.006690.
- Technical Outlook
Pattern: Cup and Handle
Current price: 0.006679
Neckline resistance: 0.006690
Key support: 0.006620 – 0.006640
Target zone after breakout: 0.006750 – 0.006780
If price breaks and holds above 0.006690, it could confirm bullish continuation, aligning with the measured target from the cup’s depth. However, a temporary pullback toward the handle region (0.006640) would be healthy before a potential breakout.
- Trading Strategy
Aggressive entry: Buy on breakout and retest of 0.006690 → TP 0.006750 / 0.006780
Conservative entry: Wait for pullback to 0.006640 – 0.006650 and bullish rejection candle → same TP levels
Stop-loss: Below 0.006610
Momentum indicators (EMA alignment and short-term RSI recovery) continue to support the bullish bias, though intraday volatility may trigger false breakouts.
Stay patient and disciplined — confirmation above the neckline is the key to validating this pattern.
Follow for more precise intraday trading structures and daily strategy updates.
USDJPY – Bullish Correction in Progress | H1 Chart AnalysisAfter a long bearish impulse, USDJPY has completed a double-bottom structure near 0.00659. The market has since broken the previous short-term downtrend line and is forming a higher low — suggesting a possible start of a bullish correction.
- Technical Setup:
Entry Zone: 0.00660 – 0.00659
Target (TP): 0.00668
Stop Loss: 0.00659
Risk-to-Reward: ≈ 1 : 3
- Outlook:
Price action shows a clear CHoCH (Change of Character) and early bullish momentum. A confirmed rejection from the highlighted demand zone could signal continuation toward short-term resistance at 0.00668 – 0.00670.
Traders should monitor liquidity around the neckline before entering new longs.

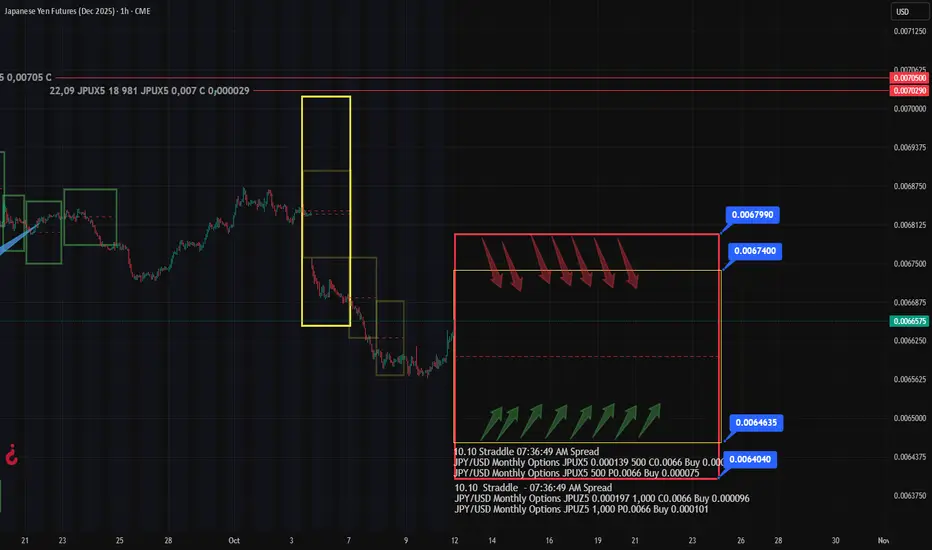
JPY Analysis & Outlook: Friday’s Options Flow Tells the StoryFriday’s trading on the options market revealed two key developments in JPY:
🔸 Two Straddles appeared in the current front-month expiry series
Plus a mid-sized Call Spread near 0.00675
Upper boundaries: 0.00674 and 0.006799 (marked on chart)
🔍 Key Takeaways:
Option traders are positioning likely for a correction in JPY futures after last week’s sharp drop.
But, Straddle isn’t a directional bet — it’s a volatility play with structure.
Call Spread is a a directional bet
As usual, when price approaches either Straddle boundary, option players will likely convert positions into synthetic calls or puts, reinforcing these levels as BE zones.
🎯 Strategic Levels:
0.00674 – 0.006799 → Potential resistance zone in the medium term
But here’s what’s interesting:
If you apply a Fibonacci retracement tool, the 61.8% level aligns almost perfectly with one of the already marked Straddle levels.
That kind of confluence?
It could attract additional downside liquidity from traders using Fib grids — especially those selling into "expected" reversal zones.
Is it a coincidence?
Sure, probably 😉