Kaspa - Possible Short TradeIn my previous TV idea, I entertained the bullish case for KAS. While I cannot rule out a bullish breakout, evidence for a double top formation and a consequent drop is piling up.
Pros:
1. Kaspa is holding above the 21D & 50D EMAs. As long as the daily TF is bullish, I cannot rule out continuation to the upside.
Cons:
1. Although Kaspa made a HH, The RSI was showing a bearish divergence.
2. The RSI is showing a sharp decline in momentum. IMO, it shows that traders and investors are reluctant to buy or enter a long trade at this level.
3. The daily chart also shows a bearish divergence on the RSI.
4. KAS broke an upward sloping trend line (daily and the 4H). In my trading system a violation of a diagonal trend line is serious because the diagonal includes two axis’ time, and price. In my experience, whenever an asset breaks a diagonal, you can expect a drop to the origin of the move (at least).
5. If traders and investors were eager to get into a trade on Kaspa, Friday’s (September
22nd) presented a perfect entry:
A SF candle with 21D EMA holding support followed by retrace to the 61.8% of the wick
and a move back above the 0.045 level. However, there was no follow through! KAS
cannot break above the 21 and 50 EMAs on the 1H
7. The 1H and the 4H already show a bearish cross (21 and 50 EMAs). A bearish cross is not
important in and of itself but, it indicates a direction, and the direction is likely lower.
8. IMO, break below the 0.045 level and the 21D EMA confirms a Double top pattern.
9. On the 1H Kaspa is compressing in a triangle pattern which suggests continuation down.
10. Bearish Divergence on the 1H also suggests that the most likely direction is lower.
11. A word of caution, Triangles are notorious for fake outs. For me, a triangle is just
confluence. I don’t enter trades on the breakout of or, a break down from a triangle.
Trade Idea:
• Entry: 0.444 (retest of the 21D as resistance)
• SL: 0.0474 (above the 21D and 0.045)
• Target: 0.0333 (possibly lower)
• TP: 0.04 (demand zone), 0.0333
• R: R: 1: 3.83
NFA.
What do you think? Please share in the comments.
Best wishes
Kaspa

KASUSDT Ascending Triangle BreakoutKASUSDT Daily is about to break out of a nice ascending triangle pattern. A fairly new crypto so no overhead resistance. Also breakout coincides with a market cap of around 1 billion.

Kas/Usdt (Bearish Behavior) Confluences to short:
1. Breaking out of the rising Bear Flag (watching)
2. Head and Shoulder pattern (confirmed)
3. Bearish Divergence on WEEKLY (confirmed)
4. Closing and retesting below 50 days EMA (watching)
Will be updating you guys on step by step process, stay tuned.
NOTE: DON'T SHORT IT YET, WAIT FOR ALL THE CONFIRMATION. TRADE AT YOUR OWN RISK.


Is Kaspa close to an imminent correction?This is not an investment advice but a humble idea of a potential crypto enthusiast.
Kaspa has represented a real exception within the current market conditions that have been experienced for some weeks now.
Kaspa has made a new ATH, something that for the holders is a success and for Short futures traders a misfortune.
However, not everything seems to be following the same path. The RSI is showing a real monstrous bearish divergence since weeks ago. And with this new ATH, things don't seem to be getting any better.
This points to a healthy (I might even say necessary) correction. Although, for this to happen, we must first fall below its trend line.
After the breakout, a pullback should be made near the dynamic support and continue with the correction.
If, consequently, the critical support is broken, there will be 2 important zones left to start an accumulation phase. Such areas are potential for the next bull market.
Buy zone 1: $0.024 - $0.022
Buy zone 2: $0.014 - $0.013
Managing purchases and following the plan is paramount to your financial success. Do your own research and decide your future.
----------------------------------------------------------
In this small space, I thank those who have seen my ideas and have given their support!

KAS | LONG - ABC CorrectionKAS is one of the strongest coins in the bear market at this moment.
We just had our ABC correction and now the MACD-Histogram is showing a bullish divergence.
KAS corrected to the golden ratio on the Fib and order block.
All together, I'm looking for a long trade, keep risk low!

KASUSD: Initiated the new rally phase to 0.1100KASUSD / Kaspa recovered the recently lost Support of the 1day MA50 and almost reached the August 7th High.
With the Rising Support holding, the long term bullish trend is intact.
Based on a similar rise since the start of the year, the price is just starting the new rally.
Buy now and target the 2.618 Fibonacci extension at 0.11000.
Follow us, like the idea and leave a comment below!!

Ascending Triangle on KAS - BULLISHLooks like there's potential for KAS to form an ascending triangle here.
Could fill out the entire shape shown in this chart, or break out sooner than later.
My bias is that it doesn't get filled out completely, but we'll see...

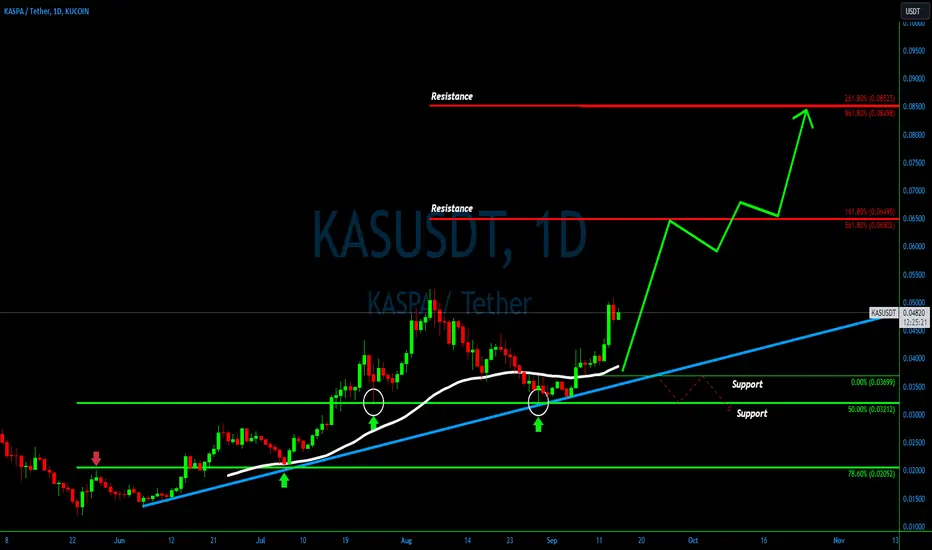
Charting the Path - KASUSDT Uptrend Story💎#KASUSDT has recently delivered an impressive performance, marking an almost 60% price surge since the month's commencement. This upward trajectory initiated following a bounce from the 50% Fibonacci support level at $0.032. Simultaneously, we observed a decisive rejection of the long-term uptrend trendline. These two pivotal events propelled the price upward, breaching the 50 Exponential Moving Average on the daily chart.
💎This price action underscores the credibility of a robust uptrend, significantly enhancing the likelihood of further growth. Consequently, #KASPA is poised to set its sights on one of the double Fibonacci resistance levels, situated at either $0.065 or $0.085.
💎However, prudent traders, or Paradisers as we like to call them, remain vigilant for opportune buying moments amidst the ascent. They avoid chasing the asset at its peak. Simultaneously, it's imperative to prepare for the scenario in which the price breaks below the recent support at $0.036. Such an occurrence would cast doubt on the continuation of the uptrend.
💎In light of these factors, implementing a sound money management strategy alongside clearly defined support and resistance levels is imperative for a well-rounded approach to trading.
KAS / KASUSDTGOOD LUCK>>>
• Warning •
Any deal I share does not mean that I am forcing you to enter into it, you enter in with your full risk, because I'll not gain any profits with you in the end.
The risk management of the position must comply with the stop loss.
(I am not sharing financial or investment advice, you should do your own research for your money.)

KASUSD: Above the 1D MA50, confirmed new rally.KASUSD crossed over the 1D MA50, which has been the Resistance last week, and on a bullish 1D technical outlook (RSI = 63.474, MACD = 0.006, ADX = 30.066) is extending the rise after making on September 5th a bottom on the long term Channel Up. The technical target is the 2.5 Fibonacci level (TP = 0.10500).
## If you like our free content follow our profile to get more daily ideas. ##
## Comments and likes are greatly appreciated. ##

#KAS/USDT 4h (ByBit) Broadening wedge on resistanceKaspa is facing 200MA where it already got rejected once, seems likely to retrace down to 50MA support.
⚡️⚡️ #KAS/USDT ⚡️⚡️
Exchanges: ByBit USDT
Signal Type: Regular (Short)
Leverage: Isolated (6.7X)
Amount: 5.0%
Current Price:
0.03945
Entry Targets:
1) 0.04020
Take-Profit Targets:
1) 0.03540
Stop Targets:
1) 0.04260
Published By: @Zblaba
$KAS BYBIT:KASUSDT.P #Kaspa #L1 #PoW kaspa.org
Risk/Reward= 1:2.0
Expected Profit= +80.0%
Possible Loss= -40.0%
Estimated Gaintime= 4-8 days

RSI Divergence on the KAS 3 Day Chart flipped GREENRSI Divergence on the $KAS 3 Day Chart flipped GREEN after bouncing off the bottom
Prior examples led to a big rally (2x - 7x)

Lowest risk entry on KAS - BULLISHKaspa currently finds itself at the bottom of the ascending channel, which has been a consistent support level.
Also near the bull market support band (20/21 week sma/ema), which has also been a support level.
Holding until the top end of the channel would provide nice ROI from an entry from this level if it holds again.
We also have a cup and handle (with a higher handle) that is still playing out.

BULLISH WEEKLY HEIKIN ASHIVery bullish looking chart for Kaspa. Following an ascending channel, bouncing off the 20/21 week SMA/EMA (bull market support band)
Heikin Ashi just turned GREEN on the weekly
Looks to be primed for upside!

KAS vs Early BTC: The Ascending ChannelYou can see here that the ascending channel that $KAS finds itself in is very similar to the early channel that BTC traded in before breaking out to $30.
If Kaspa repeats something similar, as it already is doing, it could lead to an epic move north of $1.00 USD.
KAS also consistently bounces off the 20/21 week SMA/EMA as has always done during a bull rally (green and red lines).
Any touches of those moving averages are strong buys, as far as I'm concerned. I'm not sure we will get a touch again in the near term, as the bottom side of the channel may hold as support.
It seems like we are in a deep value zone right now.
Previous monthly ATH close was around .0324, and that has held so far (not shown here). Also confluent with the bottom of the channel.
Downside is limited IMO. Bullish.

Kaspa vs Early BTC: Ascending Channel Breakout to $1.50+You can see here that the ascending channel that $KAS finds itself in is very similar to the early channel that CRYPTOCAP:BTC traded in before breaking out to $30.
If Kaspa repeats something similar, as it already is doing, it could lead to an epic move north of $1.00 USD.
KAS also consistently bounces off the 20/21 week SMA/EMA as has always done during a bull rally (green and red lines).
Any touches of those moving averages are strong buys, as far as I'm concerned. I'm not sure we will get a touch again in the near term, as the bottom side of the channel may hold as support.
It seems like we are in a deep value zone right now.
Previous monthly ATH close was around .0324, and that has held so far (not shown here). Also confluent with the bottom of the channel.
Downside is limited IMO. Bullish.

KASPA kas/usdt (Head and shoulder) ?In trading, the term "head and shoulders" refers to a popular chart pattern used in technical analysis to predict potential trend reversals. The head and shoulders pattern typically forms after an uptrend and is considered a bearish reversal pattern. It consists of three peaks or highs, with the middle peak (the "head") being higher than the two surrounding peaks (the "shoulders"). Here's how the pattern is typically identified:
Left Shoulder: This is the first peak and occurs during an uptrend.
Head: The highest peak of the pattern, representing a brief consolidation or continuation of the uptrend.
Right Shoulder: This is the third peak, usually lower than the head, and forms after a minor rally from the head.
The pattern is considered complete when there is a confirmation of a trend reversal. Traders often look for specific criteria to confirm the pattern:
Neckline: Draw a line connecting the lows of the left shoulder and the right shoulder. The neckline serves as a key support level.
Breakdown: A breakdown occurs when the price of the asset falls below the neckline, indicating that the pattern is valid and a trend reversal may be underway.
Volume: It's common to see a significant increase in trading volume when the breakdown occurs, confirming the pattern.
Once the head and shoulders pattern is confirmed, traders often use it as a signal to open short positions (sell) or to close long positions (take profits) in anticipation of a bearish move in the price of the asset.
It's important to note that while the head and shoulders pattern is a widely recognized and studied technical pattern, it is not foolproof, and false signals can occur. Traders often use additional technical analysis tools and indicators to confirm their trading decisions and manage risk.
In summary, the head and shoulders pattern in trading is a bearish reversal pattern that forms after an uptrend and is characterized by three peaks, with the middle peak (the head) being higher than the two surrounding peaks (the shoulders). It can be a signal that a trend reversal is imminent, but traders should use additional analysis and risk management strategies when trading based on this pattern.

Trend reversal coming soon, Bearish KASusdt/KaspaThis analyse is ANTI FOMO/FUD, this ananalyse is realistic. I hear stories from KASPA believers that Kaspa will defeat Bitcoin, that it will only go UP. we heard those stories million times with other projects, just to mention Luna, Solana, matic, FTT and so many more. what did they ALL HAVE IN COMMON? they ALL DUMPED.
So now, i look at kaspa, i see LOW volume, i see overbought RSI, i see bearish divergence, i see more than 30,000% price increase, i see almost 1 year of uptrend, this is all SIGNS of exhaustion and signs of TREND REVERSAL. nothing goes UP forever, when you see indicators flashing ALERTS, its time to LEAVE.
i predict with GOOD market condition and stable BTC, kaspa MAY STILL go to around 0,055 or 0,08 MAX.
BE CAREFUL. #kasusdt #bitcoin #kucoin #MEXC #kaspa MEXC:KASUSDT KUCOIN:KASUSDT COINEX:KASUSDT

RUNEUSDTIf this labeling is correct, we can expect the short-term growth of this currency in the form of a hypothetical wave B.
It goes without saying that the current four-hour candlestick can be the final confirmation of this scenario..if it closes like this..
We know that wave B will be time-consuming and complex and can be in any form.
Trading in corrective waves is always associated with high risks and risks, so we must have capital management and a moving stop.

Taraxa: 10x or -40% - or both?Taraxa is a BlockDAG coin like Kaspa ($KAS). $KAS has aroused interest in similar coins with its enormous price gains in recent months. Whether it's right or wrong in the case of Taraxa remains to be seen. In terms of charts, there is a relatively clear picture.
If NASDAQ:TARA successfully holds the $0.0060 level, I expect a return to the last high of $0.015. If the price breaks through this resistance, the markers in red are guide values for TP levels (levels, not points!).
If NASDAQ:TARA fails to hold $0.006, the $0.0035 to $0.0041 area is a very good area to accumulate.
If the price falls below this level, I will sell and only buy back after a successful return above $0.0041.
NFA. DYOR. I am a human being, and I have been married three times, so I'm obviously prone to error.

KASUSD Rebounded on the 1D MA50 but needs this level asap.Kaspa (KASUSD) is on the 4th straight bullish 1D candle following an exact rebound on the 1D MA50 (blue trend-line). This was the initial bullish signal after a 10 day correction within the Channel Up pattern that started on the May 24 bottom. That was also the bottom of the larger long-term Channel Up.
A similar sequence got rejected on the 0.618 Fibonacci retracement level on April 28 and eventually extended the decline to the -1.0 Fibonacci extension and hit the 1D MA200 (orange trend-line). As a result, if the price closes a 1D candle above the current 0.618 Fib, we will buy the break-out and target 0.1200 long-term (+900% from the May bottom). If it fails on the 0.618 Fib, we will sell and target the 1D MA200 at 0.02700.
-------------------------------------------------------------------------------
** Please LIKE 👍, FOLLOW ✅, SHARE 🙌 and COMMENT ✍ if you enjoy this idea! Also share your ideas and charts in the comments section below! **
-------------------------------------------------------------------------------
💸💸💸💸💸💸
👇 👇 👇 👇 👇 👇
