The Index is at plank mode, be patient then take position.Hello everyone!
From previous update, HSI uptrend mode is still on track.
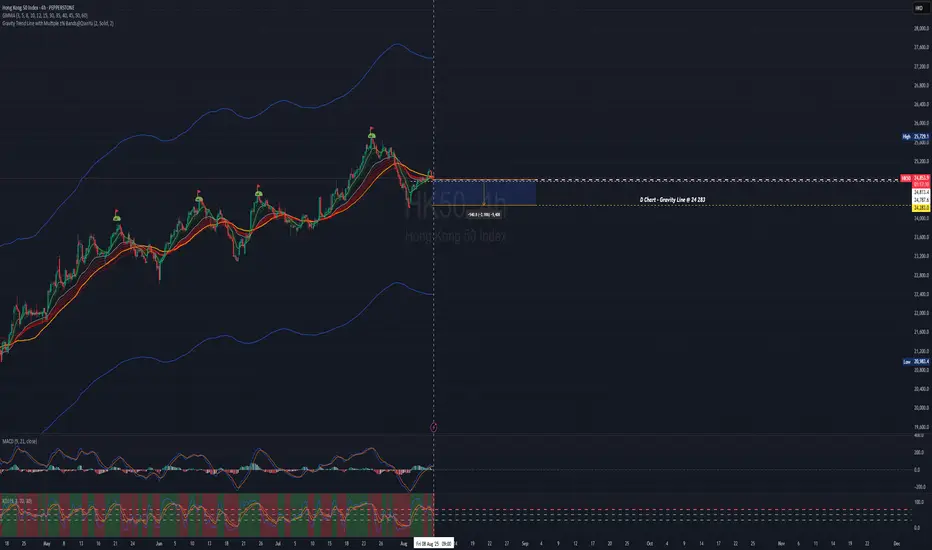
Previous POV: Deep retracement had happened. From 25,419 retraced to 24250 (circa 3.23% , 812pts). Check the previous post.
For this week and upcoming; looking at shorter time frame for Long entry.
For intraday, swing trade - look out for entry for swing (using shorter tf to entry), you may use Fibo and other indicator whichever you feel comfortable and confident.
At point of writing ✍️: the HK50 $PEPPERSTONE 4H chart is undecisive.
For aggressive entry, you may take Long position and set SL.
Otherwise you may wait for confirmation (depends on your time frame of trade).
currently on D Chart -
🗝️ Resistance Level : 25060 (the recent Hi)
Support Level : 24,787
Support level 24,612 (EMA30)
🗝️ Strong Support Level : 24,283 (from 24048@30Jul25, Gravity Trend Line)
Macroview - Hong Kong Markets continue to be Bullish.
Higher Hi⛳ marked in D Chart HK50 $PEPPERSTONE
21May2025 -23909
11June2025 -24430
25June2025 -24531
16Jul2025 - 24842
24Jul2025 - 25729
?? ??2025 - 26713 Next Hi
Notice the trend, after the ⛳ , retraced back to Gravity Trend Line area, GMMA squeezing before it spreading out again for bullish trend.
Nothing complicated. Pay attention, set up your SOP. Take your position, setting stop loss and ride on the trend.
This applicable to Long and Short position.
The HSI Index
At point of writing ✍️ Index is being sucked towards to D GravityLine - 24344; it reversed to bullish on 5Aug25.
🗝️ Next Resistance Level : 25115
🗝️ Next Support Level : 24826
🗝️ Strong Support Level : 24700 (EMA30)
Let's follow your own zentradingstrategy , continue to trade;
When in doubt, sit. Not every candle needs a response.
— Sometimes, the wisest action is non-action.
Be ease at trading!
** Please Boost 🚀, FOLLOW ✅, SHARE 🙌 and COMMENT ✍ if you enjoy this idea!
Share your trading journey here to encourage the community and friends who pursing the same journey.
This is for educational and reference purposes only. It does not constitute financial advice or a recommendation to buy or sell any financial instrument. Always perform your own due diligence and consult a licensed financial advisor before making investment
Kdjindicator
Ultimate Winrate KDJ Strategy by reset parameter!(best tutorial)You've ever had this happen?
Bought a stock at rock bottom, and it starts to rise a bit, and then the J line turns down on the KDJ indicator, telling you to sell. So, you sell, but then it quickly shoots up, leaving you pretty blue. like you missed out on a fortune. Was the KDJ indicator down?
Nope
Hold tight, cause we're about to see a miracle. By just tweaking a bit the KDJ indicator's parameters, you can nail those short-term highs and be on your way to the success.
So, how do you find the right KDJ indicator parameters?
Stick around, and I'll spill the beans!
First off, why do we need to optimize this lil' parameter?
Well, every stock moves differently cause the folks trading it are different. So, a one-size-fits-all KDJ indicator won’t always work well on every stock at every stage. To up our chances, we gotta tweak those parameters to find the best fit for our stock.
Now, onto the second question: how do you find the right ones?
Let’s go back to the Tesla stock chart.
After changing the KDJ indicator parameters to 74, the sell point lines up perfectly with the peak.
Why 74?
Well, from point A to point B, there’s exactly 74 candles. Why use the number of candles between those two points as the KDJ parameter?
Here’s the crux of it.
The KDJ indicator is a momentum oscillator, calculating the close price at latest candle with the highest and lowest prices of the previous nine candles since the default KDJ parameter is 9.
so If the price breaks above the highest price of those nine candles, it will be constantly giving false sell signals.
So, we need to set the KDJ parameter to the number of candles from the previous high to the low. This way, the highest price and lowest price are not broken.
Then, the KDJ works accurately.
Still lost? Let’s look at another example. Here’s an Apple stock chart.
With the default parameter of 9, we bought after the golden cross, but few days later, it prompt to sell signal, and then the price soared. Feeling furious yet?
But if we set the KDJ parameter to 95, we’d have sold right near the top, securing a nice profit!
Why 95?
Same method: from the highest point A to the lowest point B, there’s 95 candles.
Got it? Ain’t it something?
Check your stocks with this method. Got questions? Leave a comment, and I’ll get back to ya ASAP! Today we focused on using KDJ to find sell points. It’s just as magical for buy points, which I’ll cover in future videos.
So, please follow me and hit that boost bell so you don’t miss out!

Double bottom and upwardsAs you can see from the chart, it formed a double bottom on the weekly support and is moving upwards. RSI shows bullish and the KDJ indicator is also showing upwards trend. Targets are marked on the chart. Not a financial advice. DYOR before trading.

ZILUSDT | Wave Projection|Downtrend Breakout Entry@Retest SMA50?Price action and chart pattern trading
> Elliott Wave downtrend channel breakout testing SMA50 key resistance
> High possibility breakout key resistance and retest SMA50
> Entry @ SMA50 retest - Target SMA200 + 30-35%
> Stoploss @ SMA20 -10 - 15% downside RRR: 2:1
Indicator:
> BBD continued uptrend positive banker fundflow above baseline
> KDJ stochastic strong uptrend ribbon
> Banker smart money volume support
Always trade with affordable risk and respect your stoploss

KCE | Inverted Head & Shoulders | Trend reversal patternPrice action and chart pattern trading setup
> Inverted head & shoulders trend reversal pattern
> Support Neckline 1st entry at breakout and 2nd entry at pullback
> 1st target at SMA50 as key resistance
> 2nd target at SMA200 or volume profile point of control
> Stoploss at near lowest inverted head position
> risk ratio : 2:1 is recommended for medium term trade
Indicators:
> strong smart money and banker chip volume support
> Fundflow rebounded for the first time coming out of oversold area
> BBD positive signal uptrend above baseline
> KDJ Sto positive ribbon uptrend
Always trade with affordable risk and respect your stoploss

BTCUSD | Sideway Uptrend Parallel Channel | Resistance SMA400Price Action and chart pattern trading setup
> Sideway uptrend PARALLEL CHANNEL with key resistance SMA400 and SMA200
Indicator:
> Smart Money Volume Spike at pivot point
> Banker Fundflow RSI strong uptrend above 50.
> BBD bullish signal crossing up baseline.
> KDJ STO bullish signal crossing up 30.
Always trade with affordable risk and respect your stoploss

thing best possition for shibusdtandicatori
stoch+rsi shown over sold in 1d timeframe
kdj break red square and this mean became in green square and buy in 1d timeframe
macd is in oversold possitin in 1d time frame
that means Tomorrow must have green candle if if if btc let
KUCOIN:SHIBUSDT


kdj indicator oversolded time to buyleft panel is 1 day timeframe with my customed kdj indicator 41-31, on right side si 1 week timeframe with original kdj 9-3.
Both we are oversold and waiting the next bullish momentum

Bears are losing momentum KDJ OVER SOLD 1D chartAfter Bullshit Elon Musk drop, the chart say: where are in OVER SOLD field on KDJ Indicator 1 day chart.
Next days i'm sure that will be a huge green candle spyke.
Probably will be some resistence at 53-54k$


next neek would be a new bullish rallyWait new comermation candle, but i'm sure that will be a new strong bullish rally

Possible Long Entry and Reversal of PullbackAs indicated by vertical line on indicator KDJ
the K or base stochastic is printing a higher low and
and is expanding from a point where the 3 lines have touched
I had a long position that closed in loss and now open long 110% the size of previous position
Remember the overall trend is bulish this is just a normal pullback for btc
set stop limit at 15900 for 50% position then limit buy at 14100 as it sounds to be a level most people are looking at as a fib level
I believe we are seeing some "weekend" effect as home traders are fans of shorting BTC , as USA prepares for thanksgiving
but corporations are not sleeping , they probably have a bit of limit buy orders in place and after thanksgiving the rocket goes up again
