LDO Market Update📈 MIL:LDO Market Update
MIL:LDO has broken out of the red resistance zone, which has now turned into support 🔴➡️🟢
Currently, price is showing signs of retracing.
The potential play:
🔹 If price pulls back to the green zone, this area could provide a potential long entry, since previous strong buyers accumulated there.
🔹 With confirmation, this level may trigger the next bullish push upward 🎯
⚠️ Always wait for confirmation before entering — patience equals profits.
LDO

#LDO/USDT | Flipped Longe Term Resistance#LDO
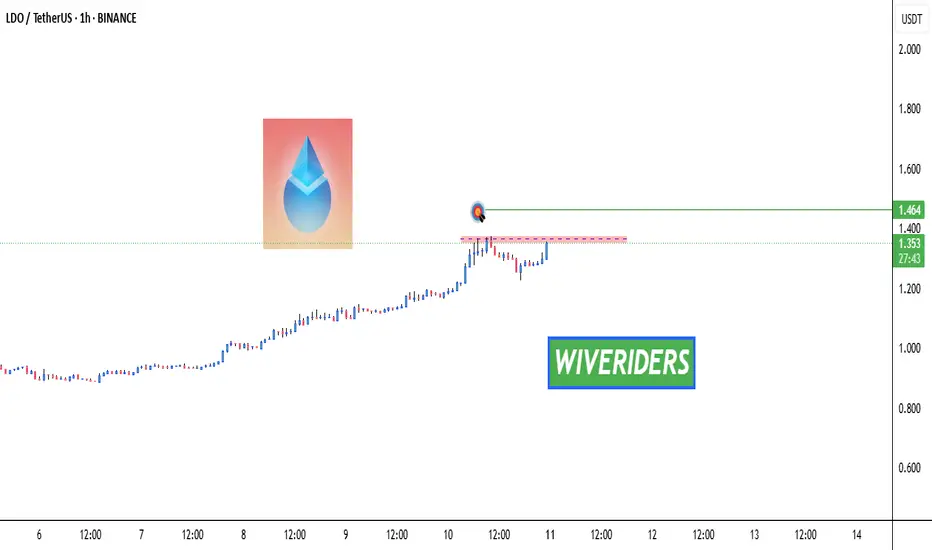
The price is moving within an ascending channel on the 1-hour frame, adhering well to it, and is on its way to breaking strongly upwards and retesting it.
We have support from the lower boundary of the ascending channel, at 1.31.
We have a downtrend on the RSI that is about to be broken and retested, supporting the upside.
There is a major support area in green at 1.28, which represents a strong basis for the upside.
Don't forget a simple thing: ease and capital.
When you reach the first target, save some money and then change your stop-loss order to an entry order.
For inquiries, please leave a comment.
We have a trend to hold above the 100 Moving Average.
Entry price: 1.42.
First target: 1.48.
Second target: 1.55.
Third target: 1.63.
Don't forget a simple thing: ease and capital.
When you reach your first target, save some money and then change your stop-loss order to an entry order.
For inquiries, please leave a comment.
Thank you.

LDO Coin | Swing Long IdeaLDO | Swing Long Idea
📊 Market Sentiment
Overall sentiment remains bullish, supported by expectations of a 0.25% rate cut in the upcoming FOMC meeting. A weakening USD and increased risk appetite across global markets continue to create favorable conditions for further upside in crypto assets.
LDO is closely correlated with Ethereum’s price action. As ETH approaches all-time highs, fueled by a $1B single-day ETF inflow, LDO is also showing strong upside potential.
Additionally, market rumors suggest that the SEC may approve Ethereum staking policy soon — a move that would directly increase the utility of LDO in the future. This adds strong conviction to a long bias.
📈 Technical Analysis
Price has gained strong momentum alongside Ethereum’s bullish run.
We are approaching a HTF bearish trendline that has capped price for a while.
A breakout and close above this level would be a significant bullish signal.
📌 Game Plan
Wait for a clean break and close above the HTF bearish trendline.
Look for long entries on a retest of the breakout level.
🎯 Setup Trigger
After retest, wait for a 4H break of structure to confirm bullish continuation.
📋 Trade Management
Stoploss: 4H swing low that caused the break of structure
Targets:
TP1: $1.95
TP2: $2.43
Trail stops to secure profits as price moves in favor.
💬 Like, follow, and comment if you find this setup valuable!

LDOUSDT Daily Chart Analysis | Strong Momentum BuildingLDOUSDT Daily Chart Analysis | Strong Momentum Building
🔍 Let’s dive into the LDO/USDT perpetual contract and analyze the latest price action, highlighting a powerful bullish setup and key technical signals on the daily chart.
⏳ Daily Overview
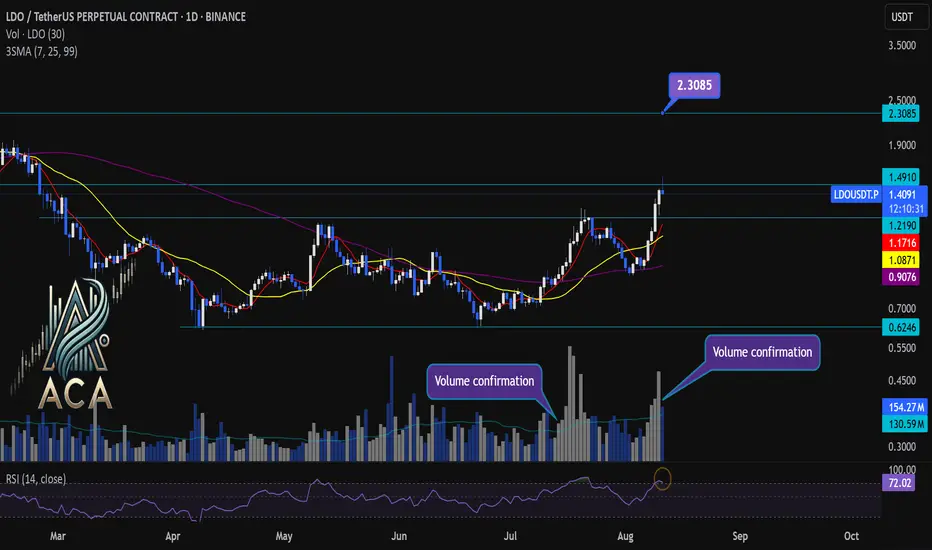
The daily chart reveals a strong surge in momentum as the price breaks out of its recent range, accompanied by a decisive uptick in trading volume. The 3SMA setup (short-term, mid-term, and long-term moving averages) is aligning bullishly, marking the beginning of a strong uptrend.
📊 Key Highlights:
- RSI (14) is entering the overbought zone (currently at 73.39), reflecting surging buyer demand and intensifying momentum.
- Price has broken out of the range box with elevated volume, confirming the move.
- Multiple volume confirmation spikes signal conviction behind the breakout.
- Immediate resistance is being challenged; the next key target to watch is $2.3085.
- For continued upside, we must see a daily candle close with solid volume above the current resistance level.
🚨 Conclusion:
Momentum is clearly accelerating on LDOUSDT, supported by volume and moving average bullish alignment. If price closes above resistance with strong volume, a continued rally toward the $2.3085 target is likely. Keep an eye on RSI levels and volume for further confirmations as this trend builds!
LDO Breakout Watch – Red Resistance Being Tested! 🚨 MIL:LDO Breakout Watch – Red Resistance Being Tested! 🔴⏳
MIL:LDO is testing the red resistance zone.
📊 If breakout confirms, next move could target:
🎯 First Target → Green line level
A breakout could trigger bullish continuation and upside momentum.
LDO/USDT — Testing the Downtrend Line: Breakout or Rejection?Summary
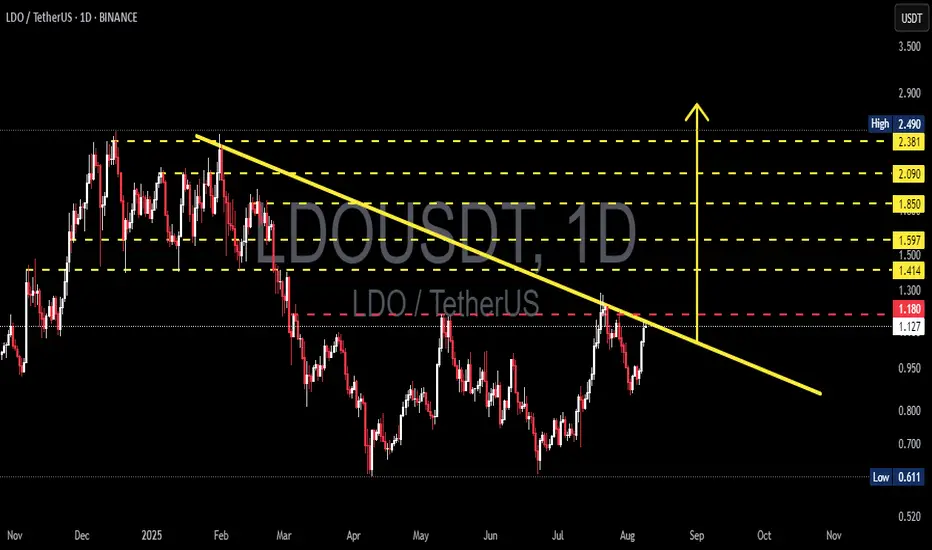
LDO price is currently testing the descending trendline (yellow) connecting this year’s major highs. This zone coincides with a key horizontal resistance around 1.18–1.30. Price action in this area will determine the next move — either a sustained breakout towards higher supply zones or a rejection leading to renewed bearish pressure.
---
Key Levels (from chart)
Immediate resistance / quick supply zone: ~1.18 (red line) — short-term key.
Descending trendline (yellow): dynamic resistance, currently intersecting near 1.18–1.30.
Staged resistance targets (yellow dashed lines): 1.414 → 1.50 → 1.597 → 1.85 → 2.09 → 2.38 → 2.49.
Main supports: 0.95–1.00 (intraday), and major swing low 0.611.
---
Pattern / Structure Analysis
Mid-term trend — bearish: a clear series of lower highs since the start of the year, marked by a descending supply line.
Current condition — accumulation pressure: after months of sideways consolidation, price is rallying into trendline resistance — often a decisive point leading to either breakout or rejection.
No clear classic reversal pattern (e.g., full inverse head & shoulders) — more of a trendline test after consolidation.
Volume and daily close confirmation are critical to avoid false breakouts.
---
Bullish Scenario (requirements for a valid bullish setup)
Bullish trigger (confirmation):
1. Daily close above trendline + above ~1.30 (body close, not just wick).
2. Rising volume during breakout, showing strong buying participation.
3. A successful retest of the trendline as support after breakout for safer entry.
Step targets after confirmation:
Target 1: 1.414 — partial profit zone.
Target 2: 1.50 – 1.597 — mid-term resistance.
Target 3: 1.85 – 2.09 — major supply zone; if momentum remains, extend to 2.38 – 2.49.
Risk management:
Initial stop-loss below retest area or under 0.95 (adjust to position size).
Consider trailing stops for strong momentum moves.
---
Bearish Scenario (rejection / continuation)
Bearish trigger (confirmation):
1. Rejection at trendline: long upper wick + daily close back under 1.18 without volume confirmation on buying.
2. Increasing sell volume during rejection and follow-through.
Downside targets:
Target 1: 0.95–1.00 (intraday support).
Target 2: 0.80 (mid-level support).
Target 3: if breakdown continues, retest major low at 0.611.
Short strategy on confirmation:
Enter after rejection candle with volume confirmation; stop-loss above wick high / slightly above trendline.
---
Key Signals to Watch Before Entry
1. Daily close — avoid acting solely on intraday wicks.
2. Volume — breakouts without strong volume are prone to failure.
3. Retest confirmation — ideal for safer entries after breakout.
4. Broader market context — BTC/DeFi sentiment can accelerate or reverse moves.
5. Orderflow / on-chain / Lido news — large unlocks or updates may trigger volatility.
---
Trading Plan Highlights
Position sizing: risk only 1–2% of capital per trade.
Measured stop-loss: under breakout retest or under 0.95 for longs; above rejection wick for shorts.
Take profits in stages at resistance zones; avoid aiming for one all-or-nothing target.
Prepare a contingency plan for false breakouts.
---
Final Note
LDO is at a decision point — whether to break the yellow trendline or get rejected will set the mid-term direction. Wait for confirmation (daily close + volume + retest) before committing capital, and maintain strict risk control.
---
Hashtags (for TradingView):
#LDOUSDT #LDO #Lido #Crypto #TechnicalAnalysis #Breakout #SwingTrade #RiskManagement
#LDO/USDT#LDO
The price is moving within a descending channel on the 1-hour frame, adhering well to it, and is on its way to breaking strongly upwards and retesting it.
We have support from the lower boundary of the descending channel, at 1.128.
We have a downtrend on the RSI indicator that is about to be broken and retested, supporting the upside.
There is a major support area in green at 1.10, which represents a strong basis for the upside.
Don't forget a simple thing: ease and capital.
When you reach the first target, save some money and then change your stop-loss order to an entry order.
For inquiries, please leave a comment.
We have a trend to hold above the 100 Moving Average.
Entry price: 1.139.
First target: 1.172.
Second target: 1.210.
Third target: 1.270.
Don't forget a simple thing: ease and capital.
When you reach your first target, save some money and then change your stop-loss order to an entry order.
For inquiries, please leave a comment.
Thank you.

TradeCityPro | LDO Breaks Out Amid Altseason Hype Shift👋 Welcome to TradeCity Pro!
In this analysis, I’m going to review the LDO coin for you. It’s one of the well-known DeFi projects in crypto with the highest TVL in this category, and the LDO coin ranks 82 on CoinMarketCap with a market cap of $1.08 billion.
📅 Daily timeframe
On the daily timeframe, LDO has been in a range box for several months and is now starting to break out of it.
💥 After being supported at the 0.683 bottom, a large amount of buying volume entered, and a sharp bullish move occurred from this bottom to the top of the box. The RSI has also entered the Overbuy zone.
🔔 The overextended level on the RSI oscillator is 79.66, which has even been broken during this leg. Right now, I think the probability of a correction is quite high.
🔍 Yesterday's candle made a deep penetration into the top of the box, and currently, the price is sitting above the box. Since RSI is in the overextended zone, a pullback or short-term rest is likely.
🚀 However, considering the current uptrend, I believe this bullish leg might be ending, and we could see a few corrective candles. But after the correction ends, a new bullish leg might begin, pushing the price toward the resistance levels at 1.480 and 2.382.
🛒 For a long position or a spot buy, we can enter during this new bullish leg once the top breaks and a confirmation of a new wave starting is in place.
📝 Final Thoughts
This analysis reflects our opinions and is not financial advice.
Share your thoughts in the comments, and don’t forget to share this analysis with your friends! ❤️

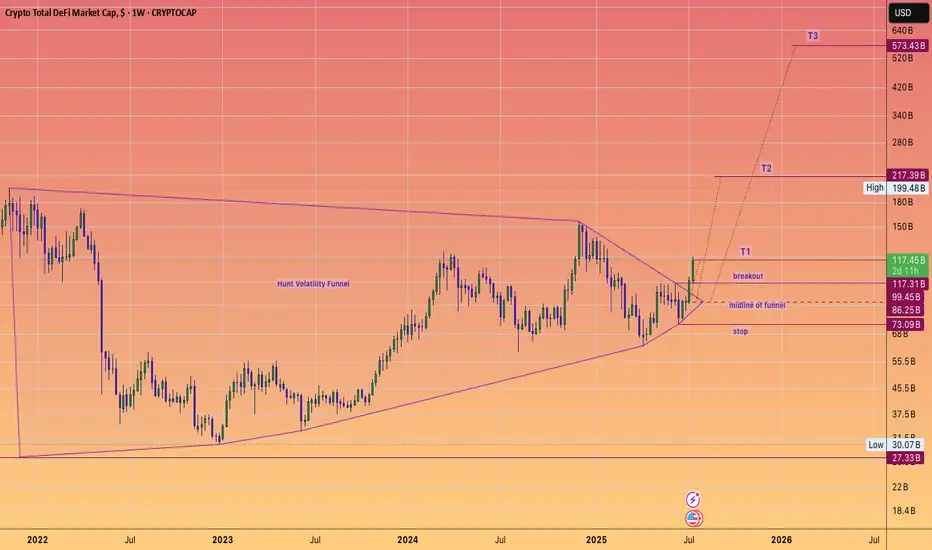
DeFi Moonshot! Moon mission to $573 Billion dollars!DEFI fuelled by Ethereum, built on proven protocols and stablecoin legislation is ready to keep cranking higher for the rest of the year. And instead of a Defi summer of emergence (2020), a multi season of adoption that takes it to half a trillion dollars, hitting these targets of a #HVF
@TheCryptoSniper
The components set to benefit are:
Uniswap #UNI ~ $12.3 Billion
Lido DAO #LDO ~ $9.1 Billion
Aave #AAVE ~ $7.5 Billion
MakerDAO #MKR ~ $4.6 Billion
GMX #GMX ~ $2.5 Billion
Curve #CRV ~ $1.9 Billion
Synthetix #SNX ~ $1.1 Billion
Pulsex #PLSX ~ $0.46 Billion
Key points:
The #TotalDefi index is currently at $117B aligning closely with the $123.6B of TVL
As we see hundreds of billions of dollars get digitized watch this index climb onwards and upwards... With $1 Trillion dollars and obvious milestone that is surely set to be met ... one day.
LDO/USDT Breakout Watch Ready to Fly After a Strategic Breakout?🔍 Full Technical Analysis
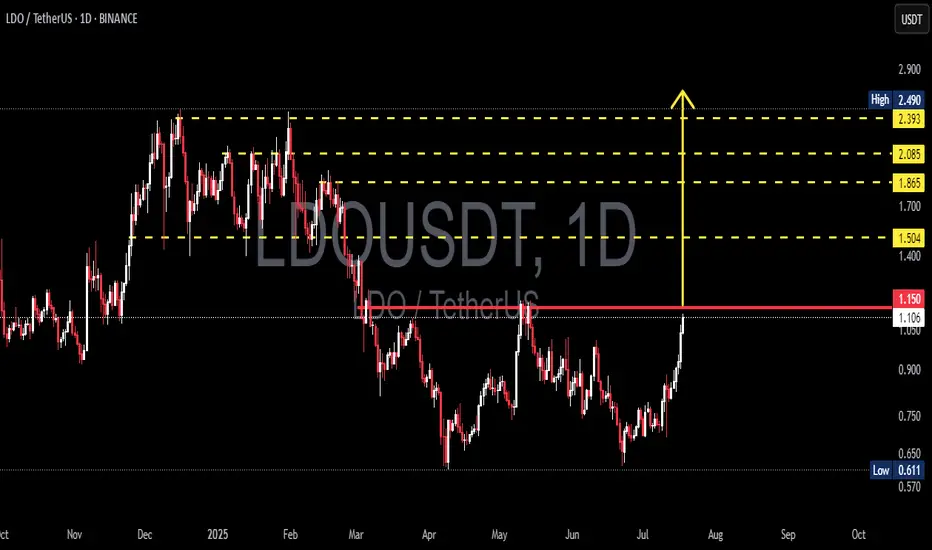
After months of downtrend and tight consolidation, LDO/USDT is showing clear signs of a bullish resurgence. The breakout above the key psychological resistance at $1.15 opens up a wide path toward higher resistance zones, potentially marking the beginning of a strong upward trend.
📐 Key Pattern Formed:
✅ Double Bottom Pattern
> Clearly visible from May to July 2025, with a neckline at $1.15. This is a classic bullish reversal pattern. The breakout above the neckline confirms the setup, projecting a significant upward move based on the measured height of the pattern.
✅ Horizontal Resistance Breakout
> The $1.15 level acted as a major resistance since April 2025. A clean breakout above it suggests that bulls are regaining control of the market momentum.
✅ Bullish Scenario (Primary Bias)
If the price successfully holds above the $1.15 zone and confirms it as support (successful retest), we may witness a bullish rally targeting the following levels:
🎯 Target 1: $1.504
— A minor resistance and previous consolidation area.
🎯 Target 2: $1.865
— A strong resistance level from earlier distribution zones.
🎯 Target 3: $2.085
— A technically significant level and key reaction point from past price action.
🎯 Target 4: $2.393 – $2.490
— A major supply zone and swing high from early 2025. This serves as the potential final target of the current bullish leg.
🟢 Volume increased during the breakout — a strong confirmation signal that this move is genuine, not a fakeout.
🟢 RSI likely gaining strength — though not shown on this chart, momentum indicators are likely supporting the move with a breakout from neutral levels.
❌ Bearish Scenario (If Breakout Fails)
If the price fails to hold above $1.15 and drops back below $1.05:
🔻 Potential Fakeout Risk
— A correction could send LDO back to:
Minor support at $0.90
Base support at $0.75
Major support at $0.611 (2025’s low)
📉 A breakdown below $0.611 would invalidate the bullish structure entirely, putting LDO back into a strong downtrend.
📊 Final Thoughts:
> LDO/USDT is at a critical decision point. A clean breakout from a strong medium-term structure opens the door for a significant bullish continuation. With pattern confirmation and strong volume support, this setup could mark the beginning of a mid-term uptrend.
The key lies in holding above $1.15 and watching for a healthy retest. This is a premium setup for swing traders and trend followers looking for early entries before a possible major move.
🧠 Trading Tips:
✅ Ideal Entry: On successful retest around $1.15 – $1.10
❌ Stop Loss: Below $1.00
📈 Targets: $1.50, $1.85, $2.08, and $2.49 (scaling out recommended)
#LDO #LDOUSDT #CryptoBreakout #AltcoinRally #TechnicalAnalysis #DoubleBottom #CryptoSignals #TradingViewIdeas #SwingTradeSetup #BullishPattern
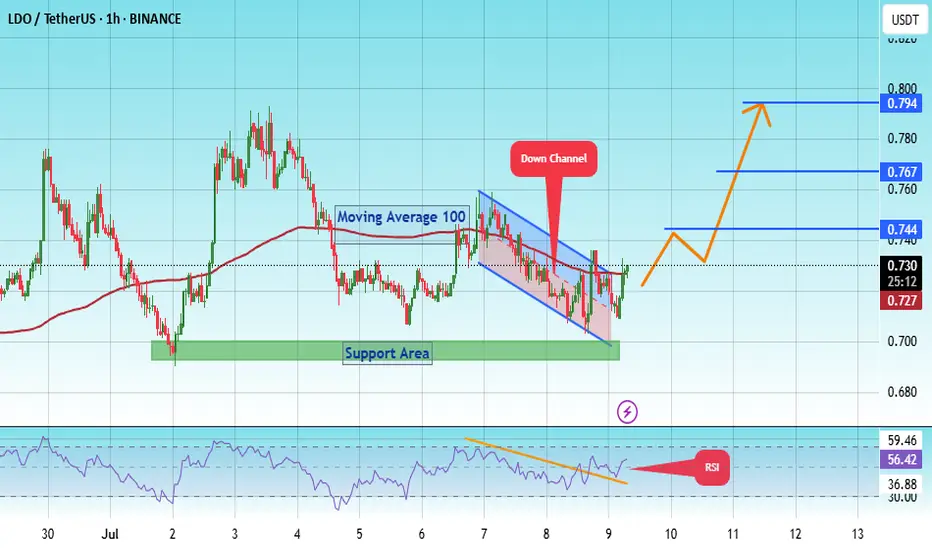
#LDO PUMP TO $ 0.794 ?#LDO
The price is moving within a descending channel on the 1-hour frame, adhering well to it, and is on its way to breaking it strongly upwards and retesting it.
We have a bounce from the lower boundary of the descending channel. This support is at 0.703.
We have a downtrend on the RSI indicator that is about to break and retest, supporting the upside.
There is a major support area in green at 0.695, which represents a strong basis for the upside.
Don't forget a simple thing: ease and capital.
When you reach the first target, save some money and then change your stop-loss order to an entry order.
For inquiries, please leave a comment.
We have a trend to hold above the 100 Moving Average.
Entry price: 0.730
First target: 0.744
Second target: 0.767
Third target: 0.794
Don't forget a simple thing: ease and capital.
When you reach the first target, save some money and then change your stop-loss order to an entry order.
For inquiries, please leave a comment.
Thank you.
#LDO/USDT#LDO
The price is moving within a descending channel on the 1-hour frame, adhering well to it, and is heading toward a strong breakout and retest.
We are experiencing a rebound from the lower boundary of the descending channel. This support is at 0.741.
We have a downtrend on the RSI indicator that is about to be broken and retested, supporting the upward trend.
We are in a trend of consolidation above the 100 moving average.
Entry price: 0.780
First target: 0.805
Second target: 0.837
Third target: 0.870

Lido DAO Awakens While Aiming At 900%+, EasyLido DAO has been sideways for three long years and is currently trading at bottom prices. The best possible ever for buyers, traders, long-term holders or simply all those looking to make good profits with Cryptocurrencies, the time is now.
Here we can see how price action matches perfectly the support zone that was tested in August-November 2024, Nov-December 2022 and June 2023. True bottom prices.
It is also easy to notice a huge increase in trading volume after mid-2024. This means that after this date LDOUSDT traders became active which tends to happen before strong market action.
Now, there has been some bearish action but also bullish, "long-term sideways consolidation," and this is coming to an end. The next move is a bullish move and signals the start of the 2025 bull market for this pair.
Some pairs are already growing while others are still moving lower. Since it will take 6-12 months for the full bull market to unravel, it is normal to see some down while others are up.
This project will be a big one. This pair will produce massive growth.
Here we have a great price and great entry timing.
I am wishing for you the best.
Thanks a lot for your continued support.
Namaste.

LDO - Next Impulse Starting Soon!Hello TradingView Family / Fellow Traders. This is Richard, also known as theSignalyst.
After breaking above the $0.8 major high, LDO has shifted from bearish to bullish from a long-term perspective. 📈
This week, it has been undergoing a correction phase within a falling channel marked in red. 🔻
For the bulls to take over and kick off the next impulsive wave toward the $1.5 mark, a breakout above the upper red trendline is needed. 🚀
📚 Always follow your trading plan regarding entry, risk management, and trade management.
Good luck!
All Strategies Are Good; If Managed Properly!
~Rich

LDO ROADMAPTo me the view is pretty clear.
* The purpose of my graphic drawings is purely educational.
* What i write here is not an investment advice. Please do your own research before investing in any asset.
* Never take my personal opinions as investment advice, you may lose your money.
LDO Is About To ExplodeHello, Skyrexians!
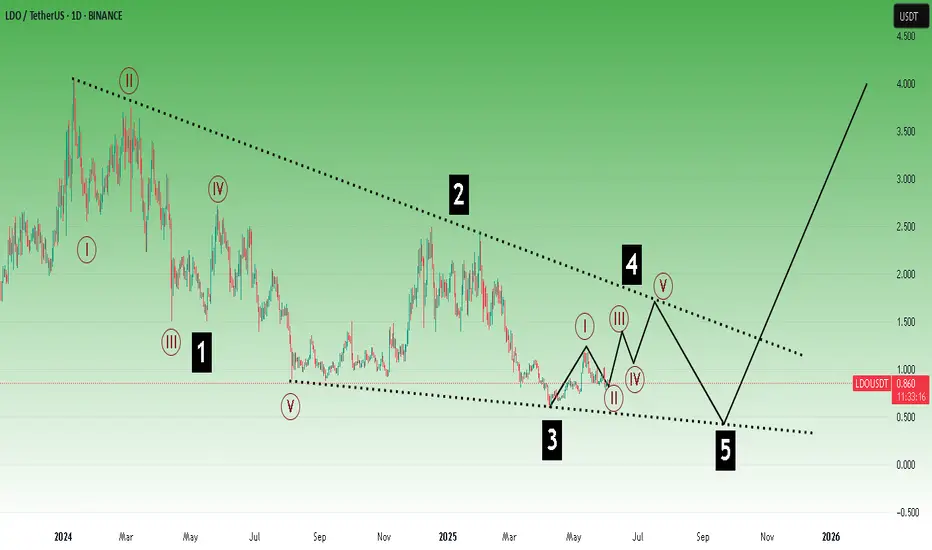
Today I make an update on BINANCE:LDOUSDT which I hold on spot with average price at $0.8. First of all I will clarify how this bullish forecast can match with my yesterday's analysis about altcoins drop. Easily! There was the 2D time frame - mid term analysis. This is weekly chart. I can allow that some drop is possible for Lido Dao or other alts but global picture will be the same.
On the chart some of you will see the accumulation. In fact this is very long wave 2 ABC shaped. It's not interesting to tell about waves A and B. The only one thing is important is that now wave C in 2 is finished with the divergence between waves 3 and 5. Next wave shall be insane and reach very high, above $6.
Best regards,
Ivan Skyrexio
___________________________________________________________
Please, boost this article and subscribe our page if you like analysis!

LDOUSDT 1D AnalysisLDO ~ 1D Analysis
#LDO Buy gradually after retesting this support block with a short term target of at least 10%+ from here.

LDOUSDT 4D Analysis LDO ~ 4D Analysis
#LDO Buy gradually from here if you still have confidence in this coin with a short term target of at least 20%++

#LDO/USDT#LDO
The price is moving within a descending channel on the 1-hour frame, adhering well to it, and is heading for a strong breakout and retest.
We are experiencing a rebound from the lower boundary of the descending channel, which is support at 0.988.
We are experiencing a downtrend on the RSI indicator, which is about to break and retest, supporting the upward trend.
We are looking for stability above the 100 Moving Average.
Entry price: 1.008
First target: 1.022
Second target: 1.042
Third target: 1.067

TradeCityPro | LDO: Watching for Breakout in DeFi Leader’s Range👋 Welcome to TradeCity Pro!
In this analysis, I’m going to review the LDO coin — one of the well-known DeFi projects within the Ethereum ecosystem with a significantly high TVL.
✔️ This project’s token currently has a market cap of $748 million, placing it at rank 86 on CoinMarketCap.
⏳ 4-Hour Timeframe
As you can see on the 4-hour chart, after a downtrend, LDO formed a bottom around the 0.676 zone and managed to rally up to 0.868.
🔍 Currently, the price is consolidating below that resistance in a ranging box. A breakout from either direction of the box could determine the next trend.
⭐ If the box breaks upward and the 0.868 level is breached, we can consider the prior downtrend over, and the price would be forming a new bullish structure. However, there is another resistance at 0.904 right above, and there’s a possibility of rejection from that level after the 0.868 breakout.
📈 For a long position, I personally plan to enter upon the breakout of 0.868. While it’s possible that the price might reverse from 0.904, I prefer having an earlier entry and using a more accessible trigger.
🔽 On the other hand, if the box breaks to the downside, the price might revisit the 0.676 support and potentially start a new bearish leg in line with the longer-term downtrend.
📉 The first short trigger is the break of 0.818 (the lower boundary of the box), but there’s another minor support at 0.795, which may cause a bounce.
👀 I personally prefer to wait for the 0.795 level to break for a short entry, given that market momentum is currently bullish, and I prefer a more reliable trigger for shorts.
📊 Volume within this range has been decreasing, which is normal in such consolidation phases. The longer the price stays in this range, the lower the volume tends to be — and typically, a breakout will lead to a sharper move.
The RSI oscillator also has a support zone at 43.17. If this level is broken, it could signal incoming bearish momentum and increase the probability of a downside breakout.
📝 Final Thoughts
This analysis reflects our opinions and is not financial advice.
Share your thoughts in the comments, and don’t forget to share this analysis with your friends! ❤️

LDOUSDT 1D AnalysisLDO ~ 1D Analysis
#LDO Buy after successfully penetrating this resistant line with a short -term target of at least 10%+ from here.

LDO Is The Best Asset NowHello, Skyrexians!
Some of you may be remember my article which I shared more than 1 year ago where called BINANCE:LDOUSDT the worst asset and it dumped exactly as predicted. Then made a mistake making assumption that some coins can grow while other will go down. This assumption has the very low probability to be truth, now I have the clear view that entire crypto will go up soon and LDO can be the greatest performer.
On the weekly chart we can see the huge 3 year accumulation. Current point can be the best to buy. We have bullish divergence on Awesome oscillator, green dot on Bullish/Bearish Reversal Bar Indicator . Moreover, current price action looks like a spring on Wyckoff cycle. The exact target impossible to predict, but I think it shall be above $12.
Best regards,
Ivan Skyrexio
___________________________________________________________
Please, boost this article and subscribe our page if you like analysis!

LDO is bearish for MidTerm (2D)Before anything, pay attention to the timeframe; it’s a 2-day timeframe and requires patience.
From the point where we placed the red arrow on the chart, it seems that the bullish LDO pattern, which was a triangle, has completed. LDO has now entered a bearish pattern of the same degree as the previous bullish pattern.
LDO is expected to remain bearish in the medium term and not break above the red box marked on the chart.
The low-risk area for buy positions in spot has been identified for buyers.
The closure of a daily candle above the invalidation level will invalidate this analysis
For risk management, please don't forget stop loss and capital management
Comment if you have any questions
Thank You
