LINK : You want the link for the pump?Hello friends🙌
✅considering the recent market decline, the LINK market has also fallen like other currencies, and many of you are afraid that this is the end and the rise is over or is there still a rise?
✅Well, as we have indicated on the chart, after the price fell to the support area marked with Fibonacci, a double bottom pattern was formed and then the price was increased by buyers.
✅In this wave, we drew another Fibonacci and identified the area where the price pulled back, and we believe this currency has good potential for growth.
✅Now you can buy in steps in the specified areas with capital and risk management and move to the specified targets.
🔥Follow us for more signals🔥
*Trade safely with us*
LINKBTC

#LINK/USDT targeting 17.77 $ ?#LINK
The price is moving within a descending channel on the 1-hour frame and is expected to break and continue upward.
We have a trend to stabilize above the 100 moving average once again.
We have a downtrend on the RSI indicator that supports the upward break.
We have a support area at the lower boundary of the channel at 15.60, acting as strong support from which the price can rebound.
We have a major support area in green that pushed the price higher at 15.30.
Entry price: 15.84
First target: 16.47
Second target: 17.00
Third target: 17.77
To manage risk, don't forget stop loss and capital management.
When you reach the first target, save some profits and then change the stop order to an entry order.
For inquiries, please comment.
Thank you.

LINK - The sleeping Giant ready to wake!Don't forget to add LINK to your watchlist — it's a solid project with long-term investment potential.
The weekly chart shows that LINK is currently retesting the downtrend line it recently broke — a textbook bullish retest.
The lower trendline now acts as a key support level, and as long as price holds above it, the structure remains healthy.
Currently trading around $17.6, the price hasn’t moved significantly yet —
You’ve got:
✅ A strong fundamental project
✅ A bullish technical setup
✅ Large market cap
✅ Still early entry
What more do you need to enter?
Accumulate now... and thank me later.
Best Regards:
Ceciliones🎯

LINK to 30$ or more?Hi Padawans,
Hope you’re doing well.
I’m anticipating some good short scalp opportunities around the levels marked in the chart.
Do your own research padawans.
Best regards,
Crypto Obi

LINKUSDT Forming Falling Wedge LINKUSDT is currently forming a classic falling wedge pattern, a bullish reversal setup that often signals the end of a downtrend and the beginning of a strong upward move. The recent price action within the wedge shows decreasing volatility and tightening price levels, suggesting accumulation is underway. This setup, combined with increasing volume, indicates that a breakout to the upside could be imminent.
Chainlink (LINK) continues to draw investor interest due to its critical role in the decentralized oracle network ecosystem, which bridges blockchain smart contracts with real-world data. The project has maintained relevance in both DeFi and traditional enterprise solutions, and its consistent development activity keeps it on the radar of long-term crypto investors and short-term traders alike. With current market sentiment shifting more favorably toward altcoins, LINK’s technical and fundamental setup makes it a top watch.
The expectation for a 60% to 70% gain is well-supported by previous price performance following similar wedge breakouts. Traders are advised to monitor for a strong volume breakout above resistance lines, as this would confirm the move and likely initiate a new upward trend. If broader market conditions remain positive, LINKUSDT could move swiftly toward higher levels, fueled by both technical momentum and renewed investor confidence.
✅ Show your support by hitting the like button and
✅ Leaving a comment below! (What is You opinion about this Coin)
Your feedback and engagement keep me inspired to share more insightful market analysis with you!

LINKUSDTThis is chart ready for pump but wait for break 14$. BINANCE:LINKUSDT
I in below say best supports and resistance's.
Support:
12.66
11.50
10.50
resistance's:
14
16.68
17.70
⚠️Contorl Risk management for trades.

LINKUSD Paths on OfferPretty clear accumulation stages going on and so I am inclined to think we head towards the Bullish path to ~$100
Bears will want to buy LINK at massive discounts and so perhaps we do see some capitulation before our next mark-up phase.
However, the current Total Market cycle patterns, along with the BTC pairing, almost rule out the possibility of further downside, or at least major downside.
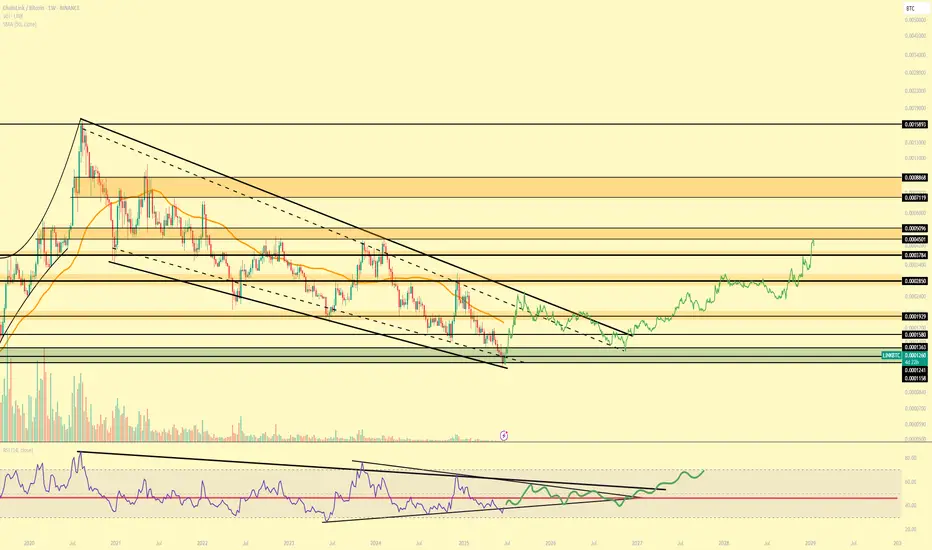
LINK / BTC Looking Juicer Than EverEven if you aren't aware of the fundamentals of LINK adoption & application , the chart speaks for itself.
Would be very surprised is LINK isn't bottoming out here and all it needs is a bit of sideways before we get some expansion and mark-up.
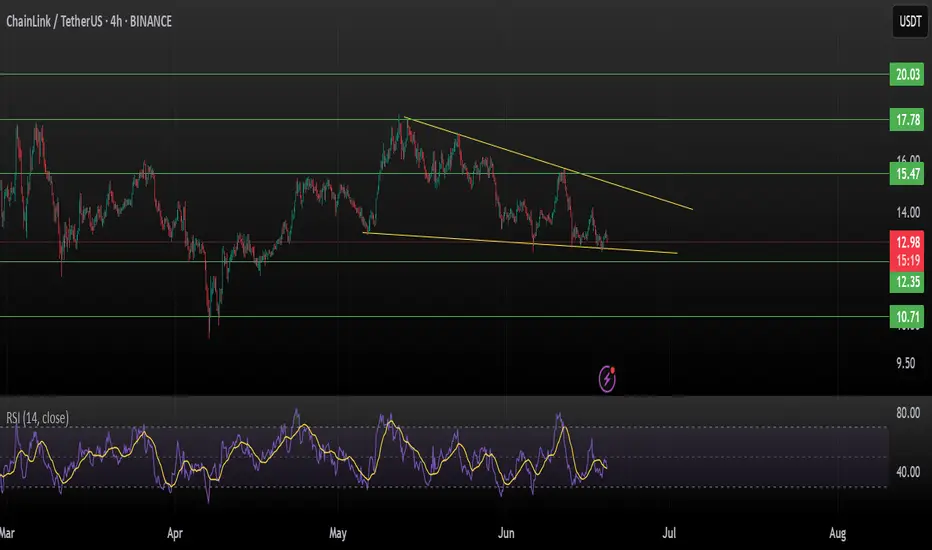
Chainlink (LINKUSDT) | Falling Wedge at Critical SupportChainlink is trading within a well-defined falling wedge pattern on the 4H chart, a typically bullish reversal setup. Price action indicates the coin is hovering just above key horizontal support around $12.35, making this a critical zone to watch.
Technical Breakdown:
Pattern: Falling Wedge (Bullish Bias)
Current Price: $12.98
Immediate Support: $12.35
Major Support: $10.71
Resistance 1: $13.80 (wedge upper trendline)
Breakout Targets:
$17.78 (major resistance)
$20.03 (macro level supply zone)
Indicators:
RSI (14) at ~42 → Weak but stabilizing, potential for reversal
Volume has been compressing — watch for a breakout with rising volume for confirmation
Strategy:
A 4H close above the wedge trendline with volume could trigger a breakout rally toward $17.78 or even $20.03.
Failure to hold $12.35 could send LINK back toward $10.71 support, caution below this level.
Setup Summary:
Long entry on breakout above $13.50 (trendline)
Stop-loss: Below $12.35
Target 1: $17.78
Target 2: $20.03
Risk: Reward Ratio: ~1:3+
Not financial advice. DYOR before entering trades.
If this analysis helps, like & comment your view.
#LINK/USDT#LINK
The price is moving within a descending channel on the 1-hour frame, adhering well to it, and is heading for a strong breakout and retest.
We are experiencing a rebound from the lower boundary of the descending channel, which is support at 14.50.
We are experiencing a downtrend on the RSI indicator that is about to be broken and retested, supporting the upward trend.
We are looking for stability above the 100 Moving Average.
Entry price: 15.80
First target: 16.45
Second target: 16.90
Third target: 17.56

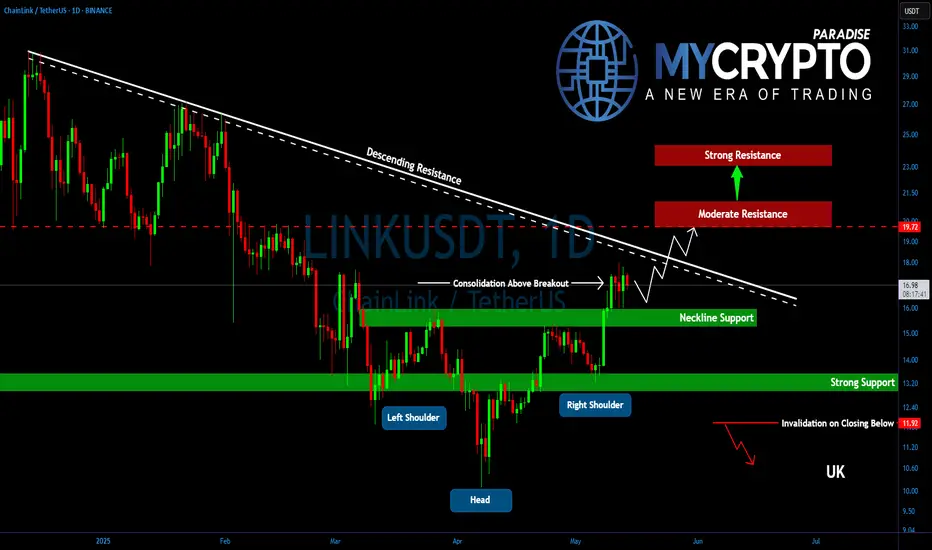
Is LINK Preparing for a Parabolic Rally? Key Levels to WatchYello, Paradisers! After completing its ABC correction, #LINK slipped into a sideways phase — but something significant is brewing beneath the surface. The recent formation of an inverse head and shoulders might be signaling the start of something much bigger.
💎LINK has now confirmed a breakout above the key neckline at $16.00, a critical level that had been capping price action. Following this breakout, the price is holding its ground well and entering a post-breakout consolidation that often acts as the launchpad for the next explosive leg.
💎#LINKUSDT now faces a decisive resistance at $18.50, a trendline rejection point that has held strong since December 2024. A clean break above this level could ignite strong bullish momentum. If bulls succeed, we could see LINK pushing quickly toward the $19.70–$20.30 range, a moderate resistance area, where partial profit-taking is likely from experienced hands.
💎Should momentum persist, the next major upside lies between $23.25–$24.00, the measured target of the inverse head and shoulders breakout. This zone is not just technically significant due to the pattern, it also aligns with the 61.8% Fibonacci retracement, making it a high-confluence resistance.
💎On the downside, LINK has strong support between $16.00–$15.50. This is not only the breakout neckline but also closely aligned with the 50 EMA and 200 EMA, reinforcing this range as a robust demand zone.
Paradisers, strive for consistency, not quick profits. Treat the market as a businessman, not as a gambler.
MyCryptoParadise
iFeel the success🌴
#LINK/USDT#LINK
The price is moving within a descending channel on the 1-hour frame, adhering well to it, and is heading towards a strong breakout and retest.
We are seeing a bounce from the lower boundary of the descending channel, which is support at 14.30.
We have a downtrend on the RSI indicator that is about to be broken and retested, supporting the upward trend.
We are looking for stability above the 100 moving average.
Entry price: 15.00
First target: 15.30
Second target: 15.61
Third target: 15.94

Taking a look at LINK.This chart looks very interesting and contains many little tidbits of information about potential future outcomes. I see good things coming for LINK in the future.
Good luck, and always use a stop-loss!

#LINK/USDT
#LINK
The price is moving within a descending channel on the 1-hour frame, adhering well to it, and is heading for a strong breakout and retest.
We are seeing a bounce from the lower boundary of the descending channel, which is support at 12.84.
We have a downtrend on the RSI indicator that is about to break and retest, supporting the upward trend.
We are looking for stability above the 100 Moving Average.
Entry price: 13.33
First target: 13.58
Second target: 13.83
Third target: 14.20

Chainlink vs Bitcoin: Trading Disaster Or Buy Opportunity?Spoiler alert! It is a buy opportunity.
Good evening my fellow Cryptocurrency trader, how are you feeling in this wonderful day?
I know what you are wondering. You are wondering...
This is an amazing opportunity that I am showing to you in the form of a chart. It is a chart but the chart is not the opportunity.
It is a trade but the opportunity is not in the candles or the information I am about to share, the opportunity is all about you and how you choose to behave.
The opportunity is only real if you decide to take action.
I'll just translate the chart and I'll let you figure out the rest.
An all time favorite, Chainlink here is paired against Bitcoin rather than the US Dollar, so LINKBTC is the trading pair.
The chart here is a long-term one and is saying two things mainly that are of interest to you and this opportunity that you are about to take:
1) There is no more bearish action. The bottom is in.
2) There is strong potential for growth. The market will grow.
These are the main points that are compelling me, attracting me and telling me to please tell you to buy up this coin. Only if you are into Crypto and looking at Crypto to make money, to collect profits and while you grow, become rich and have some fun.
Chainlink is about to grow. This is true of LINKBTC as it is true for LINKUSDT.
This chart is now at the bottom and it cannot go any lower. Bottom prices won't last long.
Where are you?
Look at the chart and take action —buy and hold.
Thanks a lot for your continued support.
Namaste.

SECRET Indicator Says LINK Will Moon🚨MartyBoots here , I have been trading for 17 years and sharing my thoughts on BINANCE:LINKUSDT here.🚨
.
🚨 BINANCE:LINKUSDT is looking beautiful , very interesting chart for more upside
and is now into support🚨
Do not miss out on BINANCE:LINKUSDT as this is a great opportunity
The SECRET Indicator says it will moon
Watch video for more details

Chainlink $LINK to 17$?⚠️ RISK TRADE ⚠️
👑 #LINK/USDT BUY 👑
Entry price:
13.76 - 14.17 🟩
Targets:
1️⃣14.62🎯
2️⃣15.24🎯
3️⃣16.04🎯
4️⃣17.05🎯

LINKLINK
March 26, 2025
8:02 AM
CRYPTOCAP:LINK just had a clean bounce off the +W OB (not a full-on impulsive move, but definitely a solid reaction)
Also, the MA100 and MA200 are forming a golden cross on both weekly and 4H TF — pretty bullish signal overall.
Looks like we’re setting up for W3. Right now, we’re in W2 and potentially about to enter W3 of W3, which is usually the strongest leg.

CHAINLINK 200 DOLLARS BY SEPTEMBER 2025 Only up for Chainlink from this moment , do not let them shake you out , my time fib will show the way as always , for Link its showing August which is when the fractal finishes , late August .
Chainlink so far is repeating the same fractal as last cycle , its very close been using it for over one year to time the market with amazing results the fractal cycle top pattern comes in in August 2025.
The sell zone is in the yellow box , invalidation of this idea would be LINK closing a weekly under 20 dollars.

LINK jump soonDouble bottom in LINK week chart. Last bottom is a higher low. Target is unpredictable but would say 5 to 10x btc is possible if we really enter an alt season stage.
Tomorrow might be a big day for crypto.

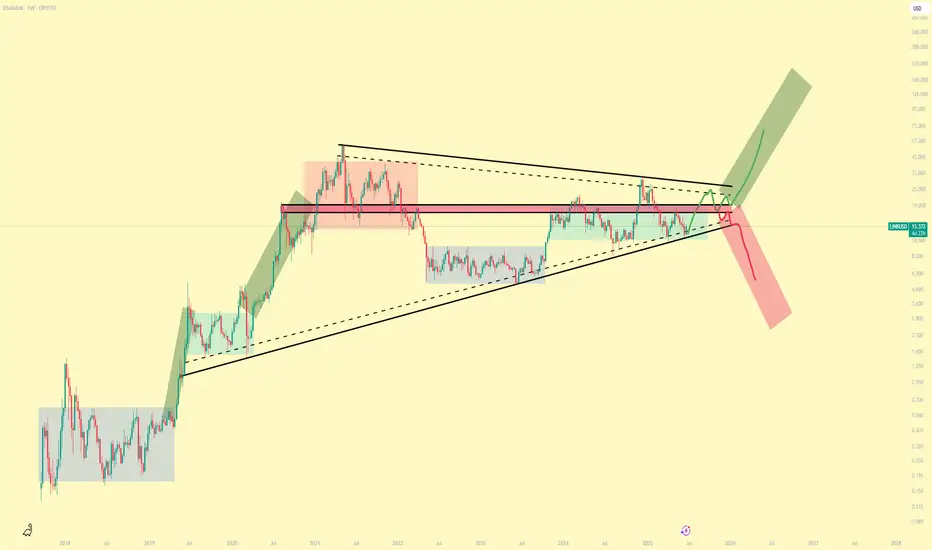
LINK Mid TermChainlink (LINK/USDT) Summary Analysis
• Support Zone: $16.00 - $12.64 USDT (strong demand area).
• Resistance Levels: $24.12 USDT (first target) and $35.40 USDT (main target).
• Channel Structure: Price is near the lower band of a descending parallel channel, indicating a potential reversal signal.
Scenarios:
✅ Bullish Scenario: If LINK bounces from $16.00 USDT, targets are $24.12 USDT and $35.40 USDT.
❌ Bearish Scenario: A close below $16.00 USDT could trigger a drop to $12.64 USDT.
Strategy:
🔹 Entry: Buy within the $16.00 - $18.00 USDT range, with a stop loss below $12.64 USDT.
🔹 Breakout: A breakout above $24.12 USDT presents a buying opportunity.
🔹 Sell: A close below $16.00 USDT may accelerate the downtrend.
If the channel breaks out, LINK has significant upside potential. 🚀

LINK buy/long setup (4H TF)After forming a low, the price is ranging and creating higher Ls. A trigger line has formed, and it is expected to be broken soon.
Targets are marked on the image.
A daily candle closing below the invalidation level will invalidate this analysis.
Do not enter the position without capital management and stop setting
Comment if you have any questions
thank you

#LINK/USDT#LINK
The price is moving in a descending channel on the 1-hour frame and is expected to continue upwards
We have a trend to stabilize above the moving average 100 again
We have a descending trend on the RSI indicator that supports the rise by breaking it upwards
We have a support area at the lower limit of the channel at a price of 20.00
Entry price 20.64
First target 21.70
Second target 23.46
Third target 25.20
