LINK / BITCOIN: 0.001+LINK / BITCOIN
This pattern confirms as a valid one when the price closes above the resistance line.
LINKBTC

LINK monthly bullflag, Its just getting started!LINK idea
possible breakout occurring now
I own a lot of this coin and think it has great prospects


Comparison - HBAR / USD vs LINK / USD in their first yearHBAR / USD is presently outperforming LINK / USD at this point in its life cycle.
See other related ideas linked below, including a comparison to LINK pre-2020 bull run vs. HBAR now, and remarkable comparisons to Litecoin's 2017 bull run.

Comparison - 1st Year of HBAR / BTC vs. 1st Year of LINK / BTCShowing similarities between the two assets in their first full year of price development - HBAR / BTC vs LINK / BTC.
The two charts can be lined up to look more similar, this comparison is one to one on timing of price over the first full year:
- LINK / BTC launched September 19th, 2017, and from there showing price development over its first full year 2018-2019
- HBAR / BTC launched September 16th, 2019, and from there showing price development over its first full year 2020-Present Day
Additional comparisons of LINK and HBAR and LTC and HBAR - USD pairs:
2019-2020 LINK / USD - 2nd year bull run vs. HBAR / USD 2020-Present
2016-2017 LTC / USD Bull Run vs. HBAR /USD 2020-Present
(older chart comparison linked below under related ideas)

The bet is still LINK over ETH and BTCAs my brother said it, Link is a honeybadger right now that don't give a rip about fud, about other coins, about bear raids. Chainlink is just going to wreck everything and so you might be worried about being late to the party. I don't think you could be late because this still has decades of gains to put up.
As is continues to emasculate all other coins we (mostly you) still need to make sure we are not getting blown out when this thing retraces or consolidates with poorly timed or sized margined longs as you FOMO in over perceived missed gains. The main chart is what I am going to refer to in future as the Chainlink Pattern. Not that it isn't seen in a lot of assets but because it has been very useful here. It is basically like looking at a Bump and run bottom reversal but from a different angle. If you want to look at Bump and Run formations from the standard angle, look here: thepatternsite.com
The chart explains itself mostly and the ideas are just applying fundamental charting to a specific pattern. There is a sharply rising trendline that is basically a ramp that price action gets a springing start to BASE jump. My linked (heh) ideas will show how I used the bollinger bands to find the bottom here and chose link over other top coins for my hodl and my margin trades.
The main chart is on linketh, but we also see this fractal has begun to form on Linkbtc. I expect this will work much the same way as it has on ETH.
My personal plan is to hold link and keep my link margin positions open as long as I can. I will be adding to my positions on any pull backs.
This chart is a rough mock up but with something has historically bullish as link against btc and eth it has been historically a great idea to buy dips and hold. Most people have no business timing the market but Bollingerbands do help. The chart below shows link on the daily and linkbtc and linketh on the weekly. During links downtrend a lot of damage to price actoin occurs when price action of linketh and linkbtc is against the bollinger band lower limit is great time to buy or pivot holdings into chainlink. Sometimes the baseline of the bollinger bands against btc and eth provide support. There should be little to no denying that link continues to trend up.
I would like to make some dramatic announcement that soon link will never return to these levels against BTC and ETH but we might have to reconsolidate and test this zone as support sometime in future. Hopefully we will retest the top of the zone as support and not some double bottom, but the market gives us as the market gives us.

LINK DropChainlink looks like it will trend down to the $8 mark .its hugely overpriced in my opinion and is only pumping on hype.
My order is placed and waiting .would be a lovely load up

LINK/ WAIT TO SELL AROUND 32-35 USDT WHEN FINAL WAVE 5 COMPLETEDWhen zoom out weekly chart here is what I ve seen.


Resistance at 66-70keks, consolidation neededTA:
As we can see, there is a daily resistance supply zone from 64keks to 70keks, with the 20day ma also acting as resistance which gives confluence. As such chadlink has to consolidate for awhile, before it can swiftly reclaim the 20day ma to break resistance of the supply zone at 64keks to flip it into a support zone. Doing so will reclaim the parabolic trend line and will ensure that we see 180keks at least for a new linkbtc ath.
Fundamentals wise:
Staking is expected to launch Q1 of 2021, and whales are accumulating which decreases supply in exchanges. Decreased supply I exchanges will make it easier for pumps.
What to do:
HODL


LINK - S/R Flip ideaSimple and clear idea: look for a S/R flip in the marked area. In this case bull trend will continue.
Information is just for educational purposes, never financial advice. Always do your own research.
Hit the "LIKE" button and follow to support, thanks!

BUYING THE DIPCurrently a buyer at the red box, price structure looks bullish af, imo this will be one of the last pullback before entering price discovery area. Those are my main objectives based as always in mister Fibonnacci, 32$, followed by 52$. Break and consolidation above 52$, and next objective is around 80$.

ChainLink (LINK) Moving Higher (160%+ Mapped)ChainLink (LINKBTC) is looking more than ready to grow strong.
We just looked at the ATOMBTC chart and this one is very similar...
First, we have the broken downtrend (you could also draw a descending channel here).
Second, we have prices moving above EMA10, EMA21, and EMA50... In this case, LINKBTC is also above EMA100 signaling additional strength.
With the MACD on the bullish zone and the RSI ultra-strong (above 60), it is clear that ChainLink is ready for sustained growth.
Thanks a lot for your support.
Namaste.

LINKBTC | Long Position on Support LineIt's clear LINKBTC is currently at an important support zone.
Risk/Reward is high and therefore I'm taking this long position.
Another option is to trade the weekly chart and place a stop-loss at 59500-ish sats. I'm however aiming for the short-term bounce here.


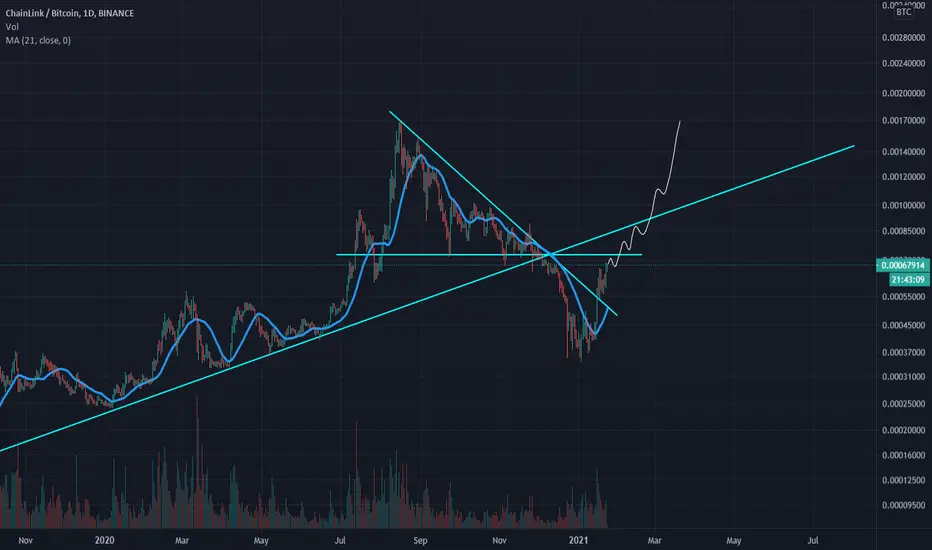

LINK/BTC looking like a beautyJust as predicted on my last post, link/btc is getting ready for a big rally. It held the resistence of around 0.00055 perfect. Im seeing a minimum target of 0.0014 link/btc over the next few weeks. Strong hold rn, dont get shaken out to sell cheap link to whales and smart money. Chainlink grayscale trust coming! If you like this content like this idea and follow me for frequent technical analysis. Its comeback szn fellow apes.

Link breakNice exit on the daily cloud. If we finish today strong, could be the start of a good run. Weekly and monthly look like a reversal also.

Link breakoutHorizontal red line is the top of the daily close. If we can stay above, we could see some bullish movement from link.

Chainlink Trend Continuation Patterns Chainlink has enjoyed a stable uptrend since the beginning of this year and there is room for more growth. In the LINKUSDT pair below, you notice how the double bottom patterns signify a bullish move.
In the past 24 hours, $LINK had a nice correction and rests a little above the 50 EMA, you can also see that it is resting on the 0.382 fib line. I reckon this is a strong support system for the continuation of the bullish link this week.
Invest wisely.
