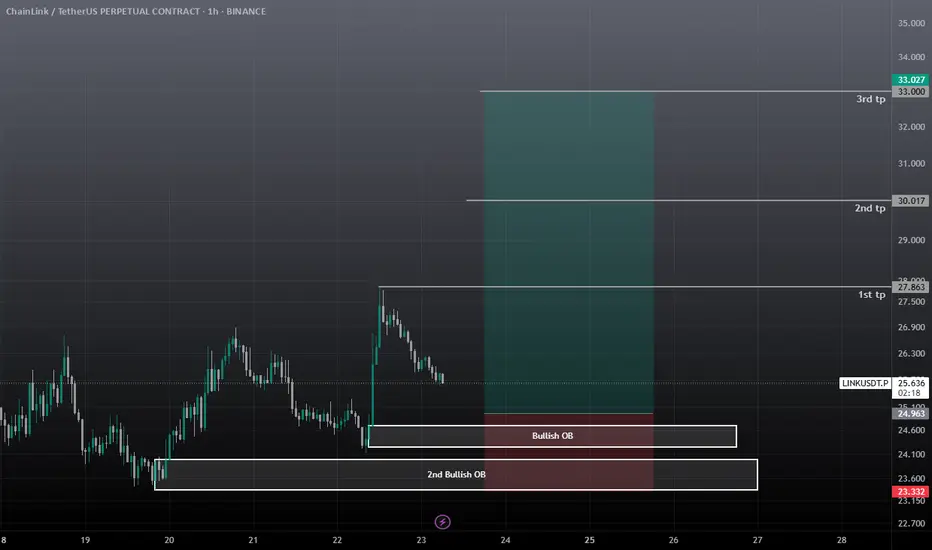
Link Long / Buy SetupLink has two Bullish OB, if first failed, 2nd OB will push the price, ETH bulish, link is also Bullish then. Use low risk as the pump was from an event so it can be a fakeout.
Linklong
#LINK/USDT in upward mood !#LINK
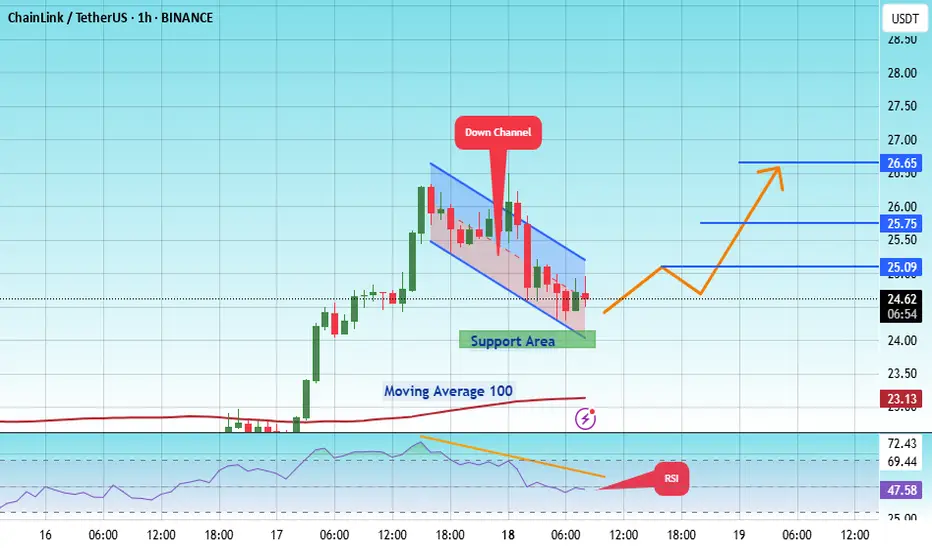
The price is moving within an ascending channel on the 1-hour frame, adhering well to it, and is on track to break it strongly upwards and retest it.
We have support from the lower boundary of the ascending channel, at 24.20.
We have a downtrend on the RSI indicator that is about to break and retest, supporting the upside.
There is a major support area in green at 24.00, which represents a strong basis for the upside.
Don't forget a simple thing: ease and capital.
When you reach the first target, save some money and then change your stop-loss order to an entry order.
For inquiries, please leave a comment.
We have a trend to hold above the 100 Moving Average.
Entry price: 24.60.
First target: 25.09.
Second target: 25.75.
Third target: 26.65.
Don't forget a simple thing: ease and capital.
When you reach your first target, save some money and then change your stop-loss order to an entry order.
For inquiries, please leave a comment.
Thank you.
LINKUSDTThis chart is in a bullish trend, but it broke a new high at $22.7. If BINANCE:LINKUSDT can keep the price above $20, we can expect it to reach a higher high.
Please control risk management.⚠️

LINK Macro signs pointing towards a buyHi,
This is a Macro analysis on the 1 Month timeframe for LINKUSD pair.
I've been looking for opportunities to trade in altcoin market. With BTC in price discovery mode and other signs appearing like altcoin only market cap charts point towards liquidity coming in, it is important now than ever to be spending time to scope out opportunities here.
I do think that not all altcoins will behave the same, im trying to use TA to find those with strong technicals.
LINKUSD sticks out due to several factors.
1. We are in an ascending channel, that i believe currently price action will eventually attempt to reach the upper trend line. (We could be at the very moment be attempting this.)
2. Momentum indicators are flashing bullish, though note that there is still a long way to go for the current monthly candle to close.
Both MACD and STOCH RSI are flashing buys in my opinion.
If our August Candle closes with:
MACD flashing histogram bar as deep green with bullish cross and
STOCH RSI flashing bullish cross and cross occurs above the 20 line.
This would indicate a potential for Macro Bullish move to the upside. ANd i believe that move to be at the very least to the previous highs, if not to new all time highs.
For the 1Month to stay bullish, we need to look for more bullish evidence such as in lower timeframes like the 1 week or 3 day to support 1 Month changes. And Bulls need to maintain dominance in those timeframes for 1 Month to print bullish.
Stay tuned for more updates.

#LINK/USDT targeting 17.77 $ ?#LINK
The price is moving within a descending channel on the 1-hour frame and is expected to break and continue upward.
We have a trend to stabilize above the 100 moving average once again.
We have a downtrend on the RSI indicator that supports the upward break.
We have a support area at the lower boundary of the channel at 15.60, acting as strong support from which the price can rebound.
We have a major support area in green that pushed the price higher at 15.30.
Entry price: 15.84
First target: 16.47
Second target: 17.00
Third target: 17.77
To manage risk, don't forget stop loss and capital management.
When you reach the first target, save some profits and then change the stop order to an entry order.
For inquiries, please comment.
Thank you.

LINKUSD – Bullish Impulse Toward D-Point Target
LINKUSDT:
Title: LINKUSD – Bullish Impulse Toward D-Point Target
Price action has completed a corrective ABC structure, finding strong support at point C. The current breakout above mid-structure resistance confirms bullish momentum, aiming toward the D-point completion. Risk is managed below the breakout zone, with potential for trend continuation if price sustains above local support.
Risk Management Notes:
– Entry aligned with breakout confirmation
– Stop-loss below structural support (C-area)
– Take-profit near projected D-point completion

LINK - The sleeping Giant ready to wake!Don't forget to add LINK to your watchlist — it's a solid project with long-term investment potential.
The weekly chart shows that LINK is currently retesting the downtrend line it recently broke — a textbook bullish retest.
The lower trendline now acts as a key support level, and as long as price holds above it, the structure remains healthy.
Currently trading around $17.6, the price hasn’t moved significantly yet —
You’ve got:
✅ A strong fundamental project
✅ A bullish technical setup
✅ Large market cap
✅ Still early entry
What more do you need to enter?
Accumulate now... and thank me later.
Best Regards:
Ceciliones🎯

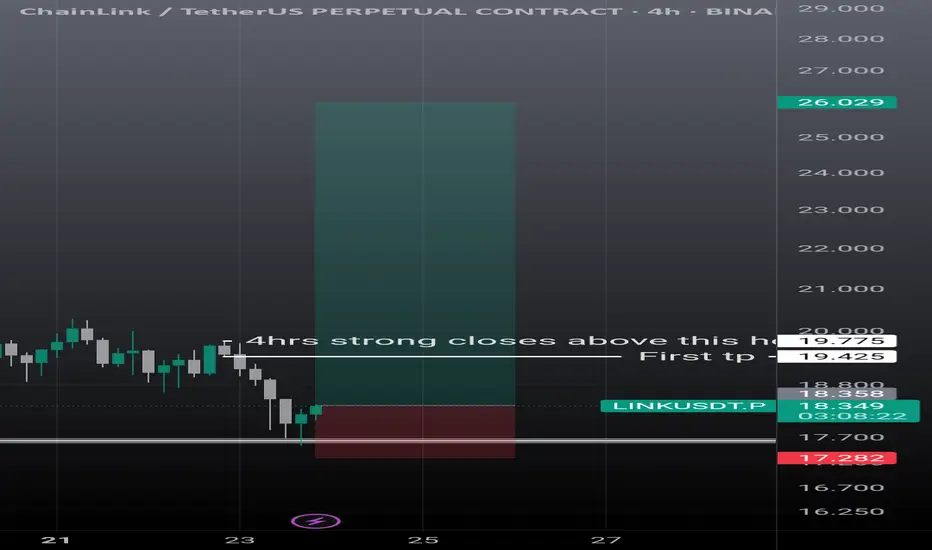
Linkusdt scalp n swing setupLink showing some strong momentum. On 4hrs it can go easily 19.30, then if it breaks strong and closes above the mentioned candle it's next stop is 26$. Must use sl as it can take further correction is it failed to break the mentioned level.
LINKUSDT Forming Falling Wedge LINKUSDT is currently forming a classic falling wedge pattern, a bullish reversal setup that often signals the end of a downtrend and the beginning of a strong upward move. The recent price action within the wedge shows decreasing volatility and tightening price levels, suggesting accumulation is underway. This setup, combined with increasing volume, indicates that a breakout to the upside could be imminent.
Chainlink (LINK) continues to draw investor interest due to its critical role in the decentralized oracle network ecosystem, which bridges blockchain smart contracts with real-world data. The project has maintained relevance in both DeFi and traditional enterprise solutions, and its consistent development activity keeps it on the radar of long-term crypto investors and short-term traders alike. With current market sentiment shifting more favorably toward altcoins, LINK’s technical and fundamental setup makes it a top watch.
The expectation for a 60% to 70% gain is well-supported by previous price performance following similar wedge breakouts. Traders are advised to monitor for a strong volume breakout above resistance lines, as this would confirm the move and likely initiate a new upward trend. If broader market conditions remain positive, LINKUSDT could move swiftly toward higher levels, fueled by both technical momentum and renewed investor confidence.
✅ Show your support by hitting the like button and
✅ Leaving a comment below! (What is You opinion about this Coin)
Your feedback and engagement keep me inspired to share more insightful market analysis with you!

LINKUSDTThis is chart ready for pump but wait for break 14$. BINANCE:LINKUSDT
I in below say best supports and resistance's.
Support:
12.66
11.50
10.50
resistance's:
14
16.68
17.70
⚠️Contorl Risk management for trades.

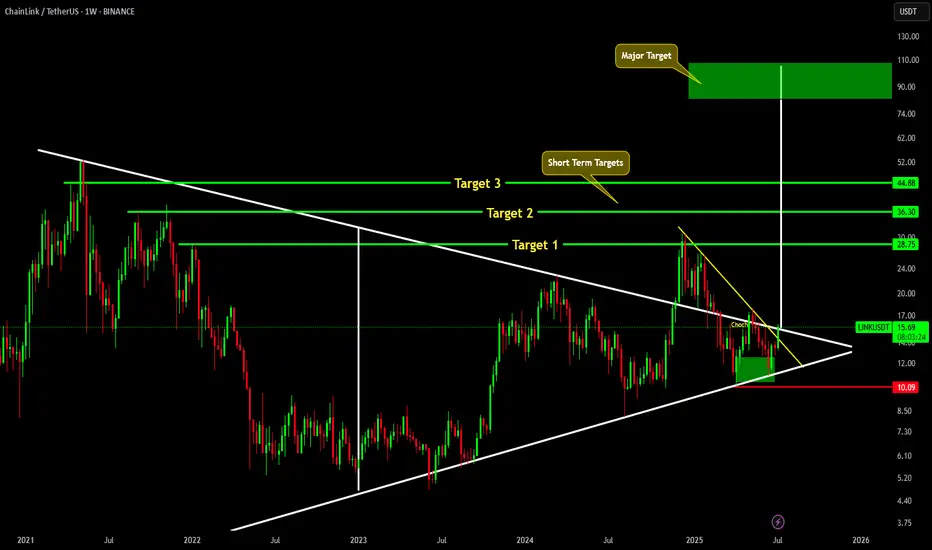
LINK MAJOR MOVE AHEAD !!!CRYPTOCAP:LINK is about to break above major trendline. If it successfully breaks above it, we will see CRYPTOCAP:LINK hitting short term targets of 28, 26 & 44. And Major target for link is around 80-100$.
LINKUSDT: Inverse Head & Shoulders Breakout! The Reversal BeginsBINANCE:LINKUSDT has broken out of a classic inverse head and shoulders pattern — a well-known bullish reversal formation. After the breakout, price action showed strength by coming back to retest the neckline support and holding it successfully. This confirms the pattern and signals a potential shift in trend.
From a technical perspective, this setup is highly promising. The market structure indicates a likely reversal after an extended downtrend, and the breakout could be the start of a strong bullish phase. With solid fundamentals backing BIST:LINK , the rally could gain serious momentum once it gets going.
This pattern isn’t just any breakout — it’s a reversal of the reversal, a major turning point in trend. If bulls take control, this move has the potential to accelerate rapidly. However, it’s crucial to always manage risk, use a well-placed stop-loss, and avoid overexposure.
Get ready — once the rally starts, it might be unstoppable!
BINANCE:LINKUSDT Currently trading at $15.5
Buy level : Above $15
Stop loss : Below $13
Target 1: $17
Target 2: $1.4
Target 3: $2.1
Max leverage 3x
Always keep stop loss
Follow Our Tradingview Account for More Technical Analysis Updates, | Like, Share and Comment Your thoughts

LINKUSDT 1D AnalysisLINK ~ 1D Analysis
#LINK Buy after successfully breaking through this resistance line with a short-term target of at least 10%++

#LINK/USDT#LINK
The price is moving within a descending channel on the 1-hour frame, adhering well to it, and is heading for a strong breakout and retest.
We are experiencing a rebound from the lower boundary of the descending channel, which is support at 14.50.
We are experiencing a downtrend on the RSI indicator that is about to be broken and retested, supporting the upward trend.
We are looking for stability above the 100 Moving Average.
Entry price: 15.80
First target: 16.45
Second target: 16.90
Third target: 17.56

LINKUSDT.P LONG SIGNSL 1hHello dear traders,
LINK is showing a bullish structure on the 1-hour timeframe, and it has the potential to move toward the liquidity zone around 13.290.
The trade setup is shown on the chart.
Please make sure to manage your risk properly.

Taking a look at LINK.This chart looks very interesting and contains many little tidbits of information about potential future outcomes. I see good things coming for LINK in the future.
Good luck, and always use a stop-loss!

#LINK/USDT
#LINK
The price is moving within a descending channel on the 1-hour frame, adhering well to it, and is heading for a strong breakout and retest.
We are seeing a bounce from the lower boundary of the descending channel, which is support at 12.84.
We have a downtrend on the RSI indicator that is about to break and retest, supporting the upward trend.
We are looking for stability above the 100 Moving Average.
Entry price: 13.33
First target: 13.58
Second target: 13.83
Third target: 14.20

Chainlink $LINK to 17$?⚠️ RISK TRADE ⚠️
👑 #LINK/USDT BUY 👑
Entry price:
13.76 - 14.17 🟩
Targets:
1️⃣14.62🎯
2️⃣15.24🎯
3️⃣16.04🎯
4️⃣17.05🎯

Link: Possible buying opportunity Link find support at 78.60% fib level. We can find similar pattern in previous impulse move. There is highly likely that Link will take off from here all the way to $30.

We need confirmation!This is my idea on BINANCE:LINKUSDT and what to expect in next few weeks. There are few alt-coins made higher high and proved it potential, of course one of them is BINANCE:LINKUSDT . As you can see there are 2 zones I consider very crucial (marked as YELLOW). Which means people bought, or entered Futures-Long position when BINANCE:LINKUSDT reached those points and we all know that Link made Higher-High after that that's why I think those areas are very crucial.
1. Unless BINANCE:BTCUSDT suddenly go up and reach 105k-110k area or CRYPTOCAP:BTC.D go down, we are not likely to see first scenario would happen.
2. About a week ago whole crypto made huge squeeze, that squeeze tells me third wave of Elliot wave theory about to begin in 1D timeframe. The moment we close that squeeze I will consider Long position. In this scenario there there is a old Resistance point end of the squeeze, that would be very comfortable place to enter Long position. Which is at 15.
3. There is a minor support zone in 1W timeframe, which I marked it as red block. Also entering in Long position from that area will be very comfortable or we might see squeeze to 13-14 area and close a candle above 15 area which would great opportunity to enter Long position too. If we ever go lower than this point wait and observe will be perfect choice.
In the end BINANCE:LINKUSDT still Bullish in 1W timeframe and I will be taking profits at 38 and 55 (ATH).

#LINK/USDT#LINK
The price is moving in a descending channel on the 1-hour frame and is expected to continue upwards
We have a trend to stabilize above the moving average 100 again
We have a descending trend on the RSI indicator that supports the rise by breaking it upwards
We have a support area at the lower limit of the channel at a price of 20.00
Entry price 20.64
First target 21.70
Second target 23.46
Third target 25.20

#LINK/USDT#LINK
The price is moving in a descending channel on the 1-hour frame and is expected to continue upwards
We have a trend to stabilize above the moving average 100 again
We have a descending trend on the RSI indicator that supports the rise by breaking it upwards
We have a support area at the lower limit of the channel at a price of 18.70
Entry price 20.33
First target 21.63
Second target 23.13
Third target 24.70

#LINK/USDT Ready to go higher#LINK
The price is moving in a descending channel on the 1-hour frame and sticking to it well
We have a bounce from the lower limit of the descending channel, this support is at 21.45
We have a downtrend on the RSI indicator that is about to be broken, which supports the rise
We have a trend to stabilize above the 100 moving average
Entry price 23.25
First target 24.12
Second target 25.53
Third target 27.12
