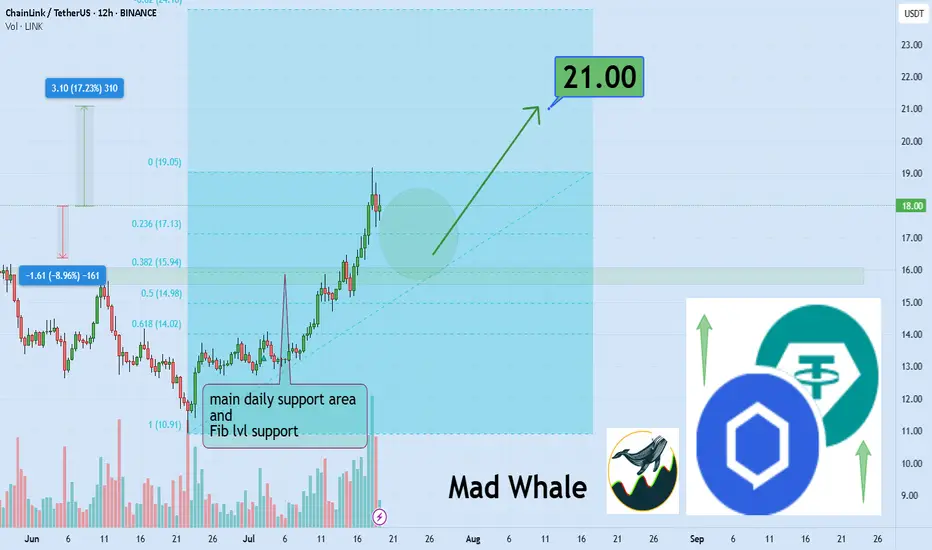
Chainlink Breaks Channel, Eyes 17% Upside Toward $21 TargetHello✌
Let’s analyze Chainlink’s upcoming price potential 📈.
BINANCE:LINKUSDT has broken out of its daily descending channel, printed a multi-month high, and is now pulling back toward daily and Fibonacci support levels; I'm eyeing a 17% potential move higher with $21 as the main target. 🔍📊
✨We put love into every post!
Your support inspires us 💛 Drop a comment we’d love to hear from you! Thanks , Mad Whale
LINKUSDT
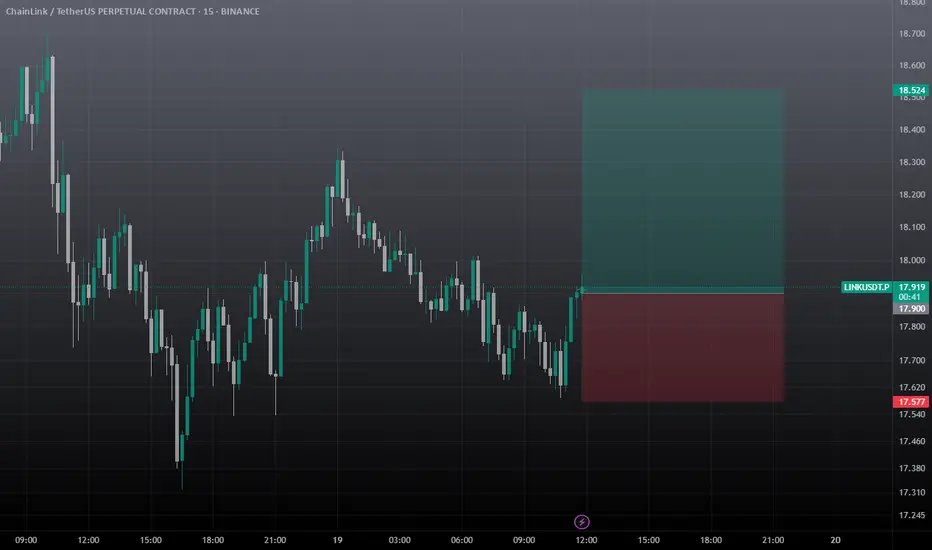
Link Scalp Trade IDEA / Long Scalp Setuplink looking to take out 18.5 area. can take at cmp 17.91, must use sl, it's a scalp trade so don't hold it for long time.
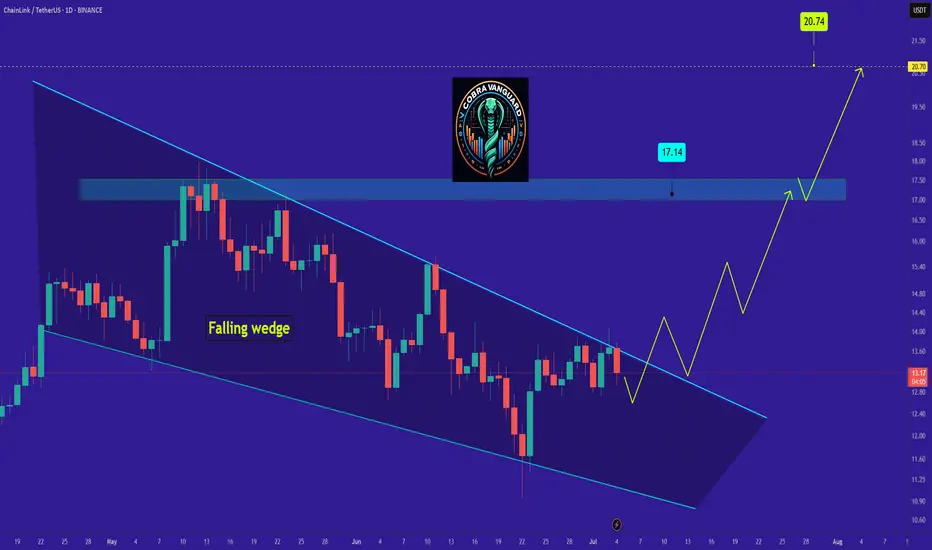
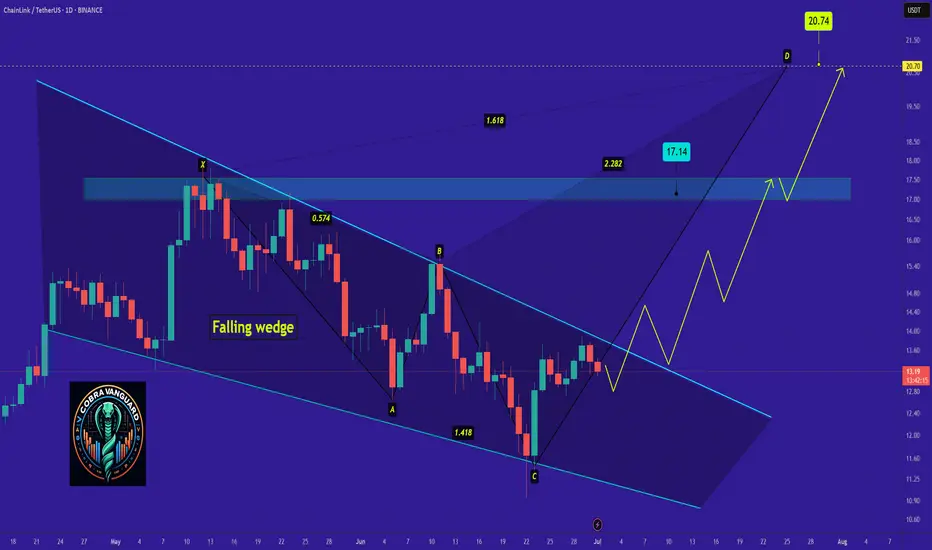
LINKUSDT Forming Falling Wedge LINKUSDT is currently forming a classic falling wedge pattern, a bullish reversal setup that often signals the end of a downtrend and the beginning of a strong upward move. The recent price action within the wedge shows decreasing volatility and tightening price levels, suggesting accumulation is underway. This setup, combined with increasing volume, indicates that a breakout to the upside could be imminent.
Chainlink (LINK) continues to draw investor interest due to its critical role in the decentralized oracle network ecosystem, which bridges blockchain smart contracts with real-world data. The project has maintained relevance in both DeFi and traditional enterprise solutions, and its consistent development activity keeps it on the radar of long-term crypto investors and short-term traders alike. With current market sentiment shifting more favorably toward altcoins, LINK’s technical and fundamental setup makes it a top watch.
The expectation for a 60% to 70% gain is well-supported by previous price performance following similar wedge breakouts. Traders are advised to monitor for a strong volume breakout above resistance lines, as this would confirm the move and likely initiate a new upward trend. If broader market conditions remain positive, LINKUSDT could move swiftly toward higher levels, fueled by both technical momentum and renewed investor confidence.
✅ Show your support by hitting the like button and
✅ Leaving a comment below! (What is You opinion about this Coin)
Your feedback and engagement keep me inspired to share more insightful market analysis with you!

LINK START...Hello friends🙌
📈As you can see, the upward trend has started, and the power is in the hands of buyers, and here we have an opportunity to enter a buy trade with risk and capital management to move with the specified goals.
🔥Follow us for more signals🔥
*Trade safely with us*

LINK's Situation, A Comprehensive Analysis !!!So if you pay attention to the LINK chart you can see that the price has formed a Ascending wedge which means it is expected to price move as equal as the measured price movement.( AB=CD )
NOTE: wait for break of the WEDGE .
Best regards CobraVanguard.💚
Wings of Opportunity: LINK’s Harmonic Setup Unfolding🦋 Title: A Butterfly on the Edge – But Only with Confirmation
On the 2H timeframe, a Bullish Butterfly Harmonic Pattern is unfolding. The wave structure (X → A → B → C → D) aligns closely with harmonic principles, and point D lies above X, within the 1.27 to 1.618 Fibonacci extension of XA — reinforcing the pattern’s validity.
📌 No entry has been triggered yet.
We are currently waiting for price to break and hold above the key resistance at 13.60 to confirm the bullish scenario.
🔹 Bullish Scenario (our primary and preferred outlook):
Given the strong reaction around the 12.74 demand zone and the harmonic structure completion, we are primarily focused on a long opportunity, if and only if confirmation is achieved above 13.60.
📥 Entry Zone: 13.05 – 13.65
🎯 Target 1: 17.94
🎯 Target 2: 18.76
🛑 Stop-Loss: Below 12.74 (structural invalidation)
🔻 Alternative Bearish Scenario:
If price fails to break 13.60 and instead loses the 12.74 support, the bullish setup becomes invalid, and the market could enter a deeper correction phase.
Potential downside targets in that case:
📉 11.80
📉 10.90 – 10.30 (if bearish momentum continues)
📊 Risk Management Notes:
Position sizing should not exceed 1% of total capital
Avoid early entries before confirmation
Prefer partial entries after breakout and retest
Stick to the invalidation level strictly
📈 While both scenarios are on the table, we are currently favoring the bullish setup, as long as price action supports it. Discipline and patience are key — confirmation first, trade second.

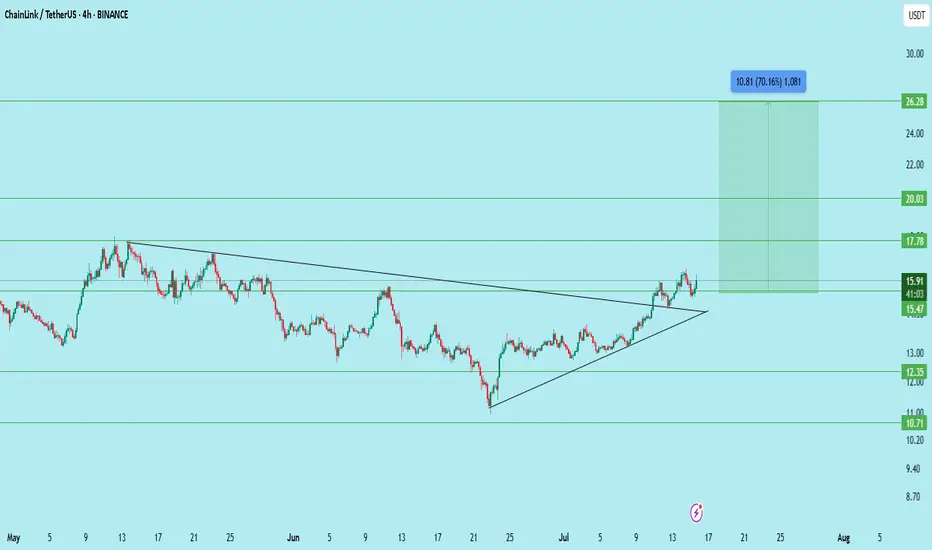
LINKUSDT – Breakout Retest | Ready for 70% Move?LINK has broken out of a long-term descending trendline on the 4H timeframe and retested the breakout zone. Price is holding well above the trendline and support levels, indicating strong momentum and a bullish structure.
Entry: 15.4–15.6
Support: 15.47
Resistance: 17.78
Targets: 17.78 / 20.03 / 26.28
Stoploss: Below 15.00
Structure: Triangle breakout
Potential: +70% upside if all targets are achieved
LINK is looking primed for a strong breakout continuation. Keep it on your radar.
DYOR | Not financial advice
LINKUSDTThis is chart ready for pump but wait for break 14$. BINANCE:LINKUSDT
I in below say best supports and resistance's.
Support:
12.66
11.50
10.50
resistance's:
14
16.68
17.70
⚠️Contorl Risk management for trades.

renderwithme | The unbreakable bond of Chainlink TechnicalBelow is a technical analysis of Chainlink (LINK/USD) based on the provided real-time financial data and general market insights. Please note that cryptocurrency markets are highly volatile, and this analysis is for informational purposes only, not financial advice. Always conduct your own research before making investment decisions.
# Current Price and Market Overview
Current Price: $16.70 USD at the time of posting
24-Hour Trading Volume: Not specified in the provided data, but recent sources indicate significant trading activity, with volumes around $422.74M to $672.42M.
52-Week Range: $3.25 (low) to $10.90 (high)
Previous Day Close: $16.67
chart for your reference

LINKUSD - Possible Correction from Channel ResistanceStructure: Ascending Channel
Indicators: RSI Overbought, Bearish Divergence Forming
📌 Confirmation:
Look for:
A strong bearish candle or
RSI breaking below 60
Volume divergence
Bias: Short-term bearish correction, bullish structure intact as long as price holds the channel.

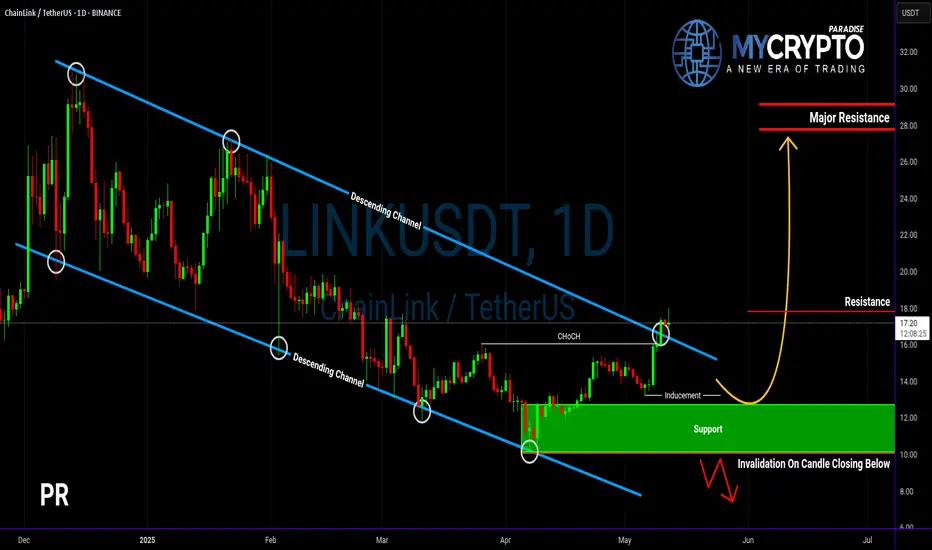
Will LINKUSDT Explode Soon — or Collapse Into a Trap?Yello Paradisers, are you prepared for the next big LINK move? The breakout you’ve been waiting for just happened — but before you jump in, let’s break down what’s really going on behind the chart.
💎LINKUSDT has officially broken out of its descending channel — a significant structural shift that immediately increases the probability of a bullish continuation. On top of that, we’ve seen a bullish CHoCH (Change of Character), a powerful sign that demand is stepping in. These are early but critical signs that bulls may be regaining control.
💎However, experienced traders know not to act on the first sign of strength alone. We now need to see how price behaves on the pullback. If LINK pulls back and takes out the inducement (removing weak hands), we’ll be looking for a bullish internal CHoCH (I-CHoCH) on the 1H timeframe. If that forms, the probability of a solid bounce from the support zone becomes extremely high — giving us the confirmation we need to position for upside.
💎On the other hand, if price breaks down and closes a candle below the support zone, this entire bullish setup becomes invalid. In that case, it would be wise to remain patient and wait for better, more reliable price action to develop before making any move. This is exactly where most traders lose by forcing trades instead of waiting for clear signals.
🎖A big liquidation event, which will first take both longs and shorts and fully get rid of all inexperienced traders before the real move happens, is very close to happening again. so make sure you are playing it safe Paradisers. It will be a huge money-maker for some and a total disaster again for the majority.
MyCryptoParadise
iFeel the success🌴
[UPD] BTC / ETH / XRP / SOL / HYPE and other alt and mem-coins A new video update with insights on the intermediate trend structure with key support and resistance zones to keep on radar in the coming sessions
Coins discussed in the video: CRYPTOCAP:BTC / CRYPTOCAP:ETH / CRYPTOCAP:XRP / GETTEX:HYPE / CRYPTOCAP:SOL / CRYPTOCAP:LINK / CRYPTOCAP:SUI / $BRETT / SEED_DONKEYDAN_MARKET_CAP:FLOKI and others
Hope this is helpful in guiding you through the crypto market. Thank you for your attention and I wish you successful trading decisions!
If you’d like to hear my take on any other coin you’re tracking - feel free to ask in the comments (just don’t forget to boost the idea first 😉).

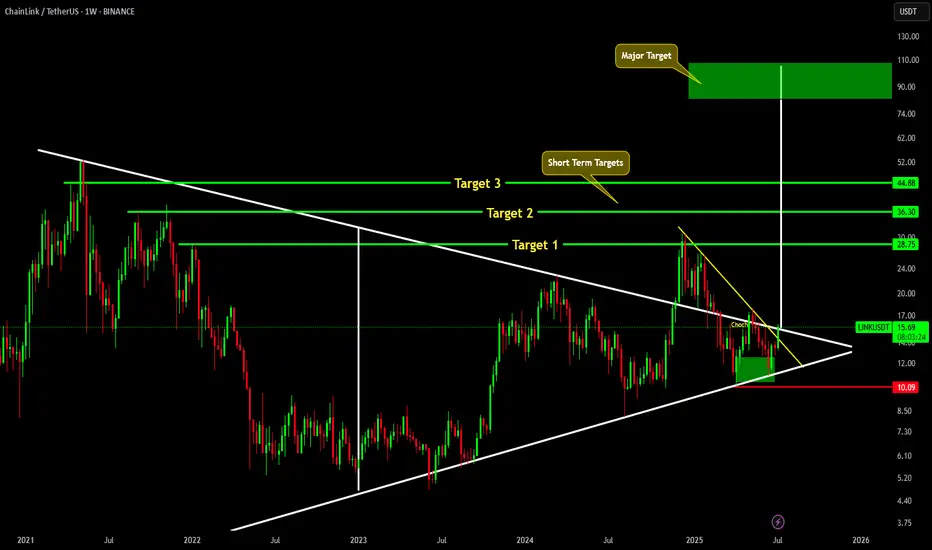
LINK MAJOR MOVE AHEAD !!!CRYPTOCAP:LINK is about to break above major trendline. If it successfully breaks above it, we will see CRYPTOCAP:LINK hitting short term targets of 28, 26 & 44. And Major target for link is around 80-100$.
LINK/USDT - SHORT/LONGI expect the movement to be implemented in about a month.
(Not an investment recommendation).

#LINKUSDT: Distribution Phase Has Started! Will It Hit $45? The accumulation phase has just ended, and the distribution phase has just begun. Our current concern is whether the bullish volume holds on and the trend continues to remain bullish. Please do your own research before blindly following the analysis, as this is just our bias and does not guarantee that the price will exactly follow the chart.
Thank you for your support throughout. We wish you the best!
Team Setupsfx_

[UPD] Trend analysis: BTC / ETH / SOL / XRP and other Just recorded a new video overview of the crypto market and the current trend developments in major coins: CRYPTOCAP:BTC , CRYPTOCAP:ETH , CRYPTOCAP:SOL , CRYPTOCAP:XRP , CRYPTOCAP:LINK , GETTEX:HYPE , BSE:SUPER , $FLOKI.
Among the new assets on my radar I shared my view on the trend structure of $RENDER.
In my personal investment planning, I continue to treat any potential corrections into key support zones as opportunities to add or open new positions.
Thank you for your attention and I wish you successful trading decisions!
If you’d like to hear my take on any other coin you’re tracking — feel free to ask in the comments (just don’t forget to boost the idea first 😉).

LINK Breaks Out of Multi-Month Range – Is $17 Next?Chainlink (LINKUSDT) just broke above a key resistance near $15.30 on the 8H chart, shifting market structure from lower highs into potential uptrend. Momentum is strong, with Stoch RSI deeply overbought, signaling possible short-term cooling before continuation. If LINK holds above $15.30, upside targets include $16.50 and $17.20 based on prior highs.
📊 Watching for a retest and hold of the breakout zone.
#LINK #Chainlink #CryptoBreakout #Altcoins #QuantTradingPro #TradingView

Chainlink Grows Above MA200, The Path is Clear To $65 (333% PP)Yes LINKUSDT broke a minor consolidation pattern but that's not all. The action this week is happening right above MA200. This level being conquered last week.
Good evening my fellow Cryptocurrency trader, how are you feeling in this wonderful day?
Chainlink is bullish now and has been bullish for months. Bullish doesn't necessarily means rising prices but potential for growth. Bullish happens at the bottom, when prices are low. Chainlink is bullish now and ready to grow.
For some people it might still be too early. "Anything can happen." "The bull market is not confirmed." "Wait for confirmation." "How do you know?"
I know because of the signals coming from the charts. I know based on marketwide action, Bitcoin's halving, the broader cycle, related markets, intuition, experience, astrology and so on. There are so many signals that it is impossible to mention them all. All these signals and systems point to the exact same thing, the same conclusion; Crypto is bullish, Bitcoin is bullish and Chainlink is set to grow next, now.
Now is the time for growth, it cannot go in any other way. Nothing else is possible, we are going up. It is still early. Not early for confirmation or certainty, early because we will have really strong growth.
It is still early because LINKUSDT is set to hit $44 followed by $65 in the coming months.
Just imagine the energy, the feeling, the euphoria, the market sentiment, your portfolio... Just try and visualize the market six months into the future. What do you see?
Maybe it is hard to feel for sure what is going to be like, but you can be certain that prices will increase. If you are holding Crypto, you will be happy with the results.
You deserve everything that will come to you because you were in when others were gone.
You deserve success and profits because you earned it by making the right choice.
You trusted Crypto, you trusted the market and now you will reap the reward.
Thanks a lot for your continued support.
Namaste.

"LINK - Time to buy again!"So if you pay attention to the LINK chart you can see that the price has formed a Ascending wedge which means it is expected to price move as equal as the measured price movement.( AB=CD )
NOTE: wait for break of the WEDGE .
Best regards CobraVanguard.💚
LINK/USDT (Chainlink to Tether) from the 4H interval⚡️ Technical situation – quick overview
✅ Breakout from the descending channel (purple lines)
✅ Resistance zone 14.42 – currently being tested
✅ Target within the breakout range – around 17.73 USDT
⚠️ Stochastic RSI in the overbought zone – local correction possible
🟪 Descending channel – broken!
The descending channel that has been in place since mid-May has been broken upwards.
Such breakouts often signal a change in the local trend.
Theoretical range of movement = channel height (~3.30 USDT) added to the breakout point (around 14.42) = ~17.73 USDT – perfectly aligned with your resistance level.
🟢 Key Resistance Levels (green):
Level Meaning
14.42 USDT Current tested resistance – psychologically significant
15.65 USDT Local high + June price gap
17.73 USDT Potential target after a breakout – range from the formation
🔴 Support Levels (red):
Level Meaning
12.73 USDT Support from the pre-breakout consolidation
11.91 USDT Key defensive level of the uptrend
11.07 / 10.12 USDT Historical support with strong demand reactions
📉 Stochastic RSI (oscillator):
Currently deep in the overbought zone (above 80).
This may indicate local exhaustion of momentum and a short correction before further upward movement.
However: in strong trends, the RSI may remain high for an extended period – it does not automatically provide a sell signal.
📈 Bullish scenario:
Retest of the 14.42 level as support → confirmation of the breakout
Then a move towards:
15.65 – local stop
17.73 – final target from the channel breakout
🟩 Stop-loss: e.g., below 12.73 USDT (loss of key support)
📉 Bearish scenario:
False breakout and decline below 14.42
Loss of the 12.73 level → possible quick decline to 11.91–11.07
🔴 In this case, a new swing low could open the way to 10.12 USDT.
📌 Summary:
Element Rating
Technical Pattern ✅ Breakout from a descending channel (bullish signal)
Current Level ❗ Test of Key Resistance – Decision Point
RSI (Momentum) ⚠️ Overbought – Correction Possible
Upside Potential (Target) 📈 17.73 USDT
Threat ❌ False breakout and return to below 12.73 USDT
🧠 My suggestion (not investment advice):
Observe the price reaction at 14.42 – if it holds above and consolidation forms → a signal to continue.
If the 4H/1D candle closes below, consider caution, as this could be a bull trap.

Link, 1DAs BTC is Falling And BTC is given Breakout of Pattern in 4Hr , then Remaining coins will also fall drastically .
in 1D pattern of ADA USDT , it is Breaking Down as BTC is also given Break Down of Pattern
Follow for More Ideas like This

SCRUSDT UPDATE
Pattern: Falling Wedge Breakout
Current Price: \$0.268
Target Price: \$0.398
Target % Gain: 50.1%
Technical Analysis: SCR has broken out of a falling wedge pattern on the 12H chart with a clean close above resistance. The breakout is backed by bullish candles and increasing volume, suggesting a potential 50% move upward.
Time Frame: 12H

Link short setup tradeAS previous short setup hits the tp but actually first manipulation to hit the sl, now closely monitor the trade and manually close if 4hr candle closes above the mentioned point, overall I'm bearish on whole market, needs to take a correction before another leg up, until unless usdt.d breaks and closes below 4.59% on 4hrs tf market is bearish, you need to take short position intsead of long positions, when usdt.d reaches 4.63% open short on link, inj, eth and btc and hold till 4.80%-4.89%. I will open long if we break 4.59% and retest this, other scenario if we reaches 4.80-4.90% first no long positions for me from here.
