BTC - Potential Crash Update As complicated as this has been, I still suspect this massive crash on BTC to occur.
My suspicion is this this move up isn’t a true bull market, but a bearish retest. DXY breaking down a major multi month bearish pattern shows a bull run beginning now and spanning our 5 years on BTC and equities.
I suspect BTC to continue abruptly dropping per my plan here, as laid out in previous posts.
Happy trading.
Liquidation

BTC - Short Update Part 2This chart shows the ascending parallel channel that supports 7,000-8,000 ultimate bottom - layered with BITCOIN ONLY liquidity zones on the multi day time frame.
The majority or liquidity in the chart is long position stop losses - leveraged sell orders.
Bitcoin has been moving straight up, consolidating sideways, straight up, consolidating sideways since End 2022.
This tells us the market is collecting long position stop losses and leaving them in tact IE not allowing price to fully drop and start triggering off the cascading chain reaction of sells that is a natural phenomenon.
Happy Trading.
Inside a Candle: How to Read Hidden Order Flow Without a DOM
Difficulty: 🐳🐳🐳🐋🐋 (Intermediate+)
This article is for traders who want to understand the “story” behind a candle’s shape — and learn to spot aggressive buying/selling, absorption, and traps without needing footprint or order book tools.
🔵 INTRODUCTION
Most traders see candles as static shapes — green or red, big or small. But each candle is a battlefield of orders . Even without access to a DOM or volume footprint, you can still extract valuable information from just the candle's body, wick, and context .
🔵 ORIGINS: WHERE CANDLESTICKS COME FROM
Candlestick charts trace back to 18th-century Japan, where rice traders needed a way to visualize price movements over time. A legendary trader named Munehisa Homma , who traded rice futures in Osaka, is credited with developing the earliest form of candlestick analysis.
Homma discovered that price wasn’t just driven by supply and demand — but also by trader psychology . He created visual representations of market sentiment by tracking:
The opening and closing price of rice
The highest and lowest price reached during the session
This system became known as the “Sakata rules,” and it laid the foundation for many patterns still used today — such as Doji, Engulfing, and Marubozu.
Western traders only began using candlesticks widely in the 1990s, when analyst Steve Nison introduced them to the broader financial world through his book Japanese Candlestick Charting Techniques.
Today, candlesticks remain one of the most powerful and intuitive ways to visualize order flow, momentum, and market psychology — even without a Depth of Market (DOM) or depth of book.
In this article, you’ll learn how to read hidden order flow by analyzing:
Wick length and positioning
Body-to-range ratios
Candle clustering and sequences
🔵 HOW A CANDLE FORMS
Before you can read a candle, you need to understand how it comes to life . A single candle represents the full auction process during its time window.
Here’s how it builds, step by step:
Candle opens — this is the open price .
As price moves up during the session → the high] updates.
As price moves down → the low] updates.
The final traded price when the time closes → this becomes the close price .
The wick = price areas that were tested but rejected
The body = where the majority of aggressive trades occurred
If buyers push price up quickly but sellers slam it down before the close — the candle will have a long upper wick and close near the open, revealing seller absorption.
Understanding this flow helps you recognize traps, fakeouts, and reversals in real time.
🔵 CANDLE BODY: WHO'S IN CONTROL
The body of the candle reflects the result of the battle between buyers and sellers. A wide body with minimal wicks means dominance and commitment.
Big body, small wick → clear conviction
In an uptrend: buyer aggression
In a downtrend: panic or aggressive selling
Small body, long wicks → indecision, absorption, or trap
Often appears near tops/bottoms
Indicates both sides were active but neither won clearly
www.tradingview.com
🔵 WICKS: THE SHADOWS OF REJECTION
Wicks are not just “leftovers” — they show where price was rejected after being tested.
Long upper wick = seller presence or absorption at highs
Long lower wick = buyer defense or trap spring
Double wick = liquidity sweep / false breakout
Use wick direction to spot:
Failed breakouts
Smart money traps
Exhaustion candles
🔵 HIDDEN ORDER FLOW PATTERNS
1️⃣ Absorption Candle
A large wick with little movement afterward — shows that big orders absorbed market pressure.
2️⃣ Trap Candle
A candle that sweeps above/below a key high/low and closes opposite — classic smart money fakeout.
3️⃣ Imbalance Candle
Large-bodied candle that closes near the high/low with no wick on the other end — implies one-sided aggression (and often leaves an imbalance).
🔵 CLUSTERING & SEQUENCES MATTER
Never read a candle alone. The sequence of candles tells the full story:
3+ rejection wicks near resistance? Liquidity building before breakout or trap
Bearish engulfing after long upper wick = smart money selling into retail buying
Tight-range dojis + volume spike = compression before expansion
Context + volume + structure = hidden flow decoded.
🔵 PUTTING IT TOGETHER: A REAL EXAMPLE
Price breaks above previous high
Candle closes with long upper wick and smaller body
Next candle opens, dumps fast, leaving imbalance behind
Buyers trapped — move likely to continue down
This is how you read order flow from candle anatomy .
🔵 TIPS FOR MASTERY
Use a lower timeframe (1M–5M) to see microstructure
Watch how wicks behave near S/R or OBs
Confirm with volume spikes or delta-style indicators
Use replay mode to slow down the story and study cause/effect
🔵 CONCLUSION
Every candle is a message. You don’t need expensive tools to read order flow — just your eyes, context, and curiosity.
Learn to see candles not as symbols, but as evidence of behavior . Absorption, imbalance, and traps are all visible if you look closely.
Why BTC hasn’t moved up recentlyBTC has been bobbing above and below this bearish triple crossover the past few months. What we see as consolidation is rather price getting stuck around these resistance levels.
The only reason why this would be occurring in my view, is due to the market makers having intention to allow this drop to play out.
The resistance is located at around 107,000 to 107,400 - watch this zone closely for a hold below / rejection and fast drop.
Scenario 1 marked with solid red line.
Scenario 2 marked with dotted red line.
Little update for y’all. Happy weekend trading.

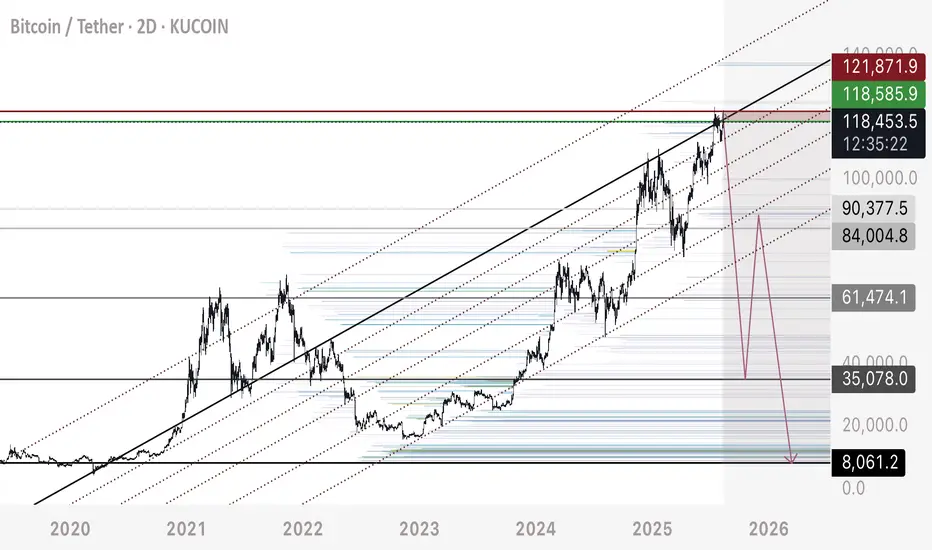
BTC - Update on Suspected Flash Crash ScenarioFor those of you who have been following my ideas, and I don’t think that would be many - understandably so, because these ideas seem so outrageous and out of the norm - I feel obligated to provide updated numbers per my own personal trade ideas.
I expect BTC to flash crash. In summary, here is why:
1. DXY is breaking down and retesting a major bearish trendline on the monthly. This alongside geopolitical events and sentiment, I expect the dollar to fall rapidly and store of value assets such as BTC to see a multi year bull run.
2. The market has been steadily bringing BTC up since late 2022. This leaves a trail of long position stop losses below the price, leaving a massive chain reaction of sell orders ready to set off one into the next. In other words, the orders required to make the drop are already in the chart.
3. It’s a question of when - BTC is under 3 intersecting bearish trendlines, and we can see how price breaks above and below these support / resistance levels historically. Eventually they will hold and play out, estimating when is tricky - that’s why I use DXY to predict it.
It’s difficult to pinpoint where the upper resistance is - but a pretty solid pick is around 105,200. I’ve used various numbers in the past for this idea, but it’s always refining and evolving based on what I see price doing.
I’m proposing two movements for a massive liquidation sweep of the lows prior to a 3-5 year bull run where BTC sees those quarter million dollar prices.
Scenario 1:
105,200 to 35,000
35,000 retrace to 77,000 ( although this doesn’t have to happen, I just anticipate a 3 wave corrective move)
77,000 to 10,000 (could be as low as 7,000)
7,000 and upwards of 200,000 (after all liquidity is absorbed and reclaimed)
Scenario 2:
105,200 straight down (for the most part) to 17,000 to 20,000
17-20,000 and upwards to 200,000 plus
Personally I feel scenario one is most likely. I’ve been trading this market since 2017 and the newfound “ stability “ of Bitcoin during the last 2 years cannot be trusted. This upwards move IS NOT a bull run. It’s a BEARISH RETEST.
Bearish retests typically move straight up, exactly as what’s been happening - following by a drop roughly 10 times as fast.
Same ideas on the larger time frames as smaller time frames.
WHEN DO I EXPECT THIS TO HAPPEN?
Starting any minute and spanning over the next several days to week.
Anyway - that’s my update for those of you who are interested.
Understand this stuff gets laughed at - but I experienced the same treatment when I told my group to long BTC at 16,500 in Jan 2023 to a target of 90,000. It’s not new to me and I expect it.
Doing my best to help advise and open your minds to alternative ideas.

BTC - On its way down from these trendlines How low can we go? We will find out.
Three bearish intersecting trendlines above.
Short began initiating from above as per my previous post.
I personally am not ruling out a flash crash to 10,000.
DXY is breaking down a major bearish trendline on the weekly / monthly - Market has a prime opportunity to manipulate Bitcoin into all of these long stop losses and trigger a massive liquidation event.
Stay alert and safe!

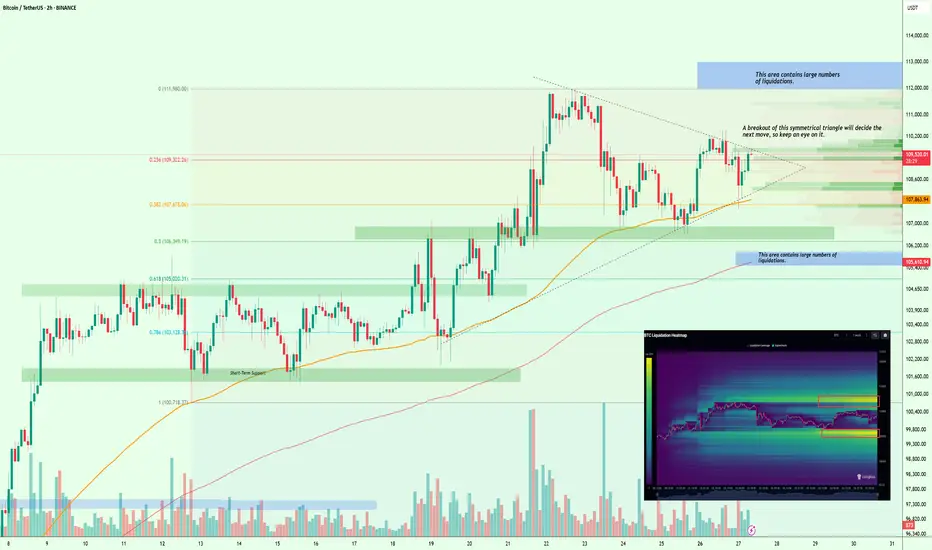
$BTC Liquidity Squeeze Incoming – Breakout or Breakdown?#Bitcoin
According to the liquidation heat map, CRYPTOCAP:BTC is building a large cluster of liquidations on both the upside and downside, creating some confusion in the market. However, the nearest major liquidation zone is around $112K–$113K, which increases the chances of a move toward that range.
Technically, BTC is forming a symmetrical triangle, and the breakout from this pattern will likely determine the next major move.
So keep a close eye on it.
I’ll keep you posted as things unfold.
If you find my updates helpful, don’t forget to like and follow for more!
BTC - Another Potential Bearish PatternHere I present my second alternative for a Bearish case for Bitcoin.
Per my previous posts I explain in detail the interest in recollecting liquidity in these lower zones. Previously I presented pathways to the uber lows at 7,000-10,000 - however this is another possible case.
I believe Bitcoin can see a drop from 109,200 straight down to 19,000-20,000
Why?
1. Major Volume support at this level
2. Major liquidity pools in confluence with this level
3. Price would form a W bottom with a higher low - which aligns with DXY breaking down on the monthly time frame. We can use DXY to project a bull market spanning 2-5 years (weakening dollar = more interest in deflationary assets such as Bitcoin)
4. Per the note above, it’s unlikely that BTC continues straight up without a sharp drop. The way this market works is to a large degree with leverage trading. The market and exchanges desperately want to shake out these longs, especially if we consider a 2-5 year bullish forecast through a macro view.
5. Confluence with this diagonal trendline which shows a clear support / resistance structure (note the Bitcoin chart is formed via diagonal ascending support and resistance lines - we can demonstrate this clearly and repeatable by duplicating the correct trendline and seeing how it forms the chart at any location)
Personally, I am shorting Bitcoin from 109,000 - and am expecting to see a fast drop through the rest of the weekend.
I will watch what the price does, where it reacts and interacts, and attempt to get a head start on understanding the true bottom before this “true” bull cycle begins.
Happy trading

BTC - Bullish Madness or Bearish Retest?Zooming out on BTC chart we can note this major bearish trendline on the HTF. This diagonal support / resistance line can take BTC to 7,000.
Likely? Maybe not. Possible? Absolutely.
A straight move up on BTC like we have seen the last two years is very dangerous. There is a large chain reaction of leveraged sell orders via long position stop losses cascading down the price levels.
Can this trigger a massive and fast flash crash?
In my view - absolutely.
Here are two potential moves that take price to those low liquidations levels.
Possibility 1
110,000 to 35,000
35,000 retrace to 81,000
81,000 to 7,000
Possibility 2
110,000 to 43,000
43,000 retrace to 72,000
72,000 to 7,000
Note that both of these possibilities end with 7,000. I’m mapping out two routes that take us there, using confluences with trendlines, volume profiles, liquidity mapping, and common sense.
Always remember that crypto is a very new market, with some unique mechanics that differentiate it from other more established markets. Predominantly the futures and high leverage usage and the ways these platforms make their money…
Beware and be prepared.

If Trend Reverses, We'll Most likely See 106-109k FirstTrading Fam,
We'll bring our knowledge of liquidity to the chart here today. You guys know that my new indicator utilizes liquidity as a prime factor in helping to alert us when to buy and sell any given asset. In our chart here today, I have also brought over the liquidation map from Glassnode, which will help us gain further insight into what Bitcoin's next move might be.
First, let me explain a few of the drawing here.
For those who may be new, those liquidity blocks are printed by LuxAlgo's "Liquidity Swings" indicator. I have incorporated them into my indicator and have combined it with another to alert me as to exactly when it might become a good time to buy or sell. Typically, I set the blocks to have a 15 day life cycle. When we are overbought and enter into a sell-side liquidity block, my indicator will flash a red dot. When we are oversold and enter into a buy-side liquidity block, my indicator will flash a green dot. These are typically super-accurate signals and are, at least, a good time to start your exits and/or entries but unfortunately, these DOTS DO NOT APPEAR in this chart due to this being a private indicator distributed by invite only.
I use additional indicators for confirmation and to support what my indicator is showing me, such as the VRVP. You can see the VRVP Point of Control (PoC) is at 96,425 in this chart, meaning that most of our recent traded volume is to the underside of us right now. This is positive. However, it is important to recognize that sometimes that PoC can act as sort of a magnet to pull price back to that area before further directional price trend movement. Keep this in mind as we continue to consider price movement here.
Back to the liquidity blocks. I've extended our last big liquidity block from Jan-Feb of this year out past the normal 15 day life cycle that I usually set. I think this is important as it appears to align with the data that I've brought over from Glassnode's Liquidation Map. Notice that on the map you see large liquidity pools both below the current price and also, above it. But the larger liquidity pool remains above us at the time of this post. This aligns with the resistance levels I have drawn on the chart in white which remain above us. And currently, we are also forming a bull flag pattern. So, are greatest probability of price movement right now remains to the upside. I am targeting that 106-108k area. Once hit, trend reversal could occur.
Here's what I expect.
We hit 106-108k. Then, at this point, the market must make a critical decision; do we continue up, beating previous highs, or do we first drop down and liquidate all those late longs from 93-104k?
Now, since we know that big money is in this game and wants as much as they can get at the best price possible, it is easier to determine what might occur. I suggest that once liquidation occurs up to 106-108k, sell-side pressure will be placed on the market in hopes of driving price back down to clean out all of those late long entries. That PoC level at around 96k is a good target here. Once this price has been hit, freeing up hundreds of millions in liquidated Bitcoin, the big buyers (smart money) will step back in to swoop up the loot and Bitcoin will be free to trend back up again.
Now, as always, I could be wrong. Let's talk about what happens if we beat our 106-108k overhead resistance levels. In this case, we could see Bitcoin pump as high as 125k before any local trend reversal begins to occur. I will re-assess at this point.
BLUF: 106-108k is key resistance. Mark your charts and keep your eye on what price does there. It will be key to what happens next.
✌️Stew

Millions Of Trades Liquidated —Bitcoin Flash Jump Beyond $100KMillions of people are about to get liquidated. The thing is that they set up their orders so that liquidation only happens above 100K and they think they will be able to close their position before Bitcoin reaches that level if it doesn't break down.
First, Bitcoin is not breaking down. Just notice that every time there is any type of bearish action it is quickly bought.
Second. No, no second that's all.
Bitcoin is set to grow and will do so in a flash. Rather than a flash crash, a flash advance.
Bitcoin always surprises so prepare because this is what will happen. Rather than going down as the majority actually expect, Bitcoin will break-up and do so strong, so strong that there will be no time to react. People will be caught in the shock and while they wait to look around and see what happens, Bitcoin will be moving up.
Instead of $100,000, it will go to $102,000 or $104,000 or higher just to make sure that all the over-leveraged are kicked out before additional growth.
This is just a friendly reminder.
Pray for the dead bears and people without a clue, they are about to lose everything, for them, it will be tough.
On our side though... Enjoy the profits as they come.
Namaste.

BTC - “Bull Market” OR Bearish Retest on HTF? Bitcoins excessive rise for the previous two years brings concern for the mechanics of this market. Moving only up for so long leaves much liquidity in the form of long position stop losses below the current price.
These stop loss orders, or leveraged sell orders, are an explosive chain reaction ready to set off.
Observe these two trendlines and copy them to your charts. These two bearish trendlines (in my view) are why bitcoin has truly been rising so freely.
Moves up in the form of bearish retests are fast and fluid, only after the rejection does price fall aggressively.
I anticipate two scenarios here in the realm of bearish ideas:
Possibility 1 - 30% Probability
96,700 to 34,500
34,500 retrace to 68,500
68,500 to 7,000
Possibility 2 - 70% Probability
96,700 to 43,000
43,000 retrace to 60,000
60,000 to 7,000
Note that both of these possibilities end with 7,000. I’m mapping out two routes that take us there, using confluences with trendlines, volume profiles, liquidity mapping, and common sense.
Be mindful of this possibility. And protect yourself accordingly.

Bitcoin - Back Under Intersecting Bearish TrendlinesBitcoin is back underneath these two intersecting bearish trendlines.
I have laid out two potential paths Bitcoin could take to play this out.
When an asset in crypto goes only up for so long, it leaves behind a trail of leveraged liquidity in the form of stop losses. These wide open gaps filled with long stop losses, is the fuel that would make such a move possible. In other words, the sell orders are already in the chart in order to make this possible.
Personally, I expect this to happen.
DXY is showing a major breakdown and bearish retest at the moment - with a falling dollar over the next 2-3 years, that translates to a true bull market for Bitcoin and related assets.
The market has a very small time window to recollect all of the long position liquidity in the chart, which is in the billions.
See my previous posts to see confluences, liquidity mapping, etc.
Happy trading and I will be trading this myself.

USDT Dominance on its way to 3.80%: Bullish or Stormy?USDT Dominance on its way to 3.80%: Bullish or Stormy?
USDT Dominance (USDT.D) is approaching the critical threshold with the recent decline. As seen in the chart, the direction is now down with the break of the uptrend. However, the general acceptance that this decline is the beginning of the bull season may mislead many investors.
Because when we look at the past, the 3.80% - 3.60% range has usually been the end point of the bull season, not the beginning.
What does this mean?
🔹USDT.D falls while BTC rises. However, these declines usually coincide with the last days of the bull.
🔹If there's a rapid descent into this zone, we could see a sharp rise in BTC. But this move is often the last wave.
🔹So when it comes to that level, while everyone is waiting for new highs, smart money may be preparing to exit.
Also another point to pay attention to;
🔸 On the BTC side, the 102K - 104K zone still remains the strongest liquidation area.
🔸 If USDT.D falls below 3.80% while testing this region, attention! That peak may be the last.
Therefore, while waiting for the above liquidation levels, we should keep an eye on the USDT.D chart. Because when it approaches 3.80 levels, risk bells may start ringing. This is the target for now.
As a result, when you start dancing to the song that will soon play in the background, do not forget that the music may suddenly stop and the lights may be switched off.

Bitcoin (BTC): Fake-out Above 200EMA | Sellers DominatingBitcoin had a nice rejection yesterday where we failed to form the BOS and break above the local highs, which resulted in a fakeout above the 200EMA and the price falling below that line.
As we see the demand in downward movement, we are keeping our sell target active as long as we are again below the local highs (at $85,750).
Markets sell exhausted, economy doomed....Be sure to have a tight stop-loss and small leverage on any position you would want to open. We expect to see a big liquidation hunting to happen soon thanks to the #China and #USA tariff war.
Swallow Academy

BTC - ABC Correction to Absorb Long Liquidity Further to my previous recent post, I wanted to highlight two indicators that accurately present us with liquidity on the BTC chart.
Connecting the pieces of the puzzle of this prediction - this ABC correction pattern allows the market to absorb the Long position liquidity left in tact on the chart.
Since these long positions leave a trail of leveraged sell orders (stop losses) - we should expect a mass chain reaction of these orders setting off one into the next, with increasing speed and momentum of the drop.
We do not need a black swan event for this to occur. The orders are already in the chart to allow it to happen, as an adverse consequence to open interest and open traders positions during the last 2 years.
There is many confluences to support this correction pattern, if interested in learning more, see my previous posts on Trading View.
Enjoy!

BTC FOMC FLASH CRASH / LIQUIDATION IDEAThe FOMC data this week could be a conduit that sticks the price to play down these two trend lines.
We can see the mass liquidity on the chart in these low zones.
Bitcoins consistent rise since late 2022 has been leaving a train of long stop loss orders (leveraged sell orders) underneath - think of the mechanics of “why it’s possible” as a massive chain reaction of stop losses getting fired off and creating mania and hysteria for further fear based selling.
If we see drops to these low zones, I’m presenting the TA evidence of it so that we know it’s not the bottom - but a liquidation move.
The worst thing people could do is sell at massive losses thinking BTC is going to zero.
I see this move occurring and following that over the next years, a BTC pushing upwards of those $140-$200k zones.
The market is interested in reclaiming this liquidity - we are awaiting the conduit or event to justify it.
This is my personal trading plan.
Happy trading to all and be safe out there.

BTC - Back Underneath Flash Crash Liquidation ZoneBitcoin is back underneath these trendlines.
Showing confluence with liquidity in the chart on higher time frames.
Be mindful of this correction pattern.

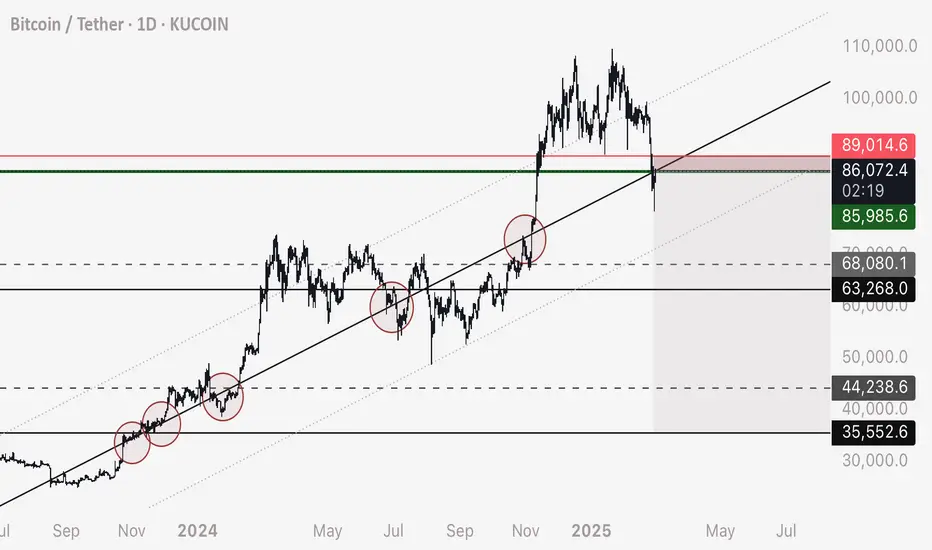
BTC - Watch this Trendline - Potential Short to 36,000I’ve drawn the main trendline and marked the contact points in red circles if you’d like to replicate this on your own chart
I’ve also demonstrated that when the correct trendline is identified, it can be duplicated and placed at different points on the chart that price seems to follow - IE support / resistance works on a diagonal grid
I’ve marked my personal entry in green, stop loss in red - minor targets in grey dashed lines and major targets in black solid lines
Fundamentally this drop makes sense as there is a mass amount of liquidity in these below zones.
Not financial advice, do your own research and experimentations.
God speed!
Is Liquidity Zones The Hidden Battleground of Smart Money In every market move, liquidity zones are the battlefields between buyers and sellers. Understanding these zones is crucial for spotting reversals and breakouts before they happen.
What Are Liquidity Zones?
High Liquidity Areas, Where large orders are placed, typically around key support/resistance or round numbers.
Low Liquidity Areas. Where price moves quickly due to fewer orders, often creating price imbalances.
Why Liquidity Matters
Smart money (institutions) seeks liquidity to execute large orders without massive slippage. Their footprints appear as wicks, sudden volume spikes, or rapid price reversals.
Spotting Liquidity Traps
False Breakouts, Price pierces a key level, triggers stop losses, and reverses quickly.
Stop Hunts, Sudden price spikes beyond a key level, only to return inside the range.
rading Strategy Example
1. Use volume profile or heat maps to spot high-interest price areas.
2. Wait for Reaction, Enter only after confirmation (e.g., a sharp wick or order flow shift).
3.Risk Management, Place stops beyond liquidity zones to avoid getting trapped.
Master liquidity zones, and you'll start seeing the market through the eyes of institutional players.

BTC Long, bear trap doneDaily level the last fews days not being able to break belove 95.500-95.000 level.
Looking at the btc liquidity heatmap, there is not really much liquidity left below, loads of liquidity left above 109.000.
Aiming for this huge RR trade, small stoploss. Would be my best trade ever if this succeeds.
Also lots of positive bitcoin news the last few days. Im bullish.
I was also waiting and waiting for 60k 80k levels, but i don't really think it will drop that far anymore, perhaps in the case of a massive world event.

Updated XRP Count Marco Wave 4 Completed What a tricky count! If it smells like a triangle, looks like a triangle then its probably triangle, right? Well in some case that is true in others it's not. Considering the price action we got yesterday with the liquidation event, we are forced to look at our alternative counts. This is a revised count of the competed Macro Wave 4 XRP.
Feel free to ask questions
God Bless and Trade on!

DXY LOOKS TO HEAD DOWN LOWER FOLLOWING FOMC ON WEDNESDAYDXY is retesting the previous fractal low zone from the (Buy Before The Sell). The weekly golden retracement is still not reached (0.382 Weekly Retracement). Following the FOMC anything can occur including spikes and market confusion. Trade all major dollar pairs with careful understanding.
