XRP — $2.5 Liquidity Zone Could Trigger the Next RallyAfter hitting a new all-time high (ATH) on 18th July, XRP failed to hold the previous ATH ($3.40) as support. This breakdown led to a –25% drop, finding support at the 0.5 Fib retracement of the $1.90 → $3.66 move, followed by a solid +24% bounce back to the pATH (200B MC at $3.36) and 0.702 Fib retracement → an ideal short opportunity.
Now XRP has been trending in a descending triangle pattern for 50 days, with $3 acting as the key resistance. This level is the Point of Control (POC) of the last 75-day trading range, adding weight to its importance. On top of that, the anchored VWAP (~$3.035) is currently reinforcing $3 as additional resistance.
🧩 Confluence Support Zone ($2.665–$2.45)
Liquidity cluster: many stop-losses reside here
Anchored VWAP (support): ~$2.62
Yearly anchored VWAP: $2.59 → strong support level
Golden Pocket (0.618–0.666): $2.5777–$2.4936
21 EMA ($2.665) / 21 SMA ($2.576) (weekly): dynamic HTF support
233 EMA ($2.44) / 233 SMA ($2.53) (daily): strong moving average cluster
Market Cap Support: $2.52 aligns with the $150B level
1.0 Trend-Based Fib Extension: $2.4498 → aligning perfectly with the $2.5 support zone as a reversal point
This creates a high-probability long entry zone between $2.665–$2.45, with multiple overlapping technical factors.
🟢 Long Trade Setup
Entry Zone: $2.665–$2.45
Stop-Loss: Below $2.25 for now, to be adjusted once price action confirms a reversal.
Potential Gain: up to +60% depending on execution
Technical Insight
After 50 days of correction, XRP is approaching a major liquidity and confluence zone.
The golden pocket, VWAP, EMA/SMA clusters, market cap support, and 1.0 Fib extension all stack together at around $2.5, making it a powerful reversal point.
Meanwhile, $3 remains the key resistance, reinforced by the POC of the last 75-day range and the anchored VWAP (~$3.035). Bulls must reclaim this level to confirm bullish continuation.
Key Levels to Watch
Support: $2.665–$2.45 (reversal zone)
Resistance: $3.00
🔍 Indicators used
Multi Timeframe 8x MA Support Resistance Zones → to identify support and resistance zones such as the weekly 21 EMA/SMA.
➡️ Available for free. You can find it on my profile under “Scripts” and apply it directly to your charts for extra confluence when planning your trades.
_________________________________
💬 If you found this helpful, drop a like and comment!
Liquidity

EURGBP - Bullish Flow form 30M OBBias: Bullish
HTF (4H Overview):
Strong bullish structure overall, with layered minor structure mapping within the flow supporting continuation.
MTF (30M Zone):
Price mitigated a 30M order block and respected the demand zone perfectly, confirming buyers in control.
LTF (Confirmation):
A CHoCH formed, then another CHoCH confirmed strength. Price is now riding the 30M leg as planned.
Entry Plan:
Look for pullback opportunities aligning with demand to join the bullish leg.
Targets:
Next liquidity pools and highs in alignment with 30M structure.
Mindset Note:
Ride the leg, don’t chase—let price return to you.

NASDAQ - Bullish Flow into Highs
Bias: Bullish
HTF (4H Overview):
From the bird’s-eye view, structure remains bullish. Liquidity is being targeted across the 30M–4H multi-timeframe play, with strong bullish intent confirmed by volume printing to the upside.
LTF (30M / 5M Confirmation):
A proper CHoCH has been established. Once the trend shift occurs, we wait for the pullback before attending longs.
Entry Plan:
Look for entry after the courtyard liquidity is collected and demand is mitigated (slash zone).
Targets:
Initial: 5M highs
Extended: 30M highs, depending on market delivery.
Mindset Note:
Patience—let liquidity do its job before striking.

EURUSD - Published Idea (Bullish Bias)
Bias: Bullish
HTF (4H Overview):
Price is showing strong bullish intent. Structure remains to the upside, and a key order block has already been mitigated with liquidity swept from the courtyard.
MTF / Internal Framework:
A CHoCH has confirmed bullish momentum, but price is currently reacting at a supply area. This signals that sellers may look to bring price down into our deeper point of interest — the internal framework OB that sits beneath courtyard liquidity.
Plan:
• Wait for sell-side liquidity to be taken.
• Look for deep mitigation into the marked OB, where multiple bodies fill the zone.
• From there, we anticipate lower timeframe CHoCH confirmation to align with longs.
Current Focus:
Price is testing supply near major highs, with liquidity clustered above. This indicates potential short-term bearish delivery before the next bullish continuation.
Targets:
Liquidity above the supply area and HTF highs once demand confirms.
Mindset Note:
Patience. Let smart money lead the way — we react when liquidity clears, not before.

“Bitcoin Price Action: Liquidity Grab Fuels Next Bullish Impulse“Bitcoin Price Action: Liquidity Grab Fuels Next Bullish Impulse 📈”
Hello Traders & Investors,
Let’s take a closer look at BTCUSD from both a structural and liquidity perspective.
🔹 Market Structure
The chart shows that after a strong bullish leg into mid-August, BTCUSD faced heavy rejection from the 120,000 – 123,000 resistance zone, which remains the most important supply area on the chart. This rejection triggered a clear Break of Structure (BOS), leading to a correction and liquidity grab.
Recently, price created a liquidity sweep in the 108,000 – 110,000 region, trapping late sellers and collecting orders from beneath previous lows. Following that, BTCUSD reclaimed the 111,000 – 112,000 zone, confirming it as new support.
🔹 Liquidity & Smart Money Behavior
The downside sweep indicates accumulation, where smart money entered long positions.
Liquidity resting above current levels (towards 116,000 → 120,000) is now the most likely target for price.
The previous liquidity channel to the downside has been fully absorbed, shifting bias toward bullish continuation.
🔹 Key Levels to Watch
Support: 111,000 – 112,000 (liquidity sweep + reclaimed support).
Resistance: 120,000 – 123,000 (major supply and reaction zone).
🔹 Projection
As long as BTCUSD holds above 111,000, my bias remains bullish. The next objective lies at the 120,000 zone, which aligns with untested supply and prior rejection levels. However, traders should be prepared for a reaction or short-term retracement once this area is tested.
✅ Conclusion:
BTCUSD has shown strength after sweeping liquidity from the downside. The structure now supports a bullish push toward 120,000, provided 111,000 support continues to hold. This remains a critical level for validation of further upside.

BTC: 112,681 in sight, 115.3k if breakout holds__________________________________________________________________________________
Market Overview
__________________________________________________________________________________
BTC bounced back above the weekly pivot 111,965 after a dip below 110k and is hovering near 112.2k, still trapped inside the 104k–116k corridor. Short-term momentum is positive but capped by a 4H/6H “Pivot High.”
Momentum: Bullish 📈 in the short term within a broader range; buyers defend 111,965 but meet supply at 112,681.
Key levels:
- Resistances (4H/6H → 1D): 112,681 (240 PH), 115,300 (720 PH), 124,277 (D PH, distant extension).
- Supports (4H → 1D): 111,965 (W PH turned support), 109,905 (240 PL), 107,300 (cluster PL).
Volumes: Normal on HTF; notable 1H spike during the recent push.
Multi-timeframe signals: ST (15m–1H) bullish; mid TF (2H–6H) still corrective; HTF (12H–1D) constructive → bias improves if 112,681 flips to support.
Risk On / Risk Off Indicator: VENTE (moderate risk-off) — it contradicts the intraday bounce and can cap extensions without a catalyst.
__________________________________________________________________________________
Trading Playbook
__________________________________________________________________________________
The market is a “range with a bullish lean”: trade conditional entries, confirm breakouts, and keep stops tight.
Global bias: Neutral Buy with key invalidation below 109,900 (loss of the 240 PL base).
Opportunities:
- Continuation long: break & retest of 112,681 to target 114.0k then 115.3k.
- Defensive long: clean pullback holding 111,965 (1H higher low) to re-test 112,681.
- Tactical short: clear rejection at 112.68–113.0k (bearish 4H candle) to 112.0k then 111.0k/109.9k.
Risk zones / invalidations:
- 4H–12H close below 111,965 reopens 110k then 109.9k.
- A reclaim above 115,300 invalidates the mid‑TF bearish structure and unlocks 120–124k.
Macro catalysts (Twitter, Perplexity, news):
- FOMC: September remains “live”; a cut is increasingly priced — supportive for risk if confirmed.
- NFP/Unemployment: a soft print would fuel risk-on and breakout follow‑throughs.
- Crypto liquidity: fresh $2B USDT mint + cross‑chain reallocations — deeper books if 112,681 breaks.
Action plan:
- Long (break & retest 112,681): Entry 112.70–112.85k / Stop <111.90k / TP1 114.0k, TP2 115.3k, TP3 120.0k / R:R ~1.8R to 3R.
- Short (rejection 112.68–113.0k): Entry 112.7–112.9k / Stop >113.1k / TP1 112.0k, TP2 111.0k, TP3 109.9k / R:R ~1.2R to 2.5R.
__________________________________________________________________________________
Multi-Timeframe Insights
__________________________________________________________________________________
This is a “range‑recovery” alignment: ST drives, mid TFs resist, HTFs remain supportive.
1D/12H: Constructive above 111,965; a clean move through 112,681 sets up a test of 115,300 (major range ceiling).
6H/4H/2H: Still printing a “lower high” under 115.3k; 112,681 is the rotation hinge — rejections = 112.0k/111,965 retests.
1H/30m/15m: Bullish momentum with elevated 1H volumes; needs solid close/retest above 112,681 to avoid a fakeout.
Key divergences/confluences: ST strength + HTF support vs Risk On / Risk Off Indicator in VENTE and mid‑TF corrective tone → prioritize confirmed flips at 112,681.
__________________________________________________________________________________
Macro & On-Chain Drivers
__________________________________________________________________________________
Macro is leaning toward monetary easing while stablecoin liquidity expands — a supportive backdrop if technical levels confirm.
Macro events: Fed keeps September “live” with a cut increasingly priced; a soft NFP would add risk-on fuel; oil softens and gold appetite stays firm — near‑term inflation pressure eases.
Bitcoin analysis: Price ~111.5–112k with short‑squeeze risk if momentum continues; BTC spot ETF flows remain flat vs improving ETH — implying measured BTC spot demand but reactive to technical breaks.
On-chain data: +$2B USDT minted and cross‑chain shifts → deeper market depth; URPD/accumulation in 108–116k matches the range; neutral funding = fragile momentum.
Expected impact: A dovish follow‑through (cut pricing + soft jobs) supports the “Neutral Buy” toward 115.3k; risk‑off shocks would pressure 111,965/109,9k.
__________________________________________________________________________________
Key Takeaways
__________________________________________________________________________________
Range market with a recovery bias as long as 111,965 holds and 112,681 turns into support.
- Overall trend: short‑term bullish/neutral inside the 104k–116k range.
- Most relevant setup: confirmed breakout above 112,681 targeting 115.3k.
- One key macro factor: growing odds of a September Fed cut boost risk appetite.
Stay disciplined: trade confirmation, not anticipation, and respect stops. ⚠️

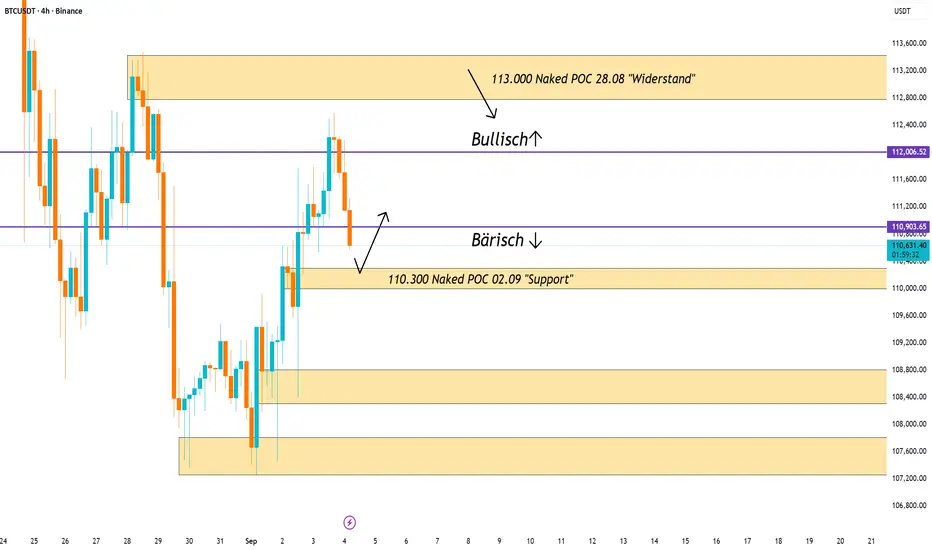
Bitcoin in the decisionBitcoin opened bearish today, and this outlook remains as long as we trade below 110,900.
At 110,300 we still have a naked POC from September 2nd, which should act as support. Since this level often acts like a magnet, I expect we might revisit it. It is important that this level holds – otherwise, a quick move down toward 108,600 could follow, which I see as the next real support.
If we somehow manage to reclaim 112,000, the picture flips back to bullish. In that case, a test of the naked POC at 113,000 would be the target, where I expect strong rejection.
“BTCUSD Road to 120K – But Watch the Trap Ahead!”“BTCUSD 🚀 Road to 120K – But Watch the Trap Ahead!”
Bitcoin has shown strong momentum after a liquidity sweep around 108,000, signaling that big players collected orders before pushing price higher. This is a common smart money concept (SMC) move where liquidity is grabbed before the next leg.
🔑 Key Points to Note:
Previous Support Flip: Market reclaimed the broken support, turning it into a base for continuation.
Upside Target: The next major resistance zone is 120,000 – 123,000, where sellers are likely to step in.
Market Behavior: Price often sweeps liquidity before testing strong resistance, so patience is key.
Potential Pullback: Once resistance is tapped, a correction may follow as profit-taking starts.
📌 Educational Takeaway: Always watch how price reacts at liquidity zones and key resistance points. These levels often decide whether the trend will continue or reverse.
📈 For now, short-term bias = bullish toward 120,000, but be cautious for a possible rejection at that zone.

GBPUSD | PDL Sweep → Bullish Swing into PDH LiquidityThis setup is a textbook liquidity play: PDL sweep + CHoCH + refined demand POI. Targeting PDH liquidity next.
📍 Setup Context:
- Price swept the Previous Day Low (PDL), confirming a liquidity grab.
- A CHoCH has formed, signaling bullish intent.
- Refined POI (1H Demand Zone aligned with 15m FVG) gives a clean entry zone.
📊 Trade Plan:
- Entry: Buy limit inside refined POI
- Stop Loss: Below swept PDL (invalidation if daily close returns below)
- Take Profit 1: 1:2R (partial 50%)
- Take Profit 2: Previous Day High (PDH liquidity run)
- Take Profit 3 (extended): Daily imbalance above PDH
NOTE: You can still scale down to 5 minutes for a more refined entry..

Fannie Mae (FNMA) AnalysisCompany Overview:
Fannie Mae OTC:FNMA , the government-sponsored enterprise (GSE), plays a critical role in supporting the U.S. housing market through mortgage liquidity and stability.
Key Catalysts:
Q2 2025 support: Provided $102B in liquidity, helping 381,000 households—with over 50% being first-time buyers.
Earnings stability: Recurring guaranty fees ensure consistent revenue streams.
Capital strength: Net worth rose to $101.6B, highlighting robust capital buffers.
Tech partnership: New collaboration with Palantir enhances fraud detection & risk management, strengthening long-term earnings protection.
Macro headwinds: Higher mortgage rates and slower home sales remain challenges, but FNMA’s scale & systemic role provide resilience.
Investment Outlook:
Bullish above: $9.20–$9.50
Upside target: $18.00–$19.00, supported by housing liquidity leadership, capital growth, and risk-management innovation.
📢 FNMA — a housing backbone with strong buffers and growth optionality.
#FNMA #HousingMarket #GSE #MortgageFinance #Palantir #Liquidity #Investing

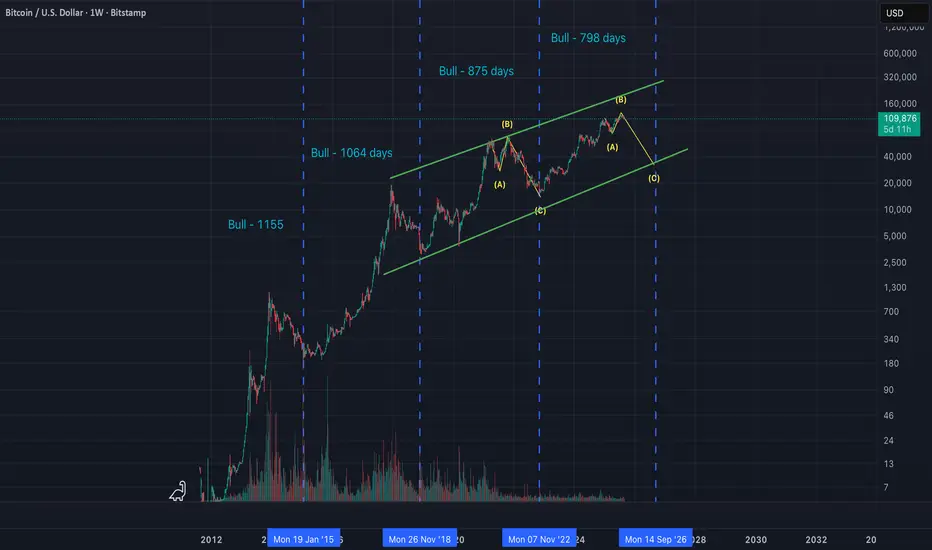
I hate to say it, but BTC is done - !Cycle ended!I've plotted the time in which each bull cycle takes to complete. Each run is getting shorter, not longer.. So looking at the previous run, we can see that we saw an expanded ABC to correct - one more little peak at at ATNH but then down into the inevitable correction. I think exactly the same thing is playing out here. We've seen so much brevado, but almost no new liquidity - there may well be a rate cut or two coming in September but I feel it's already priced in. When Powell inferred there would be cuts a few weeks ago, the market jumped but then dumped. Buy the rumour, sell the news. So - I'm out, cashed in my chips. Off to buy a new car.
Bearish Momentum for Bitcoin!Looking at the Daily Time-frame, we can see that the market structure has been broken. The high formed in the 14th of July, where liquidity was resting, was taken out and immediately price began its down-ward spiral! Within a period of 9 days, the low formed on the 2nd of August was taken out, qualifying that level as a breaker, but a more decisive move took place on the 25th.
Thus we can see, by the unwillingness of price to go above the breaker level, that the market is bearish! Right now, I am waiting for price to reach the 111,855 level to see how price will react.
All the best with your trading.

Gold Possible Long SetupThere is resting liquidity just below the recent lows, so we can look for a long setup if the price goes below these levels.

Bitcoin Manipulation or Opportunity? Watch This Zone!⚡ Bitcoin Manipulation or Opportunity? Watch This Zone!
The chart highlights significant liquidity zones, BOS (Break of Structure), and liquidity sweeps, pointing to how price action is driven by institutional order flow.
🔎 Key Observations:
Break of Structure (BOS): Multiple BOS points confirm shifts in market direction as price transitioned from bearish → bullish → bearish again.
Liquidity Grab: Notice how price swept liquidity around previous support before reversing—classic manipulation to trigger stop losses before a move higher.
Downtrend Liquidity Channel: Price followed a controlled bearish liquidity channel after rejecting the resistance zone at 120,000 – 123,000, showing distribution.
Liquidity Sweep (Latest Move): The recent sweep near 108,000 suggests that sellers were trapped, providing liquidity for potential buy-side movement.
Projection: Based on the liquidity sweep, a rebound toward 116,000 – 118,000 is anticipated ⭐. However, interim resistance at 112,000 must be broken and retested to confirm bullish continuation.
⚠️ Risk Note: If price fails to hold above the liquidity sweep zone, a deeper correction could occur.
📌 Conclusion:
BTCUSD is showing signs of a bullish reversal after liquidity manipulation. Traders should watch for confirmation above 112,000 to target the 116,000 – 118,000 range, aligning with smart money concepts.

EUR/USD - Buy Signal📊 EUR/USD – Multi-Timeframe Outlook
🔎 Monthly (1M)
Price has been respecting a bearish liquidity trendline for years, but momentum is shifting.
Current structure testing the monthly extreme supply zone, with upside potential if buyers can maintain control.
Long-term target level stands around 1.19 – 1.20, aligning with higher timeframe liquidity.
🕰 Weekly (1W)
EUR/USD continues to build strength within a swing range, pressing into resistance.
Target zone sits near 1.19 – 1.20, where previous liquidity was swept.
Weekly close above this area would confirm a bullish macro reversal.
⏱ Daily (1D)
Immediate demand zone ~1.17 providing support after a recent BOS (Break of Structure).
Structure favors a push into 1.185 – 1.19 to clear buy-side liquidity resting above.
If 1.1680 breaks, deeper retracement into mid-range liquidity before continuation.
⏳ 1H
Clean sweep of liquidity into immediate demand.
Bulls stepping in, with upside targets toward 1.185+ short-term.
Short-term confirmation needed above 1.1760 to fuel further momentum.
🎯 Trade Plan
Bias: Bullish continuation toward liquidity grabs
Entry Zone: 1.1680 – 1.1730 demand
Targets: 1.185 (short-term), 1.1900 – 1.20 (swing)
Invalidation: Break below 1.1650 demand support

BTCUSD | Bullish Bias - Watching for Continuation🔹 HTF (4H): Structure is bullish and intact. Price broke major external highs, leaving bullish momentum at the top. Despite a deep pullback into a refined internal OB, structure remains respected — no lows invalidated.
🔹 MTF (30M): Price mitigated the refined OB and made a professional sweep at the lows, giving a temporary bearish appearance, but the bullish structure holds. Continuation setups are forming.
🔹 LTF (5M): Waiting for price to take out the lower timeframe lower high — CHoCH confirmation. Once that shift occurs, bulls will look to attend longs and ride continuation toward the upside.
🔹 Execution Plan: Patience is key. Let smart money reveal itself and the OB defend before committing to entries.
🔹 Mindset Note: Trend is your friend — follow price, stay alert, and wait for confirmations. Popcorn out until the market shows its hand.

XAUUSD | Bullish Bias - Structure Respected, Continuation Play🔹 HTF (4H): Structure is bullish and being respected within the major timeframe range. Clean pullbacks and OBs are holding, and price continues breaking highs — climbing steadily toward upside targets.
🔹 MTF (30M): Watching for continuation off the previous highs. Waiting for a sell-side liquidity sweep into the internal framework OB.
🔹 LTF (5M): Once OB is tapped, looking for confirmations to enter longs and ride the next bullish leg toward higher highs.
🔹 Execution Plan: Patience — let smart money reveal itself before taking entries.
🔹 Mindset Note: Price respects structure; our role is to wait for the right confirmation before committing.

NASDAQ (US100) | Bullish Bias - Continuation in Play🔹 HTF (4H): Structure is bullish and respected. Momentum is strong to the upside, and higher lows remain intact — bullish intent confirmed.
🔹 MTF (30M): Refined structure shows price slashed through the recent internal OB but held — structure remains intact. A deeper sweep into an internal OB refined the order block further.
🔹 LTF (5M): Price switched character from bearish to bullish. Previous week we caught a bullish move, now looking for a second continuation setup toward highs this week.
🔹 Execution Plan: Waiting for price to mitigate the OB zone. Once tapped, we’ll attend bullish longs with precision.
🔹 Mindset Note: Patience is the edge — let smart money reveal itself before taking the next position.

EURNZD | Bullish Bias - Waiting on Courtyard Liquidity Slash🔹 HTF (4H): Structure is clean and bullish with strong momentum holding to the upside.
🔹 MTF (30M): Looking for continuation longs. Waiting for that sell-side liquidity (courtyard) to be cleared and price to tap into my refined OB zone.
🔹 LTF (5M): Once price reaches the OB, I’ll wait for confirmations before committing to longs. No confirmation, no trade.
🔹 Execution Plan: Patience until OB mitigation — only then will I engage longs toward the highs.
🔹 Mindset Note: Smart money reveals the hand, we follow with precision.

EURGBP| Bullish Bias - Structure Aligned for Continuation🔹 HTF (4H): Structure is bullish and respected with strong intent and momentum to the upside.
🔹 MTF (30M): Sell-side liquidity was swept into my refined internal OB. The last bearish move mitigated the block, keeping structure aligned for continuation.
🔹 LTF (5M): Previous week we caught the bullish leg. Now I’m tracking a second entry setup for continuation longs toward the highs.
🔹 Execution Plan: Waiting for price to return into the refined OB zone. Once tapped, I’ll look for LTF confirmations to engage longs.
🔹 Mindset Note: Patience — let the liquidity clear and allow smart money to show its hand before we commit.

USDCAD| Bullish Bias - Deep Sweep, Smart Money at Work🔹 HTF (4H): Structure remains bullish with strong intent. Price refined into higher-timeframe OBs, digging deeper but still holding bullish order flow.
🔹 MTF (30M): A “Courtyard Liquidity Slash” cleared sell-side liquidity and price mitigated an internal OB. Despite a deep sweep that appeared bearish, structure remains intact.
🔹 LTF (5M): Now waiting for a visual CHoCH to confirm reversal off the significant HTF OB. Only then will I attend longs, looking to ride the next bullish leg into highs.
🔹 Execution Plan: Stay patient — once smart money reveals itself with confirmation, I’ll engage longs from refined zones. Until then, no need to force entries.
🔹 Mindset Note: Deep sweeps don’t change bias; they prepare the path. Let the market prove the hand before we strike.

AUDUSD| Bullish Bias - Momentum Holding Strong🔹 HTF (4H): Structure shows clear bullish intent with strong momentum to the upside. Large bullish candles confirm continuation potential.
🔹 MTF (30M): Price cleared liquidity, mitigated the OB, and refined structure for continuation longs.
🔹 LTF (5M): A CHoCH confirmed directional shift, leading to bullish runs toward the highs.
🔹 Execution Plan: Waiting for price to mitigate my marked OB before reloading longs to target major highs. Until then, patience — let smart money defend the level before we step back in.
🔹 Mindset Note: The market is delivering. Our role is to wait for the OB to be tapped and then execute with precision.

USDJPY| Bullish Bias - Continuation in Play🔹 HTF (4H): Structure remains bullish as external highs continue to break. Price respects bullish intent, confirming upside momentum.
🔹 MTF (30M): Sell-side liquidity has been taken and price tapped cleanly into the OB, showing solid mitigation.
🔹 LTF (5M): A CHoCH has printed, confirming the shift. Now I’m waiting for a second entry opportunity to ride continuation toward the highs.
🔹 Mindset Note: Patience on LTF — waiting for the next inducement/entry trigger keeps us aligned with HTF strength.
