EURUSD| - BullishHTF (4H) Overview:
Price has established bullish structure. After a deep sweep of the SSL and mitigation within the 4H order block, the market has switched back to bullish. Currently, price is consolidating in a range.
MTF (30M) Setup:
Waiting for a break of the range from the sell side, with a tap into the 30M order block. Once that occurs, we’ll look for lower timeframe confirmation for a long entry.
Entry:
After lower timeframe structure confirms bullish continuation.
Targets:
• 5M highs for aggressive targets
• 30M highs for more conservative targets depending on market delivery
Mindset Note:
Patience and confirmation are key. Waiting for proper lower timeframe alignment increases the probability of a clean, smart entry in line with smart money flow.
Liquidity

USDCAD| - BullishHTF (4H/1H) Overview:
Price has shown strong bullish structure with clear momentum to the upside. This sets the stage for potential continuation plays into the week.
MTF (30M) Setup:
Price swept the SSL and landed within the internal framework structure of the area. Waiting for lower timeframe confirmation to ensure the spot holds before committing.
Entry:
After the lower high (LH) break and price retests back into the zone.
Targets:
• 5M highs for aggressive targets
• 30M highs for a more conservative approach depending on market delivery
Mindset Note:
Patience is key here. Let the lower timeframe structure confirm before taking the trade. Following the plan ensures alignment with smart money flow.

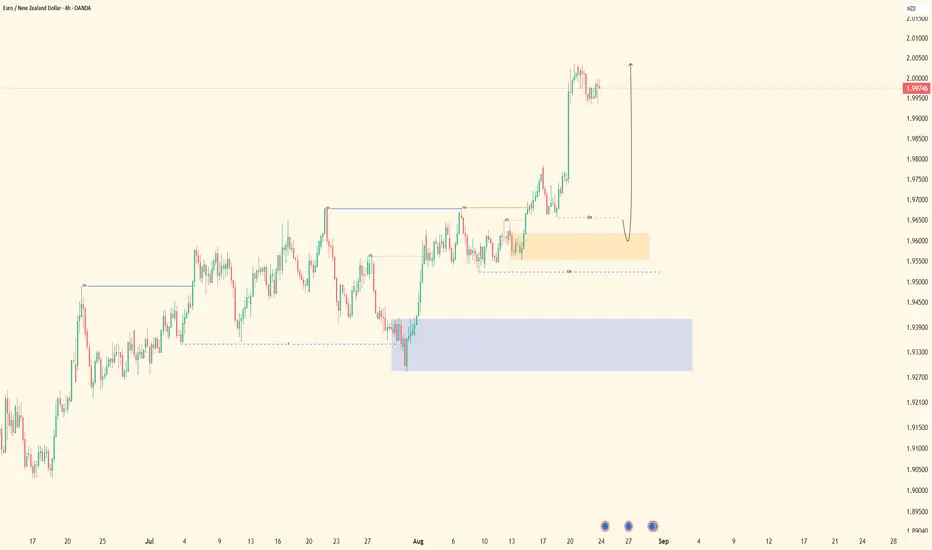
EURNZD| Bullish Structure With Continuation SetupPair: EURNZD
Bias: Bullish
HTF Overview (4H): External structure was broken to the upside with strong momentum, confirming bullish intent.
MTF Confirmation (30M): Anticipating continuation. Waiting for a sweep of sell-side liquidity into the area of interest. Once mitigation occurs, I’ll look to LTF confirmations for refined entry signals.
Entry Zone (5M): Entry planned after a lower high break and pullback confirmation.
Targets:
• TP1 = 5M highs
• TP2 = 30M highs (depending on market delivery)
Mindset Note: Strong momentum sets the tone, but the sweep provides the insurance — patience before execution.
NZDJPY| - Bearish Structure Into Fresh SupplyPair: NZDJPY
Bias: Bearish
HTF Overview (4H): Buy-side liquidity was taken into a supply area. Price then reversed, broke the HL, and printed a LL — confirming bearish intent on the higher timeframe.
MTF Confirmation (30M): Looking to anticipate the drop. Waiting for price to take out 30M BSL into fresh supply areas. Once mitigation occurs, I’ll be watching for LTF confirmations to refine entry.
Entry Zone (5M): Entry will follow only after LTF confirmation post-mitigation.
Targets:
• TP1 = 5M lows
• TP2 = 30M lows (depending on market delivery)
Mindset Note: Don’t chase the fall — let supply do its job, then execute with confirmation.

BTCUSD| - Bullish Structure & Continuation Setup
Pair: Bitcoin (BTCUSD)
Bias: Bullish
HTF Overview (4H): Bullish structure remains firm. Last week, price broke a major high cleanly, confirming upside intent. Current focus is on continuation toward fresh highs.
MTF Confirmation (30M): Structure refined. Sell-side liquidity was taken, and although internal structures broke, the major frame stayed intact. Price mitigated the refined level and has now switched bullish on the LTF. Waiting on a sweep to refine entry.
Entry Zone (5M): Entry will trigger after the sweep + pullback confirms direction on the lower timeframe.
Targets:
• TP1 = 5M highs
• TP2 = 30M highs (depending on market delivery)
Mindset Note: Trade within structure. Internal breaks don’t override the bigger picture bias — stay aligned with HTF intent.

AUDUSD| Bullish Structure RefinementPair: AUDUSD (AU)
Bias: Bullish
HTF Overview (4H): Bullish structure remains intact. Price has yet to mitigate the refined 4H OB, leaving room for continuation.
MTF Confirmation (30M): Price swept sell-side liquidity and mitigated the OB. A lower high has now broken, signaling intent. Waiting for a pullback sweep to refine long entries.
Entry Zone (5M): Entry will be executed after the sweep + pullback confirms direction on the lower timeframe.
Targets:
• TP1 = 5M highs
• TP2 = 30M highs (depending on market delivery)
Mindset Note: Confirmation first, execution second — let the sweep provide the edge.

XAUUSD| - Bullish Continuation From HTF OBPair: XAUUSD (Gold)
Bias: Bullish
HTF Overview (4H): Gold continues to print bullish structure. Previous weeks already mitigated higher timeframe OB, and price is now setting up for continuation toward the highs.
MTF Confirmation (30M): Anticipating the next buy run. Waiting for a deeper pullback into the 30M OB to catch discounted entries and ride toward premium highs.
Entry Zone (5M): Execution will come after 30M OB mitigation, with LTF confirmations to secure precision.
Targets:
• TP1 = 5M highs
• TP2 = 30M highs (depending on market delivery)
Mindset Note: Patience at discount is key — let price come to you before committing to the buy.

GJ| - Bullish Structure With Continuation PlayPair: GBPJPY (GJ)
Bias: Bullish
HTF Overview (4H): Bullish structure mapped with multiple highs spotted and broken, showing strong momentum to the upside.
LTF Confirmation (30M): Price aimed for continuation after the sweep, mitigating the 30M order block cleanly. Structure aligns with HTF bullish bias.
Entry Zone (5M): Waiting for lower timeframe confirmations to provide further insurance. Entry refined once micro structure breaks and retests.
Targets:
• TP1 = 5M highs
• TP2 = 30M highs (depending on market delivery)
Mindset Note: Trade the confirmation, not the impulse. Let the market show you insurance before execution.

UJ| - Bullish Structure in PlayPair: USDJPY (UJ)
Bias: Bullish
HTF Overview (4H): UJ continues to show bullish intent after breaking major structure to the upside. Price cleared previous highs and is now aiming for continuation toward new levels.
LTF Confirmation (30M): Spotted sell-side liquidity taken from last week’s order block, followed by a strong bullish move into major highs. This week, price created a fresh sweep into a new 30M order block, aligning with the higher timeframe bias.
Entry Zone (5M): Waiting on lower timeframe confirmation. Once a micro lower high is breached, I’ll look for a pullback into new sell-side liquidity for refined entry.
Targets:
• TP1 = Previous major high
• TP2 = Extended continuation above liquidity pools
Mindset Note: Patience pays. Let price confirm the bias, then execute with precision.

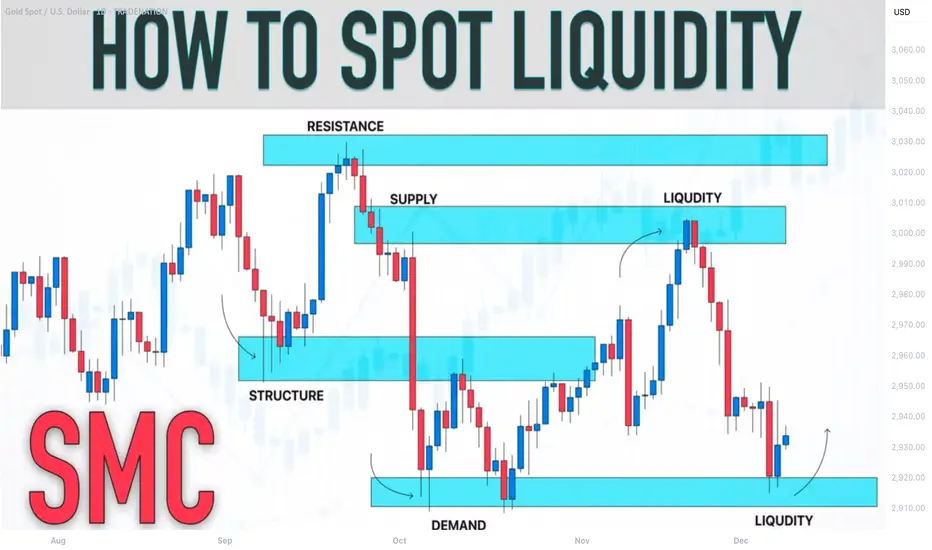
SMC Trading Basics. Liquidity Zones & How to Identify Them
In the today's article, I will teach you the concept of liquidity zones and how to identify them properly, trading Forex, Gold, Crypto and Indexes.
Simply put, a liquidity zone is a certain area on a price chart where a significant concentration of trading volumes occurred.
Huge trading volumes signify the presence of big players: hedge funds, banks, etc...
Correct identification of liquidity zones is essential for smart money trading, because such zones provide the safest and the most profitable trading opportunities.
There are 3 common characteristics of a valid liquidity zone:
1. Huge volume spikes upon its test
Take a look at the underlined blue area on USDCAD.
We see sharp volume spikes when the market was testing that area.
2. Strong rejections from such an area with a formation of long wicks
Look how the price reacts to the liquidity zone on USDJPY.
We see multiple strong rejections from that.
3. Long consolidation within that zone
Bitcoin was "standing" on a liquidity zone for more than 3 weeks, barely moving while trading volumes were quietly accumulating.
4. Multiple strong bullish or bearish reactions to that area
Just look how many times the underlined area was respected by the buyers and by the sellers. That is a perfect example of a liquidity zone.
To underline a liquidity zone properly, follow these simple rules:
1. If the price is ABOVE the liquidity zone, its lower boundary
will be the lowest wick within that area and its upper boundary will be the lowest candle close. Such a liquidity zone will be called a demand area.
Here is the example of drawing a liquidity zone on GBPUSD.
The lower boundary of the zone is the lowest wick, while its upper boundary is the lowest candle close.
2. If the price is BELOW the liquidity zone, its upper boundary will be the highest wick within that area and its lower boundary will be the highest candle close. Such a liquidity zone will be called a supply area.
Here is the liquidity zone that I identified on Gold following our rules.
Remember, that you can identify liquidity zones on any time frame. However, the rule is that the higher is the time frame, the stronger is the liquidity zone.
I prefer to analyze the liquidity zones on a daily time frame.
Once you underlined liquidity zones, you should realize that within these areas, big players are expected to place their orders in the future.
For that reason, after the tests of such areas, a strong bullish or bearish movements will be expected.
Here is a huge liquidity zone that I spotted on GBPJPY.
Look at a strong bearish movement that initiated after its test.
Your task as a smart money trader will be to identify bullish or bearish confirmations and understand the intentions of big players. With experience, you will learn to recognize valid signals.
❤️Please, support my work with like, thank you!❤️
I am part of Trade Nation's Influencer program and receive a monthly fee for using their TradingView charts in my analysis.
Trap Day Example – 12AM Bias, London Trap & New York Silver BullThis schematic illustrates how price action often sets up around key time windows and liquidity pools, independent of the actual news release.
• 12AM Candle Bias: The 12AM (NY) hourly candle often sets the directional framework for the day. A red candle can sometimes indicate the opposite bias (bullish) as liquidity is engineered around retail positioning.
• London Trap (1AM–5AM): Liquidity is typically built in the early session, where clean-looking structures entice traders to place stops just beyond obvious highs or lows. These stops become fuel later in the session.
• Reset Window (5AM–7AM): Price consolidates and repositions, chopping up retail orders. Patience here is essential.
• 7:38AM Liquidity Sweep: A sharp move often clears out positions, targeting extreme levels such as the 4th standard deviation (~68 pips in this example). This is not random — it’s part of the day’s liquidity cycle.
• 10AM Silver Bullet Zone: A major move frequently coincides with scheduled news events. However, the setup is often already “baked in” to the algorithms well before the announcement, providing a precise time/price confluence for high-probability trades.
Key Takeaway:
Markets are not driven by randomness. Time, liquidity, and structure work together to engineer traps and sweeps before directional moves unfold. By studying these repeatable cycles — from the London trap to the New York Silver Bullet — traders can better understand how the market truly operates.

Bitcoin - Can the bulls defend this support?Introduction
After reaching its all-time high, Bitcoin has faced strong rejection, falling from $124.5k down to $113k with notable bearish volume behind the move. On this downward path, several four-hour bearish Fair Value Gaps (FVGs) were left open, signaling areas of inefficiency that the market may look to revisit. At present, Bitcoin is testing a critical support zone formed by overlapping daily and four-hour FVGs. This support level is of particular importance because holding it could provide the foundation for renewed bullish momentum and a potential recovery in price action.
Bullish scenario
For the bullish case to unfold, Bitcoin must successfully maintain support in the $111.2k to $112.7k range, which represents the current four-hour FVG. This zone serves as a pivotal point where buyers need to defend price in order to keep upward potential intact. If the market stabilizes here, the next logical target will be the four-hour bearish FVG just above. In order to confirm strength, Bitcoin would need to close a clear four-hour candle above this resistance, effectively flipping it into support. Should that occur, it opens the door for price to climb toward the $120k region, a level that would reintroduce confidence among bulls and suggest that the broader trend could still have room for continuation.
Bearish scenario
On the other hand, the bearish scenario becomes more likely if Bitcoin fails to defend the $111.2k to $112.7k four-hour FVG and instead flips this zone into resistance. While a breakdown below this area would be concerning, there is still the possibility of a short-term bounce. In such a case, price could retrace back upward toward the bearish four-hour FVG at $114.7k before facing another critical test. If Bitcoin rejects strongly from that zone and subsequently breaks below $111.2k, the market could experience further downside pressure, potentially setting up a deeper correction. This would reinforce the dominance of the ongoing downtrend that has followed the rejection at the all-time high.
Final thoughts
Bitcoin remains in a pronounced downtrend after its sweep of the previous all-time high, yet it currently sits at a strong support level that offers a chance for recovery. The market’s reaction to this support area will play a decisive role in determining whether a rebound toward $120k is achievable or whether a deeper decline is imminent. The four-hour FVG around $114.7k stands out as a key battleground between bulls and bears. If buyers can reclaim and hold this level, momentum could shift back in their favor, but if sellers defend it and force price lower, the bearish trend is likely to persist.
-------------------------
Disclosure: I am part of Trade Nation's Influencer program and receive a monthly fee for using their TradingView charts in my analysis.
Thanks for your support. If you enjoyed this analysis, make sure to follow me so you don't miss the next one. And if you found it helpful, feel free to drop a like 👍 and leave a comment 💬, I’d love to hear your thoughts!

Bitcoin (BTCUSDT) – Smart Money Update🔔 Following our previous analysis predicting BTC drop to ~112k, we now update the market scenario using Smart Money & Price Action concepts.
📉 As expected, BTC entered a bearish phase after a Break of Structure (BOS) and distribution phase, currently approaching the key liquidity zone 108k–110k. This zone is a strong area for liquidity grab and institutional buy orders.
📌 Probable Scenario:
• BTC may touch 108k and then perform a corrective move to 113k–114k.
• A breakout above this range (e.g., towards 120k) is not guaranteed and requires reassessment of Price Action at that time.
🔑 Key Points (Smart Money Concepts):
• Liquidity below recent lows is still unfilled.
• The 108k–110k range acts as a higher timeframe Order Block.
• Pullback to 113k–114k could simply be a retracement to the Supply Zone.
📍 Summary:
Short-term: higher probability of BTC drop to 108k, followed by a limited recovery to 113k–114k. Further upside continuation or breakout needs reevaluation at that time.

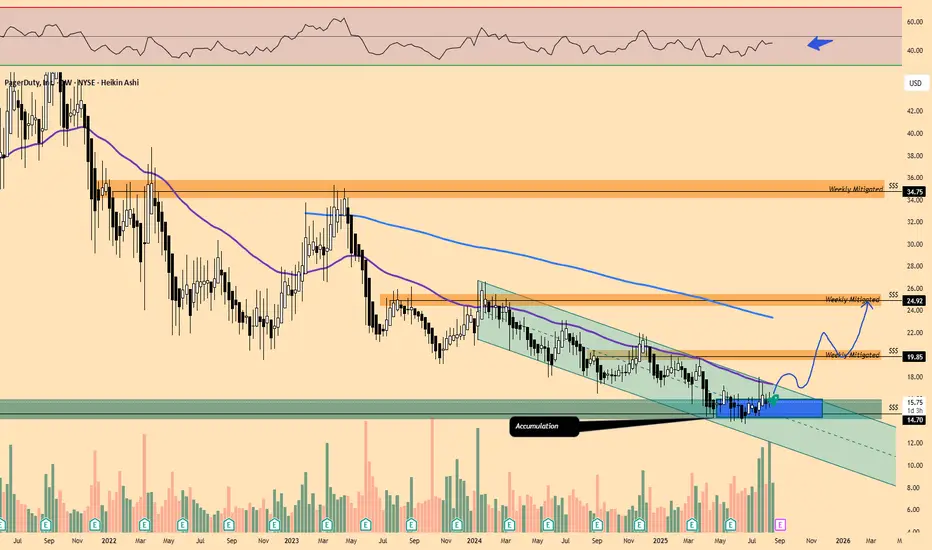
Small Cap Portfolio Trading | $PD ( PagerDuty ) Starting a new position to my #SmallCaps Stock Portfolio:
NYSE:PD (PagerDuty) @ $15.83 bringing my average cost to $15.83 per share.
Short Term Target: $25.00 / 40%+ Gain Potential
Financials:
- Last two years of Free Cash Flow Growth of 50%+ with a projection upwards
- Net income, despite being negative, has improved consistently over the last 3 years.
- Shareholders equity has remained constant over the 3 last years.
- Revenue growth has remained in an upwards trajectory over the last 5 years.
Note: Buying and placed my first order into the Weekly Demand level below 50 RSI and showing a little life in this accumulation box. Also liquidity has been swept in that area. We still have to clear $20.00 for this move to happen though.
A Shining Year for Gold: Geopolitical Risks and Economic DynamicThe year 2024 may be a bright year for gold, but it coincides with a period of increasing geopolitical risks. Global political and economic uncertainties, while unsettling investors, may boost demand for safe-haven assets such as gold.
Another notable feature of this year is the decline in inflation and interest rates. It is expected that inflation will be kept under control, and central banks will opt for interest rate cuts. The -0.75% interest rate reduction can be considered as part of efforts for economic recovery.
Gold has traditionally been a sought-after investment in environments characterized by low inflation and interest rates. Therefore, the anticipated interest rate cut in 2024 may support gold prices. However, the persistent presence of geopolitical risks remains another crucial factor influencing the value of gold.
Investors will carefully monitor the performance of gold in 2024, taking into account both geopolitical developments and economic indicators in this complex and dynamic environment. In the face of potential risks, a diversified investment strategy may provide a more secure position.
-------------------
When I look at the gold mining index, I see a very positive increase.
-------------------
The graph of gold in 12-6-3 month time frames gives very positive clues that the price will rise.
------------------
My Goals for 2024
- 2200
- 2500
- 2700

Nasdaq BSL SweepExpecting for BSL to be sweep... before the Sell continuation.
Waiting for #PPP entry model

Break of Structure VS Liquidity Grab. How to Identify Valid BoS
The main problem with break of structure trading is that you can easily confuse that with a liquidity grab.
But don't worry.
There is a secret SMC price model that will help you to confirm a break of structure in a second.
Learn smart money concepts trading secrets and a simple strategy to trade break of structure on any forex pair.
Let's study a break of structure that I spotted on AUDUSD forex pair.
We see that the market is bullish on a daily time frame and the price has just violated a previous high with a break of structure.
The issue with that is the fact that such a violation can easily be a liquidity grab and a bullish trap .
Buying the market immediately after a BoS, we can incur a huge loss .
We need something that would help us to accurate validate that.
Fortunately, there is a simple price model in SMC that will help.
After you spotted a break of structure on a daily time frame,
use a 4h time frame for its validation.
After a BoS on a daily time frame, the market usually starts retracing , setting a new local high.
To confirm that it is not a trap, you will need a break of THAT structure on a 4H time frame.
It will increase the probabilities that the entire bullish movement that you see on a daily is not a manipulation.
Here is what exactly we need.
After the price violated a daily structure and closed above that, we see a minor intraday retracement on a 4h time frame.
A bullish violation of the last high there is our BoS confirmation and a clear indicator of the strength of the buyers.
You can execute a buy trade, following a simple strategy then.
Set a buy limit order on a retest of a broken high on a 4H,
a stop loss should be below the last higher low,
a take profit is based on the next supply zone on a daily.
To avoid the traps, a single time frame is not enough for profitable trading break of structure.
Learn to integrate multiple time frames in smart money concepts trading. It will help you make thousands of pips weekly.
❤️Please, support my work with like, thank you!❤️
I am part of Trade Nation's Influencer program and receive a monthly fee for using their TradingView charts in my analysis.

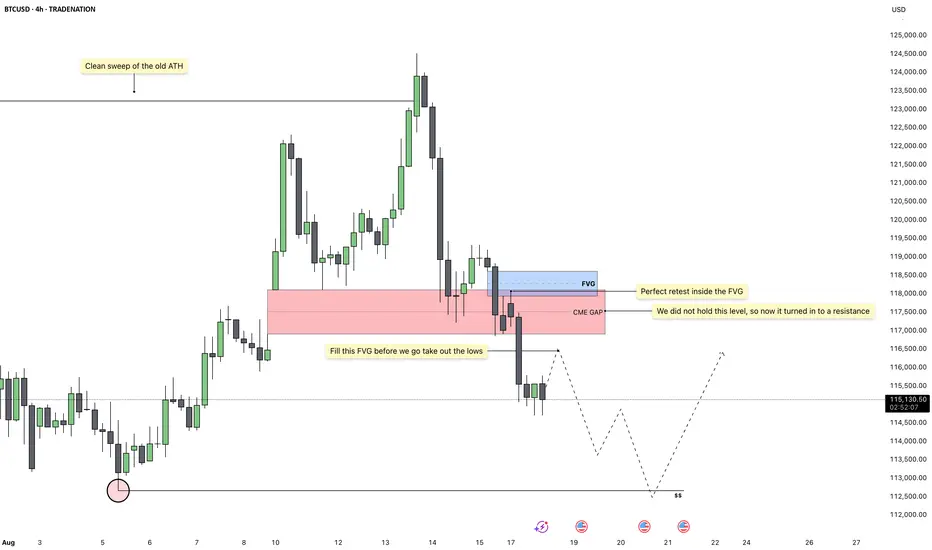
Bitcoin - Bears in Control, Lows AheadBitcoin has recently completed a clean sweep of the previous all time high, which has now given us strong bearish confirmation signals. After the sweep, the market rejected higher levels and failed to sustain bullish momentum, showing clear signs of distribution at the top. This shift in behavior suggests that buyers have lost control and sellers are now taking over.
Fair Value Gap Setup
Currently, price is sitting just below a fair value gap, which remains unfilled. These imbalances often attract price back before continuing in the prevailing direction, and in this case, that direction is down. A small retracement into the fair value gap above would be the ideal setup for a continuation lower.
Bearish Confirmation
The rejection after sweeping the highs and the subsequent breakdown beneath key support levels has created a bearish structure on the higher timeframe. The failed hold inside the fair value gap turned it into resistance, strengthening the case for lower prices. Each retest has been met with selling pressure, confirming that liquidity is now being delivered to the downside.
Liquidity Targets
Once the fair value gap above is filled, the next logical draw on liquidity sits below the current range. That means the lows are now exposed, and the cleanest target to expect price to reach is at 112k. The path of least resistance remains to the downside, as uncollected sell-side liquidity continues to build up beneath the market.
Trading Outlook
As long as Bitcoin continues to respect the newly formed resistance from the fair value gap, the bearish outlook remains intact. A retracement into the gap would likely offer the best entry for shorts, with the expectation that price will then seek out the lows. Only a convincing reclaim above the imbalance would threaten this bearish scenario.
Conclusion
The clean sweep of the old all time high has shifted market sentiment, and the subsequent bearish confirmations support the idea that the next major move is lower. I expect a slight retrace into the fair value gap before price makes its way down to the 112k liquidity pool.
Disclosure: I am part of Trade Nation's Influencer program and receive a monthly fee for using their TradingView charts in my analysis.
___________________________________
Thanks for your support!
If you found this idea helpful or learned something new, drop a like 👍 and leave a comment, I’d love to hear your thoughts! 🚀
Fueled to go north OANDA:XAUUSD Everyone who day trade based on my experience I could see that the market order flow is shifted to bullish order flow and the market hustled enough stop losses below from the traders who entered buy trades early. Use the supply zone conversion/transition to demand zones easily and take trades to North till the next liquidity pool.

GBPJPY: Bullish FVG Retracement Into LiquidityMarket Context
Current price: ~199.69
Market swept the Previous Day Low (PDL) and reacted bullish.
We now have a Break of Structure (BOS) to the upside, signaling strength.
Price is consolidating just above the BOS level.
📌 Bullish Idea
The plan is for price to pull back into the 1H demand/FVG zone you’ve highlighted (just above the PDL), then push up towards the liquidity resting above 200.300.
This makes sense because:
Liquidity is clearly sitting above that swing high.
Price already swept downside liquidity (PDL), giving fuel for an upward move.
BOS confirms buyers are in control.
✅ Strength of the Setup
PDL sweep + BOS -> classic bullish reversal sequence.
Fresh demand/FVG zone formed after the BOS.
Liquidity target above 200.300 gives a clean upside magnet.
Market structure = bullish -> higher probability play.
Things to Watch
If price breaks below the PDL again, the bullish idea becomes invalid.
A shallow retracement (not fully filling the FVG) could still lead to upside, so don’t wait for perfection.
Watch London/NY session GBPJPY moves aggressively during those times.
Execution Plan
Buy Entry: 199.20–199.30 (pullback into demand/FVG)
SL: Below 198.95 (below PDL & demand)
TP1: 200.00 (psychological round number)
TP2: 200.30+ (liquidity target)
Professional Take
This is a clean liquidity sweep -> BOS -> FVG retracement play. As long as PDL holds, the bias remains bullish. It’s the type of setup that works well on GBPJPY because of its volatility and liquidity runs.

What Is an Iceberg Order, and How May It Be Used in Trading?What Is an Iceberg Order, and How May It Be Used in Trading?
An iceberg order is a type of execution strategy that hides the full size of a trade by revealing only small portions at a time. Used by institutions and large traders, it helps reduce market impact. Understanding how iceberg orders work, where they’re used, and their risks can help traders more accurately analyse market activity. This article breaks down everything you need to know about iceberg orders and their role in trading.
What Is an Iceberg Order?
An iceberg order is a type of order designed to execute large trades without revealing the full size to the market. Instead of placing one massive position that could disrupt prices, traders split it into smaller portions, with the rest hidden. As each portion gets filled, the next one is placed automatically until the full order is executed.
The key feature of this type of entry is that only a fraction—known as the display quantity—is visible in the order book at any given time. The rest remains hidden until it’s gradually revealed. This prevents other traders from immediately recognising the true size of the position, which helps avoid unnecessary market movements.
For example, if a trader wants to buy 50,000 shares of a stock, placing the full position in the market at once could cause prices to rise before execution is complete. Instead, they might set an iceberg order with a display size of 5,000 shares. Once the first 5,000 are bought, another 5,000 are automatically placed, repeating until the full 50,000 are executed.
They’re particularly useful for institutional traders, hedge funds, and high-net-worth individuals who want to build or reduce positions without attracting attention. However, some retail traders also use them when executing relatively large trades in markets that support this execution type. Many major exchanges, including those for equities, forex, and futures, allow icebergs, but their availability depends on the broker and trading platform being used.
How Iceberg Orders Work
The main idea of iceberg orders is clear but let’s consider how they work in detail.
Order Execution Process
When a trader places an iceberg order, they specify two key parameters:
Total size – The full amount they want to buy or sell.
Display size – The portion that will be visible at any given time.
For example, if a trader wants to buy 20,000 shares but only wants 500 to be visible at a time, the order book will show just 500 shares. Once those are bought, another 500 will appear at the same price (if still available), and the cycle continues until the entire 20,000 shares are filled.
Dynamic Execution
Some trading platforms and institutional brokers use smart order execution algorithms to optimise how these orders are placed. These algorithms might adjust the display size dynamically based on market conditions, ensuring the order gets executed efficiently without drawing too much attention.
Hidden Portions and Order Book Activity
Although most of the order remains hidden, experienced traders and high-frequency algorithms can sometimes detect iceberg levels. If they notice an order constantly refreshing at the same price level without an obvious large sell or buy position, they may infer that an iceberg is in play.
Where Iceberg Orders Are Most Popular
They are most popular in liquid markets where frequent trading activity allows the hidden portions to be executed smoothly. In less liquid markets, there’s a higher risk that the order will be only partially filled or take longer to execute, making alternative execution strategies more practical.
Why Traders Use Iceberg Orders
Iceberg orders help traders hide their full intentions from the market. Here’s why they’re commonly used:
Reducing Market Impact
When a large position enters the market, it can shift prices before the full trade is completed. This is particularly an issue in less liquid markets, where even moderate positions can cause price swings. By splitting a large trade into smaller, hidden chunks, iceberg orders prevent sudden moves that could work against the trader.
Avoiding Slippage
Slippage occurs when an order is executed at a worse price than expected due to market movement. Large trades placed all at once can exhaust available liquidity at the best price levels, forcing later portions to be filled at less favourable prices. Iceberg orders help mitigate this by allowing the trade to be executed gradually without consuming too much liquidity at once.
Maintaining Discretion
Institutions and high-net-worth traders often prefer to keep their trading activity under the radar. If other market participants see a massive buy or sell entry, they may react by adjusting their own strategies, making it harder for the original trader to get a good price. Icebergs keep most of the position hidden, preventing this from happening.
Reducing the Risk of Front-Running
High-frequency trading firms and aggressive traders actively monitor the order book for large transactions. When they spot them, they may enter positions ahead of the large trade, pushing prices in an unfavourable direction. By keeping most of the trade hidden, iceberg entries make it harder for others to exploit this information.
Identifying Iceberg Orders in the Market
Iceberg orders are designed to be discreet, but experienced traders and algorithmic systems can sometimes detect them by analysing order book activity and price movements. Since only a small portion of the total order is visible at any given time, certain patterns can reveal the presence of an iceberg in action.
Order Book Clues
One of the most obvious signs is a persistent order at the same price level. If a bid or ask keeps refreshing with the same quantity after being partially filled, it may indicate that a much larger hidden position is sitting at an iceberg level. This is particularly noticeable in less liquid markets where large trades are more disruptive.
Another telltale sign is a large trade volume without corresponding large visible orders. If significant buying or selling occurs but the order book only displays small entries, there’s a chance that a hidden order is gradually being executed.
Time and Sales Analysis
Traders can also look at time and sales data, which records every transaction. If the same price level repeatedly absorbs multiple trades without depleting, it suggests a hidden order replenishing itself after each execution.
Algorithmic Detection
Some trading algorithms are specifically designed to identify icebergs. These tools scan for patterns in order execution and attempt to infer hidden liquidity. While not always accurate, they can give traders an idea of when institutional activity is taking place.
Risks and Limitations of Iceberg Orders
While iceberg orders can help traders execute large trades discreetly, they are not without drawbacks. Market conditions, execution risks, and the rise of advanced trading algorithms can all impact their effectiveness.
- Incomplete Execution: If market conditions change or liquidity dries up, part of the position may remain unfilled. This is especially problematic in volatile or low-volume markets where price movements can accelerate unexpectedly.
- Detection by Algorithms: Sophisticated trading algorithms actively scan for hidden orders. High-frequency traders (HFTs) may detect it and adjust their strategies, making it harder to execute at a favourable price.
- Increased Trading Costs: Splitting a large entry into multiple smaller ones can lead to higher transaction costs. Exchanges and brokers may charge fees per executed trade, meaning an iceberg entry could end up costing more than a single bulk position.
- Slower Execution in Fast Markets: When markets move quickly, the visible portions of an iceberg might not fill fast enough before the price changes. This can lead to slippage, where later parts of the order get executed at worse prices than intended.
- Limited Availability: Not all brokers or exchanges support icebergs, particularly in smaller or less liquid markets. Some platforms also impose minimum position size requirements, restricting their use for smaller traders.
The Bottom Line
Iceberg orders enable traders to execute large trades discreetly, minimising market impact and enhancing execution quality. While they offer advantages in managing liquidity, they also carry risks such as detection by advanced algorithms and potential slippage. Traders should exercise caution and conduct thorough market analysis.
FAQ
What Is an Iceberg Order?
An iceberg order is a type of order that splits a large trade into smaller visible portions, with the remaining size hidden from the order book. As each visible portion is filled, the next one is automatically placed until the full order is executed. This helps traders avoid moving the market or revealing their full position size.
How Do You Identify an Iceberg Order?
Traders can spot icebergs by looking for repeated small trades at the same price level. If an order keeps refreshing after partial fills without a visible large order in the book, it may indicate hidden liquidity. Time and sales data, as well as algorithmic tools, can help detect these patterns.
What Is the Difference Between an Iceberg Order and a Basket Order?
An iceberg order breaks a single large entry into smaller, hidden parts, while a basket order consists of multiple different trades executed together, often across various assets or instruments. Basket orders are used for portfolio adjustments, whereas iceberg entries focus on reducing market impact.
What Is an Iceberg Order in Crypto*?
In crypto* markets, iceberg entries function the same way as in traditional markets—hiding large trades to prevent price fluctuations. Many exchanges offer this feature, particularly for institutional traders handling large positions.
How Do I Place an Iceberg Order?
Availability depends on the broker or exchange. Traders typically set the total position size and the visible portion, allowing the system to execute the trade in smaller segments.
What Is the Iceberg Order Strategy?
The strategy involves using iceberg orders to accumulate or distribute large positions without drawing attention. It helps reduce slippage, maintain discretion, and avoid triggering unnecessary price movement.
*Important: At FXOpen UK, Cryptocurrency trading via CFDs is only available to our Professional clients. They are not available for trading by Retail clients. To find out more information about how this may affect you, please get in touch with our team.
This article represents the opinion of the Companies operating under the FXOpen brand only. It is not to be construed as an offer, solicitation, or recommendation with respect to products and services provided by the Companies operating under the FXOpen brand, nor is it to be considered financial advice.

GBPCADDate:
August 18, 2025
Session:
Asia Session
Pair:
GBPCAD
Bias:
Short
Liquid from last week lies it should sweep those pools
this week.
Entry:1.86448
Stop Loss:1.86761
Target:1.84527
RR:6.21

BTC| BULLISH
HTF Bias: Fresh mapping aligns bullish. Previous outlooks adjusted — that’s part of the craft, we flow with market structure. Strong upside momentum confirms intent.
MTF View: SSL has already been swept, but I’m anticipating a deeper dig into my 30M OB. That’s where my refined IFS (Internal Framework Structure) sits.
Execution Plan: Once that mitigation occurs, I’ll shift down to LTF for confirmation before executing continuation buys. Until then, patience. Let smart money handle the delivery.
Mindset Note: Traders who rush will miss the clarity. Precision waits, emotion chases.
