AUDUSD| BULLISHHTF Bias: Bullish. Higher timeframe shows clear bullish intent — deep sweep in order flow area sets the stage for mid-term continuation and further highs.
MTF Observation: Refined structure spotted with SSL confirmed. Sweep occurred, and last week’s order block has been mitigated.
Entry Plan: Waiting for lower timeframe confirmations to align with structure for optimal entries and continuation.
Mindset Note: Patience and precision over rushing setups. Let the market confirm, then execute.
Liquidity

EURUSD| BULLISHHTF Bias: Bullish. Higher timeframe structure is intact, showing strong bull momentum. Price has mitigated the 4H order block and is primed for multi-timeframe continuation.
MTF Observation: Waiting for SSL into POI and drive to mitigate the area 1.15600–1.15200.
Entry Plan: Once full mitigation occurs, drop to lower timeframes for directional shift and continuation entries.
Mindset Note: Patience is key — let bears play out until price gives the proper LTF shift. Precision over rush. Until then, we chill. ✌️

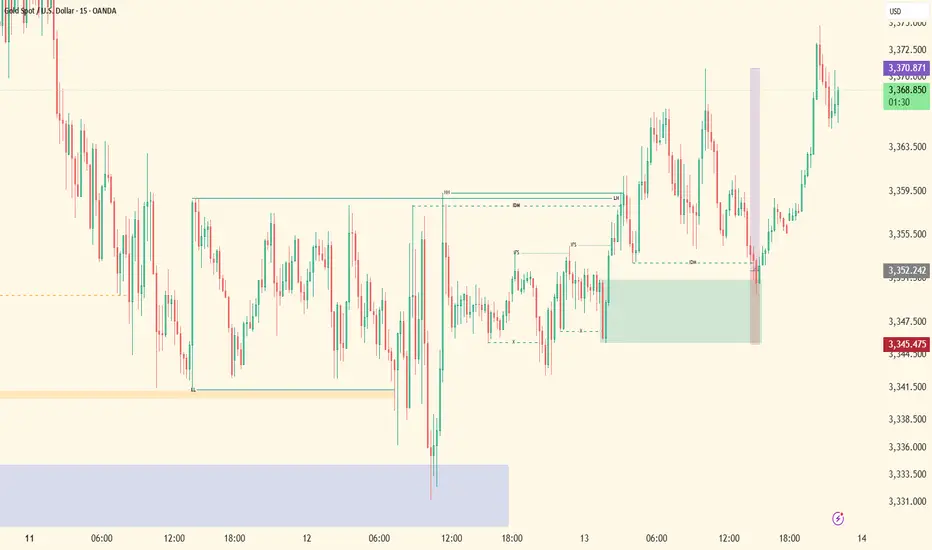
GOLD TARGETS BUY STOPSgold targets buy stops from a reclaimed breaker block. An imbalance fill is a very strong point of interest , the breaker block aligns with an imbalance, this combination has proven to be lethal so many times, watch out for it

NASDAQ| BULLISHHTF Bias: Bullish. Structure intact, bullish intent confirmed, previous highs broken to the upside. All bullish setups remain valid. Strong 4H levels holding; price pushing upward cleanly — past interventions not a concern.
MTF Observation: Deep liquidity formed on the sell side. We’re waiting for it to be taken out to mitigate order block areas between 23,500–23,400. Once sweep occurs, refined internal structure will align for bullish continuation.
Entry Plan: After order block mitigation, drop to lower timeframes for CHoCH confirmation and precision entry. Until then, we observe, follow price, and maintain patience.
Mindset Note: Play smart money. Stay disciplined. Hold your spot, let the market show the path, then execute with precision. Let’s go. 🚀

GOLD| BULLISHHTF Bias: Bullish. Higher timeframe shows clear bullish intent — structure was broken to the upside previously and now we’re watching for potential continuation buys.
30M Observation: Order block has already been mitigated last week, but price is retesting the area for bullish reinsurance. Refined structure spotted with a multi-timeframe sweep.
Entry Plan: Waiting for price to confirm trend change — breach minor LH and pullback — to align for continuation to the upside.
Key Levels: Break 3,350+ for next bullish leg; watch pullback for optimal entry.
Mindset Note: Precision > rush. Wait for confirmations and structure before committing. Bulls are in the room; patience pays.

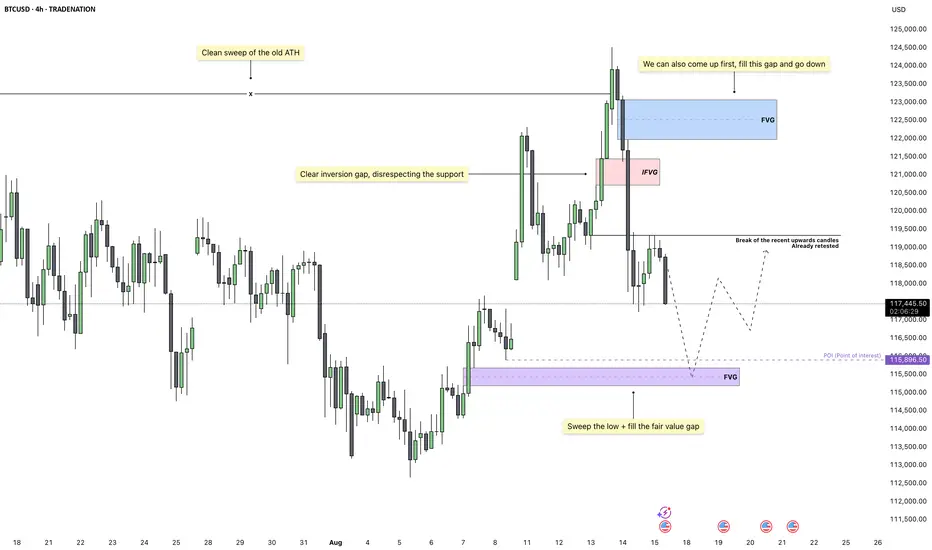
Bitcoin – Momentum Turns Bearish After Topside SweepBitcoin has just completed a clean sweep of the old all-time high, which served as a major liquidity grab. This move has cleared out buy-side liquidity at the very top, creating the perfect environment for a shift in momentum. Price action shows a clear rejection after the sweep, suggesting that the market may now be poised to reach for sell-side liquidity.
Inversion Structure and CISD
On the 4H timeframe, we have a well-defined inversion fair value gap forming immediately after the high was taken. This aligns with the CISD concept, as the liquidity sweep at the top acted as inducement before a sharp displacement to the downside. The CISD level has already been retested, confirming the shift in structure and reducing the likelihood of another deep revisit before the next leg down.
Bearish Pathway
From here, price could either continue to slide directly or first pull back into a nearby imbalance before continuing lower. Both scenarios favor the downside, as the order flow remains bearish after the displacement. A further push down is likely to aim for sell-side liquidity resting below the recent swing low.
Key Downside Objective
The primary target sits at the confluence of a marked liquidity pool and a lower fair value gap. This is a high-probability area for price to react, as it combines the sweep of the recent low with a fill of unmitigated inefficiency. Once that zone is reached, we can reassess for potential reversals or continuation patterns.
Expectation
The market has already shown its intent by taking the highest liquidity first, shifting structure, and respecting the CISD framework. Unless the upside imbalance is filled in a deeper retrace, the path of least resistance remains lower toward the highlighted fair value gap.
Conclusion
With liquidity above already cleared and the CISD retested, the focus now shifts to the liquidity resting below. The alignment between structure, inefficiency, and liquidity targets supports a bearish continuation into the marked zone before any meaningful bounce.
Disclosure: I am part of Trade Nation's Influencer program and receive a monthly fee for using their TradingView charts in my analysis.
___________________________________
Thanks for your support!
If you found this idea helpful or learned something new, drop a like 👍 and leave a comment, I’d love to hear your thoughts! 🚀
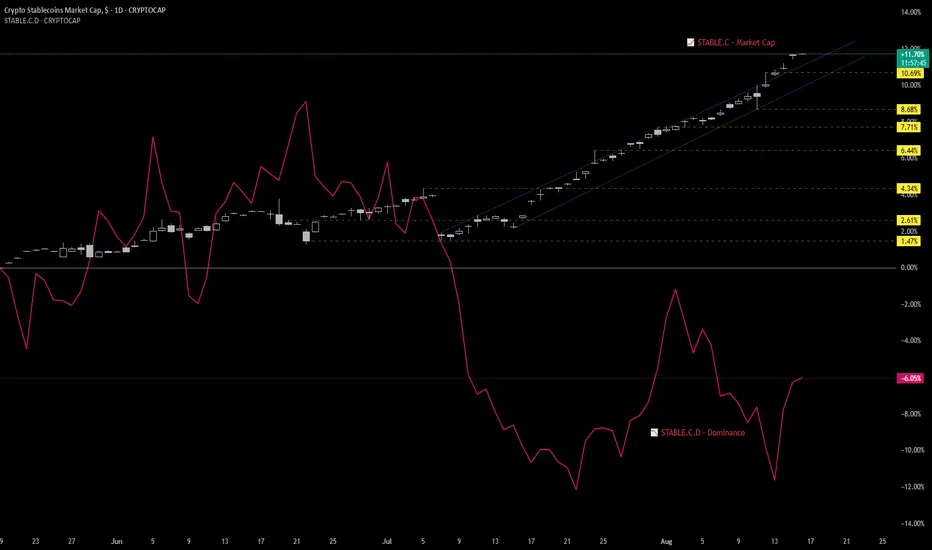
Stablecoins as the New Macro Liquidity ProxyFor years, macro liquidity in crypto was gauged through broad monetary metrics like M2 or Total Market Cap. But those days are fading.
With the rise of regulated stablecoins—and new TradingView tickers like CRYPTOCAP:STABLE.C (Stablecoin Market Cap) and CRYPTOCAP:STABLE.C.D (Stablecoin Dominance)—we now have real-time, on-chain liquidity metrics that better reflect how institutional and retail capital enters the crypto ecosystem.
🔑 Why These Tickers Matter
• STABLE.C = Capital injection.
→ Tracks aggregate growth of major stablecoins, serving as a proxy for dry powder entering the system.
• STABLE.C.D = Sentiment signal.
→ Measures stablecoin dominance relative to the crypto market.
→ Rising dominance = risk-off (capital parked).
→ Falling dominance = risk-on (capital deploying).
Together, they offer a macro lens on risk appetite and capital inflow , updated in real-time—something no traditional metric can match.
🔍 How We Use Them
These metrics are now integrated into our Crypto Macro Cockpit , where:
• Stablecoin cap growth signals liquidity expansion or contraction
• Dominance slope helps identify regime shifts (risk-on vs risk-off)
We're beginning to see consistent patterns:
➤ Surges in STABLE.C precede market rallies
➤ Spikes in STABLE.C.D often align with rotation tops or periods of caution
📎 Implication
Stablecoins are no longer just trading tools—they’re macro indicators.
If ETFs are the Trojan horse for institutional entry, stablecoins are the bloodstream.
As we transition into a new cycle, these tickers might become the most important charts you’re not watching.
💬 Would love to hear from others—are you using STABLE.C or STABLE.C.D in your analysis? What signals are you seeing?
"BTC at Critical Reversal Zone – Watch This Key Liquidity Trap
"BTC at Critical Reversal Zone – Watch This Key Liquidity Trap 🎯"
Market Structure Overview
BOS (Break of Structure): Multiple BOS points indicate shifts in trend phases, first to the downside (end of July to early August) and then back to the upside.
BOL (Break of Low): This marked a key liquidity grab before the reversal rally began.
Liquidity Zones: The chart highlights both sell-side liquidity (below lows) and buy-side liquidity (above highs), showing where institutional traders hunt stops.
2. Key Supply & Demand Zones
Support Zone (112,500 – 114,500): This level acted as a demand base after the liquidity sweep in early August. Price reacted strongly here, triggering the bullish leg.
Previous Resistance (121,500 – 122,500): This zone has capped price multiple times, making it a critical area for sellers to defend.
3. Current Trade Setup
Entry Zone: Around 120,000 – 120,400, where a short setup is triggered upon rejection.
Stop Loss: Above 122,120, just beyond the resistance to avoid premature stop-outs.
Target: 116,500 – aligning with prior liquidity pools and structural support.
4. Educational Takeaways
Liquidity Hunts: Notice how price often spikes into liquidity pools before reversing—this is common in BTC’s volatile environment.
Confluence Trading: The short setup aligns with resistance retest + liquidity grab + BOS, increasing probability.
Risk Management: Using defined zones for stop loss and target helps maintain a favorable risk/reward ratio.
Summary:
BTC is currently respecting the higher-timeframe resistance zone, with a clear short-term bearish setup in play. A rejection from the entry zone could trigger a drop toward the 116,500 target. Traders should monitor price action closely and avoid chasing entries—patience and precision are key.

EURUSD – Climbing for Liquidity, Then What?EURUSD continues to move within a well-defined ascending channel, respecting both the upper and lower trendlines. After the recent rejection from the lower boundary, price found support inside a fair value gap, triggering a strong bullish reaction. This bounce has maintained the overall bullish structure, keeping the uptrend intact for now.
Fair Value Gap Retest
The fair value gap retest provided a clean entry for buyers, confirming demand at that level. This reaction reinforced the idea that liquidity was likely collected from the lows, giving the market fuel to push higher toward key resistance levels.
Short-Term Bullish Path
From here, price is approaching a major liquidity area above recent highs. This level may act as a magnet, drawing price upward for a sweep of buy-side liquidity. A continuation beyond that could result in a direct test of the upper trendline.
Potential Bearish Reversal Setup
If the upper boundary of the channel is reached, the reaction there will be critical. A sharp rejection from that area could trigger a deeper retracement, potentially driving price back toward the mid-range or even retesting the lower trendline. A liquidity sweep followed by bearish displacement would confirm this shift.
Key Scenarios Ahead
There are two primary outcomes to watch. First, price could sweep the current high and reverse lower, respecting the channel structure. Second, price could break through, reach the upper trendline, and then roll over for a larger corrective move. In both cases, the reaction after liquidity is taken will define the next directional leg.
Conclusion
At this stage, EURUSD is in a controlled uptrend, but the next high-probability move depends on how price behaves around the key liquidity level above. The plan is to monitor for either a sweep and rejection or a push to the upper trendline for a potential reversal.
Disclosure: I am part of Trade Nation's Influencer program and receive a monthly fee for using their TradingView charts in my analysis.
___________________________________
Thanks for your support!
If you found this idea helpful or learned something new, drop a like 👍 and leave a comment, I’d love to hear your thoughts! 🚀

13.08 2025 TARGET DONEAs I was typing yesterday about my target for the BTC price I don't have to wait long for it and the price make it happen very quick and now we have a clear pattern, so are now is time to short this market?. After yesterday I see a big potential for the price to go lower but also we can go higher because we have fuel to go higher.

GU|HTF LH Sweep + Waiting for Demand Zone Mitigation
Bias: Bullish from refined micro OB demand zone
HTF Overview: Price has swept highs aligning with a higher timeframe lower high, yet without a decisive candle break to confirm further downside continuation.
LTF Confluence: Price is seeking extra confirmation by mitigating into my refined micro OB demand zone.
Key Levels:
• Sweep watch: 1.33997
• Buy Block: 1.33612 – 1.33461
Execution Plan: Waiting for liquidity sweep into the buy block before engaging in longs. Precision entry only — patience remains the edge.

XAUUSD| Textbook CHoch + SSL Sweep + OB Mitigation + TP SmashBias: Bullish on LTF after liquidity sweep
Pair: Gold (XAUUSD)
HTF Overview: Price maintained bullish flow, with prior session’s sell-side liquidity resting beneath recent 5M structure lows.
LTF Confirmation: On the 5M chart, price delivered a clean CHoCH, sweeping SSL and tapping directly into a refined order block.
Entry Zone: OB at the sweep level, aligned with execution criteria.
Trade Execution:
• 5M CHoCH confirmed
• SSL swept clean
• OB mitigated → instant reaction
• Entered in full trader/execution mode
Targets: Took TP1 and TP2 following 5M structure; clean continuation until liquidity above was cleared.
Mindset Note: Patience before execution was key — I waited for the exact confluence to hit before acting. Precision beats impulse every time.
EURUSD Technical Analysis (Educational Breakdown) EURUSD Technical Analysis (Educational Breakdown)
1. Market Structure Overview
The chart shows a clear downtrend phase that started after failing to break the major resistance around 1.1780 – 1.1820.
Price formed lower highs and eventually broke below a rising trendline, signaling a shift from bullish momentum to bearish control.
Recent movement shows a retracement toward a defined entry zone, suggesting a short-term pullback opportunity.
2. Key Levels
Resistance Zone (1.1780 – 1.1820): This area has acted as a strong supply zone in the past, rejecting bullish attempts and triggering heavy sell-offs.
Support Zone (1.1340 – 1.1380): A key demand area where previous reversals took place.
Current Entry Zone: Between 1.1697 – 1.1750, aligning with a minor resistance zone and previous supply reaction.
3. Price Action Insights
Fair Value Gap (FVG) identified earlier near 1.1700 served as a reaction zone before a push downward.
The price is now revisiting an area near the previous imbalance, which aligns with a confluence of resistance and short-term overbought conditions.
If price action rejects the entry zone, a bearish swing toward 1.1534 is likely.
4. Trade Setup Idea (Short Bias)
Entry: 1.1697 – 1.1750 (retest of broken structure).
Stop Loss: Above 1.1772 to avoid stop hunts beyond resistance.
Target: First take profit at 1.1534; extended target toward 1.1400 if bearish momentum persists.
5. Risk Management & Educational Note
This setup is based on supply & demand principles plus market structure shifts.
Always confirm entries with lower-timeframe rejection patterns before executing.
Protect capital with a maximum of 1–2% risk per trade and adjust lot sizes accordingly.
📌 Summary:
EURUSD is currently testing a high-probability short zone after a structural breakdown. If rejection occurs, sellers could push price toward mid-range support at 1.1534, and potentially deeper toward the 1.1400 zone. However, if bulls manage to reclaim and close above 1.1780, this bearish view becomes invalid.

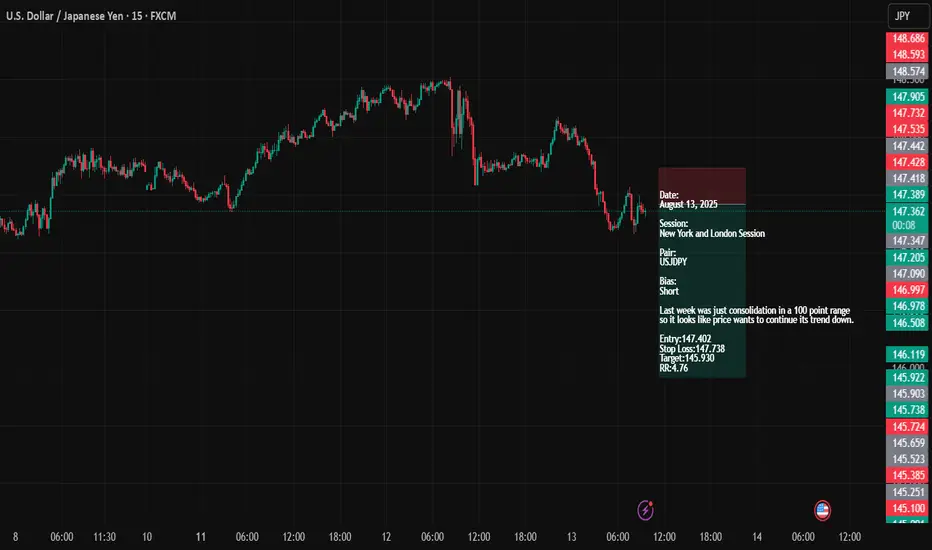
USDJPYDate:
August 13, 2025
Session:
New York and London Session
Pair:
USJDPY
Bias:
Short
Last week was just consolidation in a 100 point range
so it looks like price wants to continue its trend down.
Entry:147.402
Stop Loss:147.738
Target:145.930
RR:4.76
Up to $5 - DOT weekly update August 13 - 19thWe are currently in Minor Wave 5 and Intermediate Wave 1, with the broader Primary Cycle forming a Wave 3. Once Intermediate Wave 1 is complete, I anticipate a larger corrective move toward the 0.618 Fibonacci retracement level, or potentially deeper.
The liquidation heatmap reveals limited liquidity slightly above the current price, but a substantial concentration below it—liquidity that is likely to be targeted during the formation of Wave 2. The order book further indicates some resting orders at the 1.0 Fibonacci extension level and a significantly larger cluster at the 1.618 extension level.
Funding rates remain moderately positive, and open interest is steadily increasing, suggesting a stable upward trend. This also implies that market sentiment has not yet reached excessive euphoria and that risk appetite remains relatively contained.
In summary, the confluence of liquidity positioning, derivatives data, and Elliott Wave structure leads me to favor a primary scenario in which prices reach the 1.618 extension level of Minor Wave 5, encountering both the psychological $5.00 mark and a prominent sell wall. This confluence is expected to trigger the onset of Wave 2.

AU| Bullish Setup4H price action has been crazy choppy, stuck in a messy range — but I refined and mapped it out.
The 4H high at 0.65533 was broken, price continued higher, then pulled back into my 4H professional order flow area for mitigation.
From there, I dropped to the LTF to plan continuation for the week. I’m watching for liquidity to be swept around 0.64892 and a tap into the OB just below.
Once that happens, I’ll wait for further confirmations before flipping into full execution mode.
Patience first, execution second.

BTC| - Bullish
HTF shows strong bullish momentum, giving clear buy intent for continuation.
Major Levels:
• HTF high: 111,965
• Internal framework high: 110,581
• Sweep level: 105,127
LTF is setting up for a pullback continuation — the classic play after a liquidity sweep into the OB at 115,910.
Once that sweep and mitigation happen, we’re on go after lower timeframe confirmation.
Targets will be the 5M highs or 30M highs depending on how price delivers. 📦

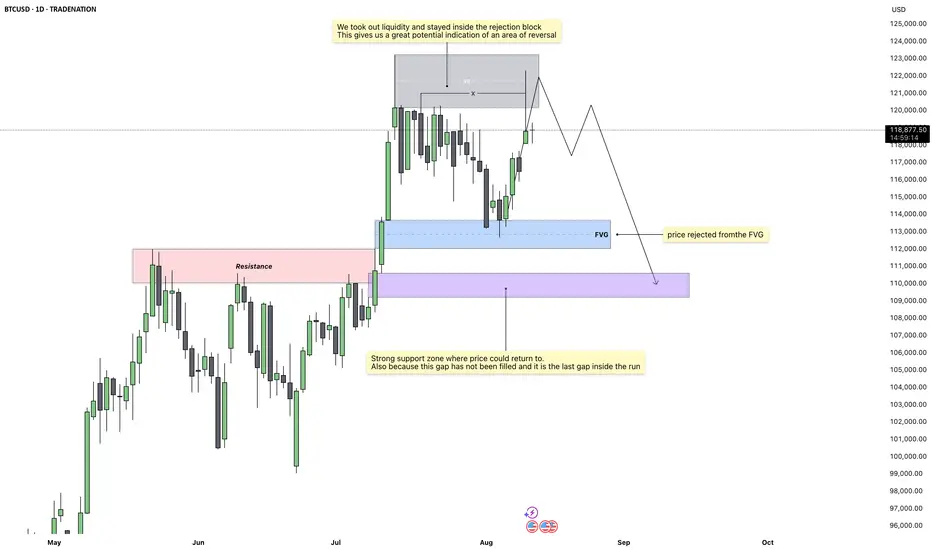
Bitcoin – The Last Stop Before the DropMarket Overview
Price action on the daily chart has shown a decisive move into a key rejection block after taking out recent liquidity. This is a classic sign of exhaustion in the current move, suggesting that momentum may now begin to shift in the opposite direction. The daily close reinforced this idea, showing a clear respect for higher-timeframe resistance levels.
Rejection Block Context
The 4H and daily rejection blocks have aligned, creating a strong confluence zone where sellers have stepped in before. Price did not just test this area, it closed within it, which often indicates a high probability of reversal. This setup builds confidence that the market could be preparing for a retracement.
Liquidity Sweep Confirmation
Before the rejection occurred, price ran through a cluster of resting liquidity above recent highs. This liquidity grab often acts as the fuel for a reversal, as it traps late buyers and allows larger players to shift price in the opposite direction.
Fair Value Gap Target
Below current price, there remains an unfilled gap which is the final gap inside the current run. Historical price behavior shows that such gaps tend to get filled before a fresh move can develop. This unfilled zone provides a clear downside target.
Bearish Scenario
If the rejection holds, I expect price to work its way lower toward the 110k range, filling that remaining gap before any sustained bullish move can resume.
Conclusion
With liquidity taken, a clean rejection from higher-timeframe resistance, and an untouched gap below, the chart is aligning for a potential retracement. I am watching for continued weakness to confirm the move toward the 110k region.
Disclosure: I am part of Trade Nation's Influencer program and receive a monthly fee for using their TradingView charts in my analysis.
___________________________________
Thanks for your support!
If you found this idea helpful or learned something new, drop a like 👍 and leave a comment, I’d love to hear your thoughts! 🚀
GBPUSDate:
August 13, 2025
Session:
Sydney and Tokyo Session
Pair:
GBPUSD
Bias:
Short
A lot of unswept liquid from last week lies.
I think price will be sweeping it this week.
Entry:1.35051
Stop Loss:1.35355
Target:1.34043
RR:3.35

NASDAQ 100| Bullish OutlookHTF (4H)
Price has broken major external structure highs, currently trading near the 23,712 zone with strong bullish momentum. My focus is on buying opportunities after a clean pullback — ideally sweeping sell-side liquidity into the 4H OB. Price action is being monitored closely for confirmation.
LTF (30M/5M)
Structure remains clean and respected. I’m watching for a liquidity sweep into the 23,444 – 23,399 OB zone.
Execution Plan
Targeting 5M highs for intraday delivery or 30M highs if momentum extends. Trade will be managed in alignment with internal framework structure and market delivery behavior.

Extreme greed - LINK weekly update August 12 - 18thFrom an Elliott Wave perspective, Chainlink is currently in Minor degree Wave 5 within Intermediate degree Wave 3. On a broader scale, LINK has completed a 1–2 structure at both the Primary and Intermediate degrees, similar to many other altcoins I have analysed recently, and is now advancing as part of Cycle degree Wave 1.
Liquidity positioning shows a substantial build-up below current price. The recent impulsive rally was largely driven by a short squeeze, as many traders opened short positions during Wave 4 and were subsequently liquidated. The order book also shows heavy order clusters above price, aligning closely with the key Fibonacci extension levels.
Funding rates, however, paint a more cautionary picture. They are currently at extremely high positive levels, while open interest has spiked sharply — suggesting that this leg higher is standing on shaky ground. Such conditions often precede volatility spikes or corrective pullbacks. Additionally, momentum indicators like the RSI are showing overbought conditions.
Given the current structure and liquidity alignment, the 1.618 Fibonacci extension remains my preferred target for the completion of this Minor Wave 5, as it coincides with a significant concentration of orders and fits the overall Elliott Wave projection. That said, the combination of overheated funding rates, elevated open interest, and extreme momentum readings warrants high caution for traders.
As always — do your own research, and trade safe.

$200 soon - SOL weekly update August 12 - 18thFrom an Elliott Wave perspective, the scenario for Solana has been slightly adjusted from previous counts. Current price action suggests that SOL is already in an impulsive upward move, which aligns well with the broader correlation observed across the altcoin market. As with many other altcoins, the structure shows a completed 1–2 sequence at the Primary degree and another 1–2 sequence at the Intermediate degree. At the Minor degree, price is in the final stages of Wave 1, specifically in Minute Wave 5.
An alternative scenario — less likely but still possible — is that the move is actually a corrective structure, with the Minor degree currently forming Wave C. This would become more probable if price extends significantly beyond the 1.618 Fibonacci extension, as such behaviour would be atypical for a standard fifth wave.
From a liquidity standpoint, short- to medium-term bias points upward. The liquidity heatmap shows a large concentration of liquidity at the local high of Wave 3, as well as significant order clusters near the 1.0 extension target for the current Wave 5. However, substantial liquidity is also accumulating below current price, which will likely be targeted during the subsequent Wave 2 retracement.
Funding rates have shifted from slightly negative toward positive territory, and open interest is climbing — both signs of a stable and sustained upward move.
Macro conditions also support the current market tone. The latest CPI data came in at 2.7%, better than expected, boosting sentiment. As the FOMC meeting approaches, retail traders are increasingly positioning for a potential “altseason” — a dynamic that raises the probability of a sell-the-news event if expectations are overextended.
Given the current wave structure, liquidity positioning, and macro backdrop, the 1.0 Fibonacci extension level has been set as the primary target for the completion of this Minor Wave 5. This area aligns with heavy order clustering and fits the typical profile for a fifth wave termination before a corrective phase.
Do your own research — and trade safe.

EURUSD SELL BIASPrice action has maintained a bullish structure since the beginning of the year. However, recent failure to break above the June high, coupled with the formation of lower highs and lower lows, suggests a potential bearish reversal. My final target is positioned at 1.15164, with the ultimate take-profit level set at 1.13914.
