LTC: Breakout Before Altcoin SeasonPrice has been moving inside a large 3‑month symmetrical triangle, with lower highs from the 2017 peak and higher lows since the 2018 bottom.
The current candle is compressing between the support and resistance trendlines, suggesting a larger move is getting closer.
A confirmed breakout above the triangle resistance and the 0.5–0.618 Fib would open the way toward the marked profit zone in the 0.65–0.786 area (~185–255 USD), where previous supply sits.
As long as the higher‑low structure holds, the bias remains bullish; a clean weekly/3M close back below the triangle support would invalidate this idea and shift the focus back toward the 40–50 USD zone.
Litecoin often behaves as a “mid‑cap beta play” between Bitcoin and smaller alts: when BTC stabilizes and capital starts rotating out along the risk curve, LTC is one of the first large caps to wake up. A strong, high‑timeframe breakout on Litecoin can therefore be an early sign that market participants are ready to take more risk, paving the way for a broader altcoin season.
Litecoin (Cryptocurrency)

LTCUSD H4 | Bearish ContinuationMomentum: Bearish
Price may retrace to the sell entry, which aligns with the 38.2% Fibonacci retracement, adding significant strength to this level.
Sell Entry: 79.61
Pullback resistance
38.2% Fibonacci retracement
Stop Loss: 86.49
Pullback resistance
Take Profit: 71.03
Pullback support
High Risk Investment Warning
Stratos Markets Limited (tradu.com ), Stratos Europe Ltd (tradu.com ):
CFDs are complex instruments and come with a high risk of losing money rapidly due to leverage. 70% of retail investor accounts lose money when trading CFDs with this provider. You should consider whether you understand how CFDs work and whether you can afford to take the high risk of losing your money.
Stratos Global LLC (tradu.com ): Losses can exceed deposits.
Please be advised that the information presented on TradingView is provided to Tradu (‘Company’, ‘we’) by a third-party provider (‘TFA Global Pte Ltd’). Please be reminded that you are solely responsible for the trading decisions on your account. Any information and/or content is intended entirely for research, educational and informational purposes only and does not constitute investment or consultation advice or investment strategy. The information is not tailored to the investment needs of any specific person and therefore does not involve a consideration of any of the investment objectives, financial situation or needs of any viewer that may receive it. Past performance is not a reliable indicator of future results. Actual results may differ materially from those anticipated in forward-looking or past performance statements. We assume no liability as to the accuracy or completeness of any of the information and/or content provided herein and the Company cannot be held responsible for any omission, mistake nor for any loss or damage including without limitation to any loss of profit which may arise from reliance on any information supplied by TFA Global Pte Ltd.

ETH/USDT | Another try to be bullish? (READ THE CAPTION)As you can see in the Daily chart of ETHUSDT, it went through the supply zone and got rejected there. I expect a fall to the Bullish OB in 2630-2874 zone and then a reaction back to the supply zone to challenge it once more. If it fails to show a reaction and go up after reaching the Bullish OB, I expect a drop to 2117-2328 Demand zone.
Make sure to leave a comment and like the analysis in order to make me motivated to bring you analysis everyday.
Sincerely, Amirali

SOL/USDT | a drop before going bullish again? (READ THE CAPTION)As you can see, SOLUSDT is now consolidating in the main demand zone after a rise to $146 now is trading at 131.50 level. If buyers fail to keep SOL in the demand zone, a further fall is expected to $105 bullish zone, before it regains its bullish momentum with accumulating more liquidity and then goes up high again.
Make sure to like and comment to keep me motivated folks.

BTC/USDT | a major drop incoming? (READ THE CAPTION)By examining the Daily chart of BTCUSDT, we can see that price has failed to break the 4H FVG at $94000 and has dropped twice from that zone. I expect another try to break through that FVG, but I expect BTC to drop from that zone again and maybe all the way to the bullish OB that is shown in the chart.
If BTC fails to hold above $90000, I expect a drop.

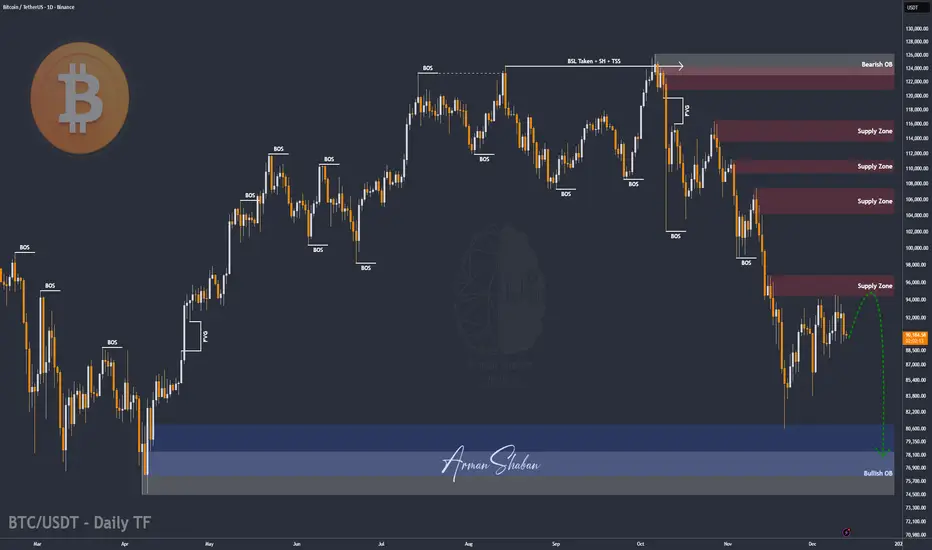
BTC/USDT | Hold 90K or Prepare for a Heavy Flush? Let's See!CRYPTOCAP:BTC pushed into $94,700, tapped the target perfectly, and then slipped into a sharp correction. Right now Bitcoin is trading around $90,000, and the entire market is focused on a single decision level. If BTC can stabilize above $90,000 within the next 24 hours, the bullish structure stays alive and we can look for a continuation toward $97,000 and then $100,000.
If BTC fails to hold $90,000, the door opens for a deeper decline and the first downside target becomes the $78,000 demand zone. This is the point where the next major direction gets decided.
Please support me with your likes and comments to motivate me to share more analysis with you and share your opinion about the possible trend of this chart with me !
Best Regards , Arman Shaban
LTC/USDT | LTC Drops Hard but the Real Opportunity Might Be AheaCRYPTOCAP:LTC rallied all the way to $113 before getting slammed with a heavy correction, dropping more than 34% down to $75. Right now Litecoin is trading near $81 and the momentum is still clearly bearish. As long as this pressure continues, I expect a deeper correction toward the $63 to $70 demand zone.
This is the area that really matters for the next major move. If Litecoin reaches this zone and shows a clean bullish reaction, it becomes a high-interest region for a strong mid-term reversal. A proper reaction here can easily trigger a 100%+ upside move in the coming weeks or months.
For now I’m watching to see how price behaves as it approaches $63 to $70 because that’s where the next big opportunity is likely to form.
Please support me with your likes and comments to motivate me to share more analysis with you and share your opinion about the possible trend of this chart with me !
Best Regards , Arman Shaban

SOL/USDT | Solana Is Testing Buyers Right Now, Pump or Dump?CRYPTOCAP:SOL rallied all the way to $146 before pulling back again and right now price is trading near $132. The correction is completely normal and the main demand zone sits between $122 to $132 which is exactly where Solana is reacting at the moment. This is the zone that needs to hold because losing it would open the door for a deeper drop.
If buyers fail to defend the current range there is still a clean lower demand area around $105 where I expect stronger accumulation and a possible start of the next bullish leg. For now I am watching to see if SOL stabilizes inside the $122 to $132 zone because a proper hold there usually leads to another upward push.
Please support me with your likes and comments to motivate me to share more analysis with you and share your opinion about the possible trend of this chart with me !
Best Regards , Arman Shaban

ADA/USDT | Cardano Pulls Back After the Rally! What's Next?CRYPTOCAP:ADA pushed all the way to $0.485 before getting hit with a sharp correction and right now price is trading near $0.40 which is roughly a sixteen percent drop from the recent high. Nothing major has changed in the broader structure because the key zone has always been the $0.32 to $0.36 demand range. If ADA drops into that area again I expect a fresh wave of buyers to step in just like the previous reactions.
For now I want to see if momentum cools down a bit more and whether ADA will revisit the deeper demand levels. That is still the zone where the next strong bullish leg can start building again.
Please support me with your likes and comments to motivate me to share more analysis with you and share your opinion about the possible trend of this chart with me !
Best Regards , Arman Shaban

Litecoin - Long-Term Bearish Structure, New Cycle Low ExpectedDuring previous bull runs (2017 and 2021) , Litecoin consistently made new all-time highs , breaking above prior peaks. However, an important historical pattern stands out: each bear market formed higher lows , suggesting long-term range compression.
At the current stage, this structure appears to be changing. Price remains in a prolonged consolidation phase, and a bear flag has formed on the monthly timeframe, which is a classic bearish continuation pattern following a strong downside impulse.
Based on the overall market cycle structure and historical behavior, I expect a breakdown below previous bear market lows, with a new cycle bottom forming in the $24–20 range.
Key factors:
Clear bear flag on the 1M timeframe
Lack of a sustained uptrend since the 2021 peak
Weak bullish momentum and distribution structure
Market cycle dynamics
Cycle outlook:
2026 is expected to be a bearish year, potentially marking the final phase of this downtrend and the establishment of a macro bottom.
Invalidation:
A sustained breakout and hold above the upper boundary of the monthly bear flag would invalidate this bearish scenario.
This idea is designed for long-term traders and investors who analyze the market through cycle behavior and macro structure, rather than short-term price fluctuations.

LTCUSDT (4H) chart update !!Litecoin is holding a strong demand zone around 76–80 and moving sideways under a long-term descending trendline.
A confirmed breakout above the trendline (~84) could trigger a bullish move toward 92, then 100, and ultimately 120.
If the price falls below the 76 support, the downside risk remains toward 69.
Bias: Neutral → Bullish on breakout.
DYOR | NFA.

After Russell2000 Post-Tease Breakout, Crypto Bull Run FollowsSince Bitcoin's inception the Russell2000 (IWM) has mimicked a similar pattern involving a tease > dump > breakout with crypto always following suit into a new bull cycle. We all have noticed how most altcoins (such as LTC) didn't follow BTC in price action the past couple of years, but upon yesterday's IWM Breakout into price discovery, we should see altcoins (like LTC) (alongside all kinds of other speculative assets, cyclicals, commodities, etc.) follow suit. This set up suggests a crypto bull run starting now and likely ending within the next 6-12 months.

LTC Approaching Key 4H FVG Zone_Reversal Setup AheadLTC is showing clear weakness and continues to drift lower, likely heading toward the 4H FVG zone at $76.2–$77.3. This area will be key for a potential reversal. If price reacts strongly from this zone, a clean recovery move toward the EQH liquidity level at $87.5 is expected. Manage risk wisely and wait for confirmation.

LTC is going up or down ? Answer is be patience I still consider the LTC a Buy, for a potential of good returns and growth by 2027. At present it looks like many manipulators raising the fear index and making price fail under low volatility conditions. If we have to not fall in trap the only way is to stay patience even it shows a sharp fall to 65. Don’t make panic selling and account losses on your ledger. Let the market stable. Consider your 2x to 4x returns only by 2027 and stay quiet for now.
Just my opinion, be cautious on your investment strategy decisions.

#LTC/USDT analysis.Give me some energy !!!#LTC
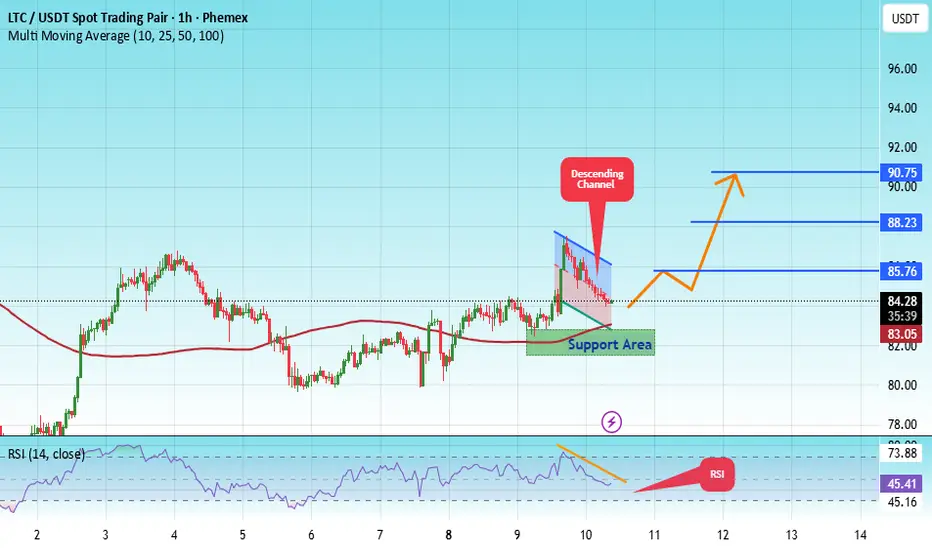
The price is moving in a descending channel on the 1-hour timeframe. It has reached the lower boundary and is heading towards breaking above it, with a retest of the upper boundary expected.
We have a downtrend on the RSI indicator, which has reached near the lower boundary, and an upward rebound is expected.
There is a key support zone in green at 82.00. The price has bounced from this level multiple times and is expected to bounce again.
We have a trend towards stability above the 100-period moving average, as we are moving close to it, which supports the upward movement.
Entry price: 84.29
First target: 85.76
Second target: 88.23
Third target: 90.75
Don't forget a simple principle: money management.
Place your stop-loss below the support zone in green.
For any questions, please leave a comment.
Thank you.
LITECOIN / NEW AGE LTC Target: +$500 (more)LTC is loading... ⏳ Target: $500+ Timeframe: 2026
🚨 LITECOIN (LTC) MACRO UPDATE: The Sleeping Giant Wakes 🚨
Ladies and gentlemen, the chart speaks for itself. We are looking at one of the most pristine Ascending Parallel Channels in crypto history.
We are currently sitting at a "make or break" generational entry point.
1. The Macro Structure: Perfection 📐
Look at the boundaries. The algorithm is respecting the lines perfectly.
The Floor (Support): We have just tapped the lower support trendline of a channel that has held since 2013. Every single time LTC touches this bottom rail (2015, 2017, 2020, 2022), it marks the absolute bottom before a parabolic run.
Current Status (Dec 2025): Price is ~$84.55. We are hugging the support line. The risk/reward ratio here is mathematically asymmetric.
2. The Fractal: History Rhymes 🔄
Notice the Red Triangle structure from 2015-2016?
That was pure accumulation. Boring, sideways, "LTC is dead" sentiment.
Result: It preceded the legendary 2017 run to $370.
Now: We have just completed a similar multi-year accumulation phase (2022-2025). The weak hands have been shaken out. The compression is done.
3. The Target: $500+ Programmed 🚀
The Orange Arrow isn't hope; it's geometry.
A bounce from the bottom of the channel historically targets the top of the channel.
The upper trendline for 2026 sits comfortably above $500.
This implies a vertical expansion phase is imminent.
LTC is loading... ⏳ Target: $500+ Timeframe: 2026

BTC/USDT | Consolidation and fall (READ THE CAPTION!)By examining the 4H chart of BTCUSDT, we can see that BTC is struggling to make a move and is consolidating over the IFVG. If it fails to make a move, a fall to the Demand Zone at 86,600 is possible. However, if it manages to go up, it'll face the FVG at 94,500 level, which then determines whether BTC can make an upwards move or falls again.

LITECOIN can easily hit $43 in the next 10 months.Litecoin (LTCUSD) started its new Bear Cycle after a rejection on the 4-year Lower Highs trend-line. Now that it sits below its 1W MA200 (orange trend-line), which was formally a Resistance during the Bull Cycle, we can claim that the next stage should be targeting the Higher Lows 1 trend-line.
Given that all previous Bear Cycles lasted for at least a year and that the last one dropped less than the 2018, we can expect LTC's new Bear Cycle to last up until August 2026 at least. Even a 'modest' decline should still see it targeting Higher Lows trend-line 2, which by the end of August 2026 should have hit $43.00 at least.
---
** Please LIKE 👍, FOLLOW ✅, SHARE 🙌 and COMMENT ✍ if you enjoy this idea! Also share your ideas and charts in the comments section below! This is best way to keep it relevant, support us, keep the content here free and allow the idea to reach as many people as possible. **
---
💸💸💸💸💸💸
👇 👇 👇 👇 👇 👇

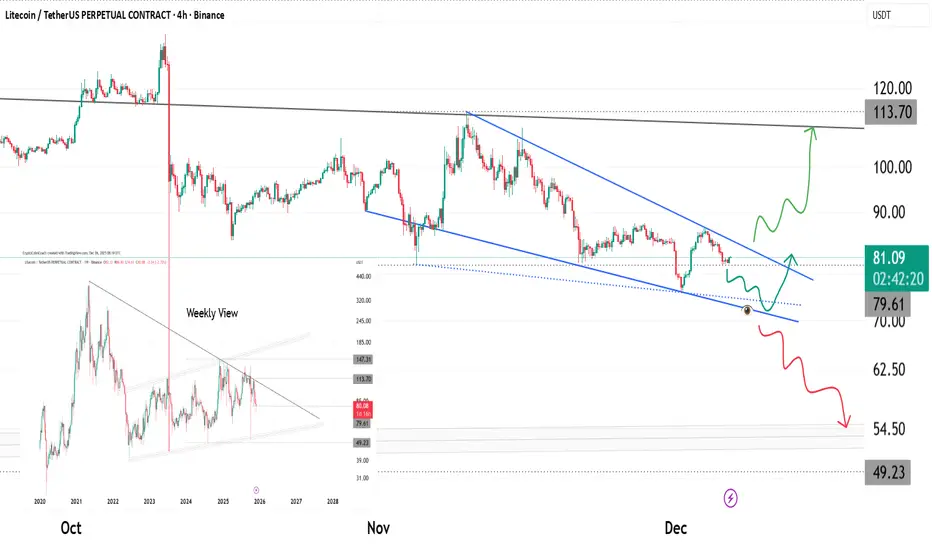
LTC: Final Compression Before the Break - Major Wedge EndingLitecoin is trading inside a clean falling wedge after multiple rejections from the macro trendline visible on the weekly chart. Price is now squeezing toward the apex with momentum flattening out.
Key notes:
• Bullish scenario: A breakout above the wedge resistance + reclaim of 85–87 opens room toward 113.70 and later the macro resistance at 120 .
• Bearish scenario: Losing the lower wedge line + breakdown from 79–80 can send LTC toward 54–49 demand.
Reasons this level matters:
• The wedge has 60+ days of compression
• Weekly multi-year trendline shows confluence
• Local liquidity pools positioned right above current price
• Multiple reaction wicks signaling absorption
Watching the reaction at 79–82 will reveal the next wave: strong bounce = bullish continuation, weak retest = deeper correction.
BTC/USDT | $BTC Smashes Back to 94K but The Real Test Is Ahead!CRYPTOCAP:BTC pulled a full reversal after the heavy crash and pushed all the way back to 94K. Right now price is trading around 93K and this entire move basically filled the liquidity void created during the violent dump. For short term traders this is where I prefer staying on the sidelines because premium entries will show up again at lower levels once the market cools down.
For long term traders and holders nothing has changed. The bullish structure is still alive and if Bitcoin can break above 97K the next upside leg can easily extend toward 105K and even 106K. I will update the view again once we see how price behaves around the 97K zone.
Please support me with your likes and comments to motivate me to share more analysis with you and share your opinion about the possible trend of this chart with me !
Best Regards , Arman Shaban

BTC/USDT | The real test ahead! (READ THE CAPTION)Hello everyone, back with another analysis, this time on BTC.
By examining the daily chart of BTC, we can see that bitcoin has been boosted up after hitting the demand zone and is currently being traded in 93K zone. I expect a rise to 97k-98k FVG zone, if BTC manages to go past through this zone, a rise to 104K could be possible. Should it fail to go past 98K, another drop to 81K is likely to happen.

FireHoseReel | LTC:When does Litecoin explode next?🔥 Welcome to FireHoseReel!
Let’s dive into the 4H Litecoin (LTC) analysis.
👀 Litecoin is currently trading below a descending curve trendline.
Each time price hits this curve, it gets rejected to the downside. Price is now approaching the end of this compression zone, while a key support has formed at $81.48 near the bottom.
📊 Litecoin volume has been declining during the recent drop and is now at very low levels.
Once volume expands again, any upcoming move in LTC is likely to become more impulsive and powerful.
✅ The LTC/BTC pair is also in a strong corrective phase, showing a noticeable decline in Litecoin’s relative strength against Bitcoin.
✍️ You can review the main Litecoin scenarios below and use them alongside your own trading strategy if needed.
🟢 Long Scenario:
A breakout above the descending curve trendline, followed by a clean pullback, and then a push toward the static resistance at $87.42 with rising buy volume, could activate our long trigger.
🔴 Short Scenario:
A breakdown below the $81.48 support with a confirmed close below this level and increasing sell volume could activate our short trigger.
❤️ Risk Management & Emotional Discipline
Crypto trading is highly risky. Without proper risk management and emotional control, trading is no different from gambling.
Logic must always come before emotions. Learn to manage your trades—and enjoy the process of trading with control and discipline.

Litecoin Below 70$ Soon.#Litecoin Below 70$ Soon...
After that it'll go for exit liquidity .
Be Safe Guys.
