Litecoin price at Resistanceprice made breakout of bullish pennant and now at the resistance close above 45000 sats will send price higher
also good breakout on weekly coming soon
Litecoinforecast

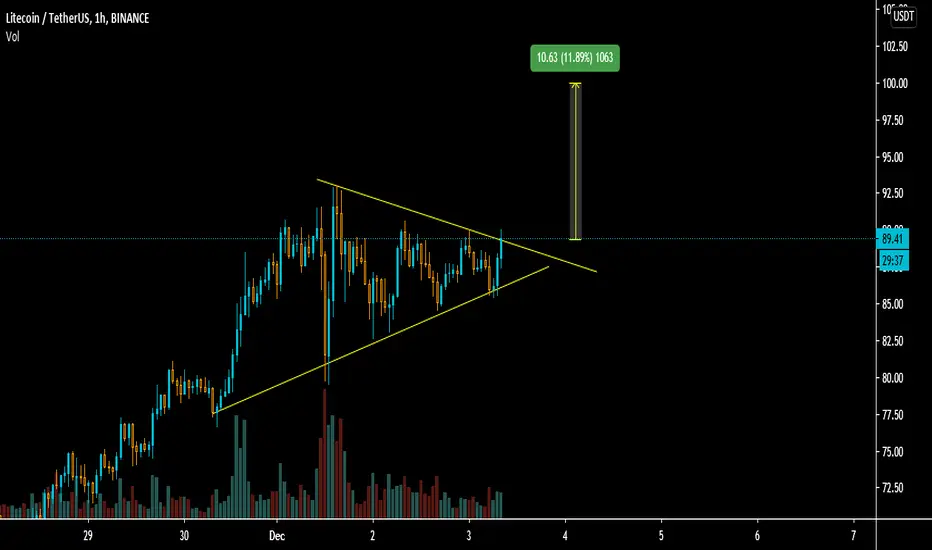
LTC (Litecoin) possible moveLTC / USDT
I expect price will test
trendline support area (+ EMA 50)
betore next leg up
this pattern to be successed 👉 Support area should hold and price shouldn't close below
Good luck

Litecoin price Action (LTC) Possible Outcome Going ForwardWe all make dumb mistakes when we make biased decisions. For me, trading is about removing my personal biases (or what I think the market should do) from my trades. I change my mind about my trades fast and can change to being a bear very easily if price action shows me a different outcome. Removing these biases is what saves me from holding the bag when price action doesn't support my views. Proper stop losses are always in place to make sure that my bias doesn't get in the way. I do not want to trade based on what I think market should or will do. I want to trade based on what price action is telling me.
Current set up is telling me that we need to get to the upper boundary resistance line, breakout of it, re-test it and go from there. I am targeting $120 but I may and will change my mind if price action is telling me otherwise.
Always be loyal to your capital and not your views. Remember one thing when you trade "Your views will not be hurt if you are "wrong". Your capital will be hurt if you are "wrong". Your capital needs you to preserve it and grow it, you can change your views at your ego expense. You can change your capital at your "views" expense. Proper risk management, proper stop losses, elimination of bias - the only thing that will make you successful.
Although this looks bullish AF - keep in mind we are still below the major breakout resistance, chart can morph into another structure so make sure you are not going to let your views hurt your capital. Dont let one day off gains make your next year's decisions.
Happy Sunday and good luck to you traders!
#litecoin #ltc

LTC-4h. Buyers need $83 to continue growingLTC buyers were able to give a decent answer to the local downward trend on 7 December. 16% rebound is a good result.
However, this fight takes place within the consolidation triangle.
The level of $83 plays an important role. This level plays a brake role. The LTC price does not turn immediately from this mark, but each time it is done with great difficulty.
This time, buyers could only touch this mark . Trading volumes began to increase as they approached the white trend line . However, they are clearly not enough to continue growth. We expect to continue trading inside the triangle and test $71.
__________________________
We create both short-term ideas (for a local understanding of the market situation) and medium-term forecasts of price movements.
Subscribe to us and get daily concise analytics!
____________

Come on already break out of the wedge LTC LTC KRAKEN:LTCUSD is very close to breaking out of the falling wedge!
Moon baby!


Litecoin |A pull back before the next rallyPreviously we have seen that the price action of Litecoin was expected to have breakout from the resistance of triangle. Now the price action has broken out the resistance and spiked beyond $94.
On daily chart, the price action of LTC has found a strong resistance at $91 and formed double top at this level. The priceline has also good supports of exponential moving averages 10 and 21 as well.
On daily chart, the price acton of LTC has also found a good up trend line support. Now the price action is moving down towards this support again. But in order to re-test the support breaking down of 25 SMS is must. The Other SMAs with the time period of 50, 100 and 200 are also moving up to provide the support to price action.
On 4-hour chart, the price action of LTC is also forming a bullish Shark harmonic pattern. The potential reversal zone of this pattern starts form $78.73 and ends at $77.18. If the priceline will not take bullish divergence from this PRZ level then it may re-test the support of up-trend line on daily chart and from there it will start the next bullish rally.
Conclusion:
We have a very good supports of 25 SMA on daily chart and potential reversal zone of bullish Shark at same level. If these levels will be broken down then the priceline may move more down to re-rest the support of the trend line.

Litecoin LTCUSDT Price in symmetrical triangle price in symmetrical triangle and ready to move adding small long below 89.6
Stop below : 83
Target : 92 , 96 , 100
Litecoin massive Breakout soon. LTCUSDLitecoin got rejected at around the $90 level after trying to breakout of multi year down trend. On the RSI and Volume, Litecoin is showing strength in the momentum, Litecoin also had the highest weekly buy Volume since December 2017. Last time Bitcoin was at the price it is now, Litecoin was well over $200 now $67. Looking for it to breakout and hold above the blue zone marked for massive upside potential.

LTCUSD to see a slight downtrend(1D) | Upper band resistanceMarket in last 1 week
LTCUSD saw an uptrend with the price riding the upper Bollinger band and gap up in price completed
Price volatility was very high. The market moved ~37.85%, between $94.00 and $68.19
Today’s Trend analysis
LTCUSD expected to see a slight downtrend as the price is riding the upper band with Bollinger band moving upward and upper band resistance
Price at time of publishing: $86.77
LTC’s market cap: $5.722 Billion
Oscillator indicators are mostly neutral. RSI at 69 in the neutral region
Moving average indicators are biased towards an uptrend. Ichimoku Cloud is neutral with the Hull MA indicating selling opportunities
Volume indicators observed an increase as the price increased with the volume above the 20-candle moving average
Price expected to see a slight downtrend as the price is riding the upper band with Bollinger band moving upward and upper band resistance. Most of the Oscillator indicators are neutral. MACD line moving above the Signal line, histogram size decreasing in the positive region, suggesting a bullish bias. RSI at 69, in the neutral region with a pullback from overbought. CCI at 93, in the neutral region with a pullback from the overbought region. Another interesting point to notice here is that the volume observed an increase as the price increased with the volume above the 20-candle moving average indicating a strong buying pressure.
----------------------------------------------------------------------------------------
The analysis is based on signals from 28 technical indicators, out of which 17 are moving averages and the remaining 11 are oscillators. These indicator values are calculated using 1 D candles.
Note: Above analysis would hold true if we do not encounter a sudden jump in trade volume.
----------------------------------------------------------------------------------------
If you find the analysis useful, please like and share our ideas with the community!
- Mudrex

LTCUSD to see a slight uptrend(1D) | Price riding the upper bandMarket in last 1 week
LTCUSD saw an uptrend with the price riding the upper Bollinger band
Price volatility was very high. The market moved ~33.76%, between $77.18 and $57.70
Today’s Trend analysis
LTCUSD expected to see a slight uptrend as the price is riding the upper band with Bollinger band expansion
Price at time of publishing: $75.00
LTC’s market cap: $4.912 Billion
Oscillator indicators are mostly neutral. RSI at 69 in the neutral region
Moving average indicators are biased towards an uptrend. Ichimoku Cloud is neutral with the Hull MA indicating selling opportunities
Volume indicators observed an increase as the price increased while saw a decline in volume as the price decreased
Price expected to see a slight uptrend as the price is riding the upper band with Bollinger band expansion. Most of the Oscillator indicators are neutral. MACD line moving above the Signal line, histogram size increasing in the positive region, suggesting a bullish bias. RSI at 69, in the neutral region with a pullback from overbought. CCI at 176, in the overbought region indicating a downtrend. Another interesting point to notice here is that the volume observed an increase as the price increased while saw a decline in volume as the price decreased indicating a strong buying pressure.
----------------------------------------------------------------------------------------
The analysis is based on signals from 28 technical indicators, out of which 17 are moving averages and remaining 11 are oscillators. These indicator values are calculated using 1 D candles.
Note: Above analysis would hold true if we do not encounter sudden jump in trade volume .
----------------------------------------------------------------------------------------
If you find the analysis useful, please like and share our ideas with the community!
- Mudrex

Get Ready For Next BreakoutHey friends, hope you are well and welcome to the new update on Litecoin.
In my previous posts I have showed two movements of the LTC coin one was the bullish BAT on daily chart.
Another was a big descending triangle on weekly chart.
And as per prediction the price action finally the priceline took a powerful bullish divergence from the potential reversal zone of BAT and broke out the resistance of the triangle. This move was more than 56%.
Movement in up channel:
Now on daily chart the priceline has started its move in an up-channel. At the moment the price action of LTC has reached at the resistance of this channel. In the meanwhile, the price action has also broken out the 25, 50, 100 and 200 simple moving averages and using 25 SMA as good support.
A new move in a symmetrical triangle on long-term:
Now on long-term weekly chart the price action has started a new move in a descending triangle. The formation of this new triangle was started in Feb 2020. At the moment the price action has reached at the resistance. If the price action will not be able to breakout the resistance this time then it may retest the support of this pattern. The 50 SMA is already at the support therefore there will be less chances of breaking down the support level. However, whether the priceline breaks out the resistance in current attempt or after re-resting the support the next target could be $100 (as per measurement of tail of the triangle to the support and placing this measurement at the tip).
Conclusion:
We have very strong supports at the support level of the triangle, however, if you are trading LTC on short term then you can set your stop loss at the support of the channel on daily chart. And if you are trading this coin on long term then the stop loss should be set the support of the triangle and the 50 SMA on weekly chart. Because the support of this triangle is the basic market structure for the price action on long-term if it will be broken down then a long term- bearish rally to the downside can be started.

LITECOINIf my trendiness are right (which they may not be) we have broken out of this pattern...would I would like to see is a return to the descending diagonal with a hold and then holy guacamole...SEND IT!
Target of 75 for first profit...
The Content is for informational and entertainment purposes only, you should not construe any such information or other material as legal, tax, investment, financial, or other advice. This is not financial advice nor am I a financial adviser. :)

Litecoin - $LTC - It's time!!! Are you ready?WAVE 3 in progress! The best time to buy is now!
#LTCUSD: I'm LONG / BULLISH position. I expect that $EOSUSD will rise up.
This would mean that LITECOIN will gain more 500% of its current value against the DOLLAR .
What is the right way? Looking for relevant timeframes, with patience and planning, NO DESPERATION .
No one goes into the market thinking they should buy at the high and sell at the low. The problem is that at the moment when faced with the ups and downs of the market, it’s hard to resist the urge to do those things.
Trading is all about spotting emotional excesses either to the downside or the upside. You want to be on the right side of those emotional reactions and not the wrong.
If you want to win in this market, you need to be COLD and CALCULIST .
To the moon is too close, go beyond
Well, keep you updated as this timely issue evolves.
Good luck!
#CRYPTO $LTCUSD #LTCBTC #LTC #ALTSEASON2020
$BTC $BCH $BNB $XLM $EOS $ETH $ADA $LTC $TRX $XRP $IOTA $LINK $XTZ $BTT $XMR $NEO $BTT $MATIC $XMR $MRK $XEM $ONT $DASH $BAT $ZRX $LSK $NANO $REP
#altcoins #bitcointrading #BuyTheFear #BuyTheDip


LTCUSD to see an uptrend(1D) |Volatility~30% | Riding upper bandMarket in last 1 week
LTCUSD saw an uptrend with the price riding the upper band
Price volatility was very high. The market moved ~29.85%, between $60.90 and $46.90
Today’s Trend analysis
LTCUSD expected to see an uptrend as the price is riding the upper band with higher lows observed and Bollinger band expansion
Price at time of publishing: $58.31
LTC’s market cap: $3.834 Billion
Oscillator indicators are mostly neutral. RSI at 68 in the neutral region
Moving average indicators are biased towards an uptrend. Ichimoku Cloud is neutral with the Hull MA indicating selling opportunities
Volume indicators saw a decrease with price increase being above the 20-candle moving average
Price expected to see an uptrend as the price is riding the upper band with higher lows observed and Bollinger band expansion. Most of the Oscillator indicators are neutral. MACD line moving above the Signal line, histogram size decreasing in the positive region, suggesting a bullish bias. RSI at 68, in the neutral region above the midline. CCI at 108, in the overbought region indicating a downtrend. Another interesting point to notice here is that the volume saw a decrease with price increase indicating a weakening buying pressure and a gap up condition was satisfied with a recent candle.
----------------------------------------------------------------------------------------
The analysis is based on signals from 28 technical indicators, out of which 17 are moving averages and remaining 11 are oscillators. These indicator values are calculated using 1 D candles.
DM to get details of the above analysis and list of indicator & their values used to arrive at the above conclusion.
Note: Above analysis would hold true if we do not encounter sudden jump in trade volume .
----------------------------------------------------------------------------------------
If you find the analysis useful, please like and share our ideas with the community!
- Mudrex

LTCUSD to see uptrend(1D) | Midline support strong buy pressureMarket in last 1 week
LTCUSD saw a decline after getting upper band rejection followed by consolidation
Price volatility was very high. The market moved ~8.81%, between $49.66 and $45.64
Today’s Trend analysis
LTCUSD expected to see an uptrend as the price after getting rejected from the upper band and riding the midline got midline support
Price at time of publishing: $49.31
LTC’s market cap: $3.24 Billion
Oscillator indicators are mostly neutral. RSI at 54 in the neutral region
Moving average indicators are biased towards an uptrend. Ichimoku Cloud is neutral with the Hull MA indicating buying opportunities
Volume indicators saw a decrease with price decline while an increase in volume as the price increased, the total volume being below the 20-candle moving average
Price expected to see an uptrend as the price after getting rejected from the upper band and riding the midline got midline support. Most of the Oscillator indicators are neutral. MACD line approaching from above the Signal line, histogram size decreasing in the positive region. RSI at 54, in the neutral region above the midline. CCI at 65, in the neutral region with a slight upmove. Another interesting point to notice here is that the volume saw a decrease with price decline while an increase in volume as the price increased indicating a strengthened buying pressure.
----------------------------------------------------------------------------------------
The analysis is based on signals from 28 technical indicators, out of which 17 are moving averages and remaining 11 are oscillators. These indicator values are calculated using 1 D candles.
DM to get details of the above analysis and list of indicator & their values used to arrive at the above conclusion.
Note: Above analysis would hold true if we do not encounter sudden jump in trade volume .
----------------------------------------------------------------------------------------
If you find the analysis useful, please like and share our ideas with the community!
- Mudrex

LtcUsd outlook- Sell ralliesLitecoin is writing a different story than Bitcoin.
With sellers defending 50 zone very well I would expect a drop for this cryptocurrency and I will look for selling opportunities around 49 with a 42.50 target.
I will remain bearish as long as the price is under 50.

Litecoin it´s formed a Shouler Head Shoulder Inverted!!!I want to share you my Litecoin forecast for the medium term, that mean that Litecoin si ready or explode soon to the $60 USD in medium term!!!
What do you think about it?

LITECOIN #rocketbombquickidea 🔥Hello, friends!!!🧡
Just quick overview on Litecoin 🧐
Thank you for attention!😊
Stay in touch with me💋
Always sincere with You🧡
Your Rocket Bomb🚀💣

LITECOIN-Battle between active and shadow area🎉 Please give us a thumbs up if u like our work and do follow us so that you can get a regular update about upcoming setups and ideas
LTCUSD
Is trading within a triangle pattern and its about to break the triangle pattern in coming days as in recent days most of the crypto currencies are trading within a confined range. LTCUSD is currently trading above the.382 Fibonacci level and around key price action level where we can expect some resistance to the bull.
50.305 area is acted as both support and resistance for the past 08 months. If the bull want to remain in control it has to broke the key price action level.
If its happened then the next upside swing target would be around 64.00 is the place where we can see a previous left and right shoulder pattern was formed in the august month.
During the initial period of pandemic it has seen a massive sell off due to the lost in market confidence and the investors flew in to safety. From March 13 LITECOIN is in uptrend after this period the bear cannot take control.
If the Key price action level was broken then the next upside hurdle would be a .50 Fibonacci retracement level comes around 54.140.If LTCUSD managed to bruise through the shadow area we can expect massive upside or downside rally. But the current market condition is supporting the bullish rally
💌 Leave your valuable comments and suggestions related to this idea in the comment section.
Thanks for your time. Good day guys 💝

LITECOIN LONG, Following BTCIf you need a trading broker that allows you to trade Stocks, Forex, Crypto, and Indices. I truly Recommend Crypto Rocket! (Not Allowed in The United States Sorry)
www.cryptorocket.com

LTCUSD to see an uptrend(1D)! | Higher lows were observedMarket in last 1 week
LTCUSD saw an uptrend after getting support from lower band
Price volatility was very high. The market moved ~11.57%, between $4713 and $42.24
Today’s Trend analysis
LTCUSD expected to see an uptrend as the price was got support from lower band with higher lows being observed
Price at time of publishing: $46.01
LTC’s market cap: $3.02 Billion
Oscillator indicators are mostly neutral. RSI at 43 in the neutral region
Moving average indicators are biased towards a downtrend. Ichimoku Cloud is neutral with the Hull MA indicating buying opportunities
Volume indicators saw a decrease in recent candles except for a spike for each red and blue candle with the volume being less than 20-candle moving average
Price expected to see an uptrend as the price was got support from lower band with higher lows being observed. Most of the Oscillator indicators are neutral. MACD line crossed above the Signal line, histogram size increasing in the positive region. RSI at 43, in the neutral region below the midline. CCI at -32, in the neutral region with an upmove. Another interesting point to notice here is that the volume saw a decrease in recent candles except for a spike for each red and blue candle with the volume being less than 20-candle moving average indicating bearish volume weighted moving average.
----------------------------------------------------------------------------------------
The analysis is based on signals from 28 technical indicators, out of which 17 are moving averages and remaining 11 are oscillators. These indicator values are calculated using 1 D candles.
DM to get details of the above analysis and list of indicator & their values used to arrive at the above conclusion.
Note: Above analysis would hold true if we do not encounter sudden jump in trade volume .
----------------------------------------------------------------------------------------
If you find the analysis useful, please like and share our ideas with the community!
- Mudrex
