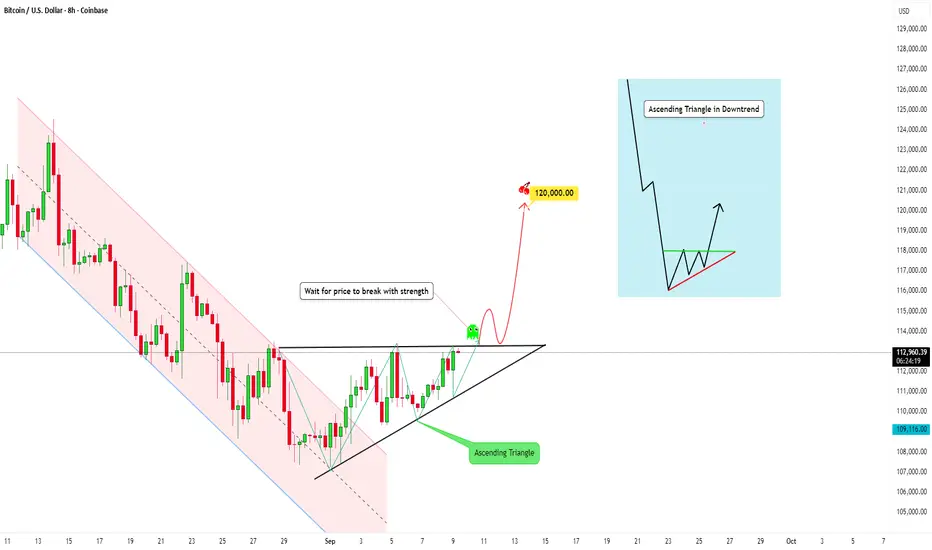
BTC has formed an Ascending Triangle in a DowntrendWhat is Happening Here?
If we take a look at Bitcoin, it's pretty interesting right now: we can observe an ascending triangle just formed. But this pattern took shape after a sharp drop in price.
An ascending triangle is a bullish continuation pattern:
- The resistance line stays horizontal (flat top).
- The support line is rising, creating higher lows.
So what does this mean?
This indicates that buyers are gradually pushing prices higher while sellers are consistently defending the resistance level.
And often with this pattern, the buying pressure overwhelms the sellers, causing a breakout to the upside.
🔹 Breakout expectation:
- Wait for breakout confirmation always! (strong candle close above resistance with volume), and/or on a retest of the broken resistance (now acting as support).
- With this pattern, if it breaks above strongly, the target can typically be measured by taking the height of the triangle and adding it to the breakout level.
🔹 Risk Factors:
- False breakouts can occur (price temporarily breaks resistance but falls back inside).
- If the pattern fails and price breaks below the rising trendline, it may signal bearish weakness.
✅ The reliability of the pattern increases on higher timeframes and with strong breakout volume.
In summary
An ascending triangle shows the following: Buyers are showing strength with rising lows, while resistance is being pressured repeatedly. A confirmed breakout above resistance could drive price toward a psychological target. Waiting for a strong breakout and possibly a retest helps reduce false signal risk.
Not financial advice, just sharing my thoughts on the charts.
Trade safely 😊
Community ideas
BTC - Are the bulls looking for a liquidity grab?Market Context
Bitcoin is holding strong after bouncing from a higher support zone and is now pressing into an area packed with liquidity. The recent bullish price action has carved out multiple fair value gaps on the way up, each serving as confirmation of demand and strengthening the bullish structure. Above current price lies a major cluster of buy-side liquidity — a magnet for price.
Fair Value Gaps & Confirmations
On the way up, price created several bullish fair value gaps that have each been respected as support. The first, second, and now third retests into these imbalances show that demand continues to step in, absorbing supply and building pressure upward. Adding to that, a bullish inversion fair value gap (IFVG) has formed, giving extra confirmation that buyers are in control.
Liquidity Target Above
The most obvious draw for price is the heavy buy-side liquidity resting above recent highs. With so many stops positioned there, the market is incentivized to push higher and sweep that zone. The path toward it could involve another retest into one of the fair value gaps below before expansion takes place, or a direct continuation straight into the liquidity pocket.
Final Thoughts
This structure is showing textbook bullish strength: stacked fair value gaps, IFVG confirmation, and a clear liquidity pool overhead. Unless the market breaks back below the deeper support zone, the expectation remains a run into buy-side liquidity.
If this breakdown sharpened your view, a like is appreciated — and I’d love to hear from you: do you expect a retest first, or do we shoot straight into liquidity?

AUD/USD - Bullish Channel (10.09.2025) The AUD/USD pair on the M30 timeframe presents a Potential Buying Opportunity due to a recent Formation of a Bullish Channel Pattern.
This suggests a shift in momentum towards the upside and a higher likelihood of further advances in the coming hours.
Possible Long Trade:
Entry: Consider Entering A Long Position around Trendline Of The Pattern.
Target Levels:
1st Resistance – 0.6636
2nd Resistance – 0.6658
🎁 Please hit the like button and
🎁 Leave a comment to support for My Post !
Your likes and comments are incredibly motivating and will encourage me to share more analysis with you.
Best Regards, KABHI_TA_TRADING
Thank you.
Disclosure: I am part of Trade Nation's Influencer program and receive a monthly fee for using their TradingView charts in my analysis.

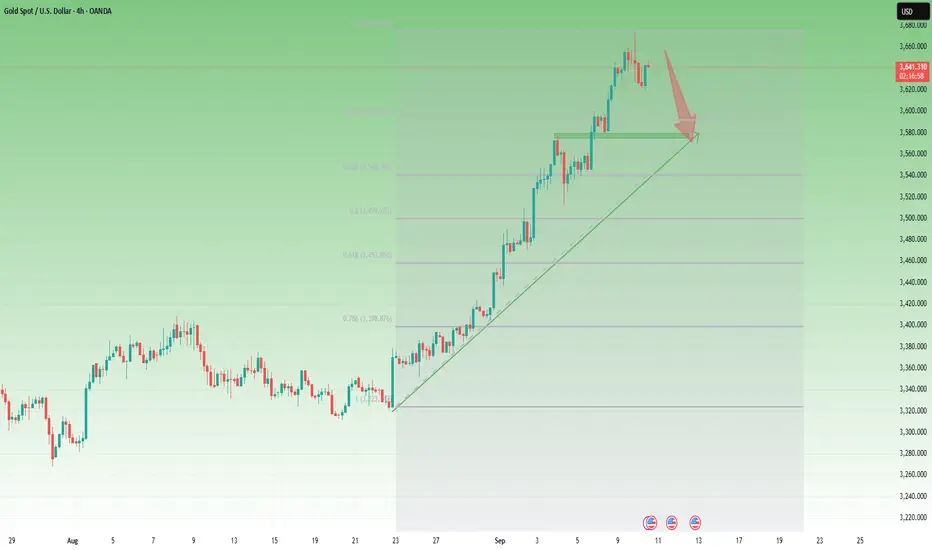
GOLD → Consolidation before continued growth FX:XAUUSD is undergoing a correction amid revised unemployment data, but this has not disrupted the overall technical situation. The market is still anticipating an aggressive reduction in interest rates...
The price resumed its growth on Wednesday amid escalating geopolitical tensions and a weakening dollar ahead of the release of US inflation data (PPI). The price is correcting after a record high of $3675, but retains the potential for further growth.
The escalation of the situation in Eastern Europe and the Middle East is increasing demand for safe assets. Expectations of Fed policy easing and a revision of employment data are weighing on the USD.
PPI inflation data: Today's release may temporarily support the USD if the figures exceed forecasts, but the overall trend remains bearish for the dollar.
PPI data is ahead, which may cause short-term volatility, but the long-term bullish trend remains intact.
Support levels: 3640, 3628
Resistance levels: 3657, 3675
Technically, I expect to see a correction from local resistance to the 3645-3640 area, from which growth may continue. A breakout of 3657 could trigger a continuation of the momentum.
Best regards, R. Linda!

EURUSDHello Hello Traders! 👋
What are your thoughts on EURUSD?
EUR/USD has been trapped in a sideways range for the past few weeks, showing choppy back-and-forth movements.
However, the recent break above the descending trendline suggests that a potential bullish breakout could be underway.
After some short-term consolidation, the pair could gain bullish momentum and head toward the next resistance levels.
Thursday’s U.S. CPI data will be a key catalyst that may drive volatility and determine the pair's next direction.
Don’t forget to like and share your thoughts in the comments! ❤️

GOLD: Israeli Airstrike Hits Hamas leaders in QatarGOLD: Israeli Airstrike Hits Hamas leaders in Qatar
🚨 Breaking NEWS:
Several blasts heard in Qatar’s capital after Israeli airstrike on Hamas leadership
The Israel Defence Forces (IDF) said it had carried out a targeted attack on Hamas officials, shortly after the militant group claimed responsibility for an attack on a bus stop in Jerusalem that killed six people.
------------------------------------------
The previous time Israel, Iran and the US started the conflict and GOLD fell and did not rise at a time when everyone thought it would explode.
The price is rising inside an ascending channel. A price reaction has already started. If it breaks out of the channel, then it may fall further as shown in the chart.
It may repeat the same pattern as last time. Drop at a moment that everyone is waiting for 4000.
Someone else may close the profits made so far.
Maybe the news we had today was news that someone else knew in advance. This could be a strong reason why GOLD rose for no reason in the previous days.
⚠️It is better if you avoid trading gold
⚠️I don't want you to sell GOLD, but is better if you know that also this scenario is possible if the price breaks down from the channel
You may find more details in the chart!
Thank you and Good Luck!
❤️PS: Please support with a like or comment if you find this analysis useful for your trading day❤️

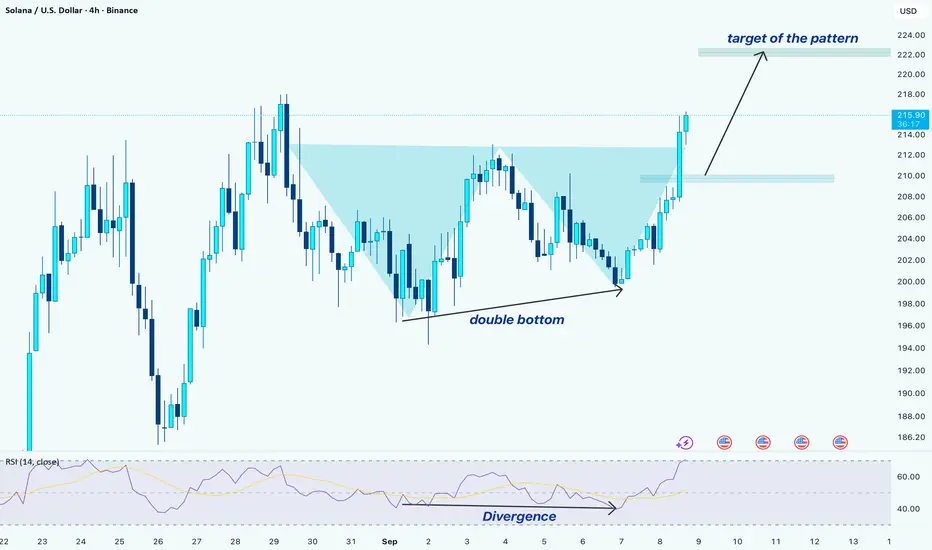
SOL/USDT –> Double Bottom Breakout with Bullish DivergenceHello guys!
Solana has completed a double bottom pattern and broken above the neckline, signaling bullish momentum. Here’s the breakdown:
1-Pattern Formation
A clear double bottom has formed around the $200 zone.
The neckline breakout happened at ~$213–214, confirming the reversal.
2- Momentum Confirmation
Bullish divergence on RSI supported the double bottom.
While price made equal lows, RSI showed higher lows → early sign of trend reversal.
3-Entry Options
Market entry
Pullback entry: Around the $210 area, in case of a retest of the neckline zone.
5- Target
The projected move from the pattern points to $222.
This also aligns with the next resistance area.
Gold Pushing Higher!Price pushed in a clear ascending channel. It broke above the most recent resistance, then came back to retest the level. Classic break and retest.
Price rejected off that level, which turned it into new support. That’s a good signal to go long, targeting the top of the projected channel.

PPI Shock Pushes Bitcoin Higher – Fake Pump Before Drop?Bitcoin ( BINANCE:BTCUSDT ) has been making high momentum Sharpe moves over the last few days , which has made it a little difficult to trade, which is why I am still sticking to my previous analysis , and this analysis is an update of targets and even new entry points .
Bitcoin is currently moving near the Resistance zone($114,720-$113,580) , Reversal Zone(PRZ) , Cumulative Short Liquidation Leverage($114,510-$113,771) , Monthly Pivot Point , and Resistance lines = a set of Resistances
A few minutes ago, the US Core PPI m/m and PPI m/m data were released, which triggered a pump in Bitcoin . In my view, we should wait for Bitcoin to digest this shock and then continue its real trend .
Do you agree with me?
In terms of Elliott Wave theory , it seems that Bitcoin has completed microwave 5 of microwave C of the main wave Y , and we can expect a downtrend .
I expect Bitcoin to drop again to at least $111,600(First Target) .
Second Target: $110,883
Third Target: $110,000 and more dumps.
Stop Loss(SL): $114,923(Worst)
CME Gap: $117,235-$113,800
Cumulative Long Liquidation Leverage: $110,822-$109,752
Note: Be sure to follow capital management and do not take risks.
Please respect each other's ideas and express them politely if you agree or disagree.
Bitcoin Analysis (BTCUSDT), 1-hour time frame.
Be sure to follow the updated ideas.
Do not forget to put a Stop loss for your positions (For every position you want to open).
Please follow your strategy and updates; this is just my Idea, and I will gladly see your ideas in this post.
Please do not forget the ✅' like '✅ button 🙏😊 & Share it with your friends; thanks, and Trade safe.

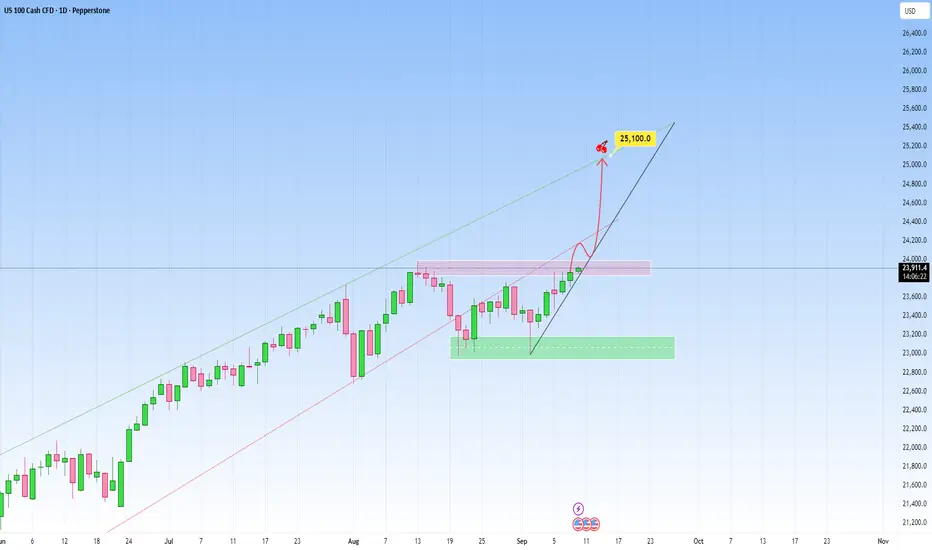
NAS100 Outlook: Recent rise has been steady!Market context on NAS100 remains bullish clearly. The most recent move saw a steady recovery, heading towards the upper boundary of the newly projected channel. And this right here is another great opportunity to get involved.
The market is likely in the early stages of a new impulsive leg to the upside right here.
We could also have short-term consolidation or pullback, then a continuation toward the upper boundary but I believe the latter is more plausible.
My target will be at 25,100.
Gold 30Min Engaged ( Buy And sell Entry Detected )Time Frame: 30-Minute Warfare
Entry Protocol: Only after volume-verified breakout
🩸Bearish After Break : 3635
🩸Bullish Reversal : 3595
➗ Hanzo Protocol: Volume-Tiered Entry Authority
➕ Zone Activated: Dynamic market pressure detected.
The level isn’t just price — it’s a memory of where they moved size.
Volume is rising beneath the surface — not noise, but preparation.
🔥 Tactical Note:
We wait for the energy signature — when volume betrays intention.
The trap gets set. The weak follow. We execute.

Gold Promises New Highs👋Hello everyone, what are your thoughts on OANDA:XAUUSD ?
Today, gold continues to hold a strong bullish trend, currently trading around 3,630 USD with a short-term pullback serving as momentum for the next move.
The key support zone is located around 3,600 – 3,580 USD. If this level holds, the upside remains open with the first psychological target at 3,700 USD. Two major indicators to watch are PPI (Sept 10) and CPI (Sept 11), which could act as the next catalysts for XAUUSD. Keep a close eye to catch trading opportunities.
Scalping Strategy – Optimal Profit Management
✔️ TP1 or 30 Pips: Close bad entry and move SL to entry
✔️ TP2 or 50–70 Pips: Close half of remaining profit, move SL to TP1
✔️ TP3: Close all
From my personal perspective, the main trend remains bullish. Pullbacks only serve as opportunities for safer long entries. And you—what do you think about gold’s trend?

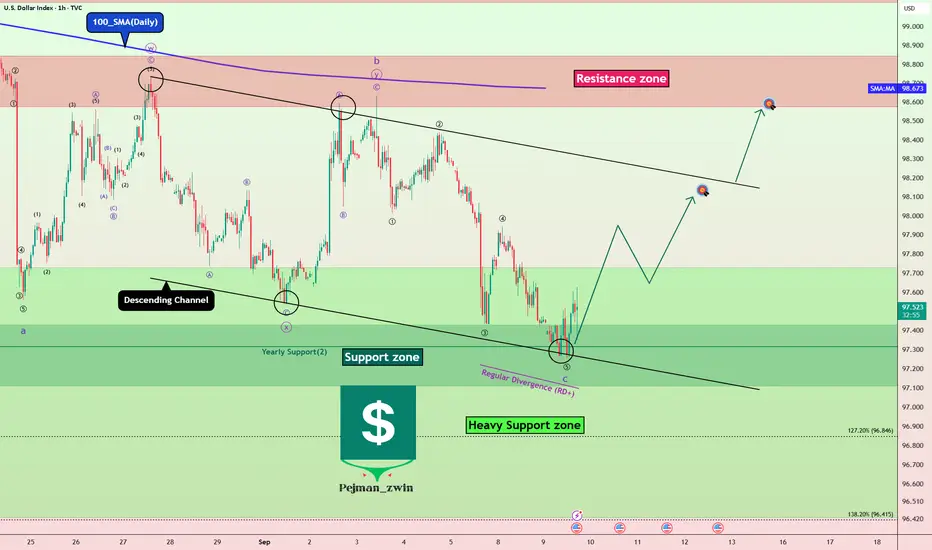
DXY at Major Support – Dollar Ready to Rebound?Today, I want to analyze the DXY index ( TVC:DXY ) for you. First, I must say that this week, US indexes can have an impact on the DXY index trend .
US indexes to be released this week:
Core PPI m/m: Tomorrow
PPI m/m: Tomorrow
Core CPI m/m: Thursday
CPI m/m: Thursday
CPI y/y: Thursday
Unemployment Claims: Thursday
Prelim UoM Consumer Sentiment: Friday
Prelim UoM Inflation Expectations: Friday
The DXY Index is currently moving near the Support zone($97.989-$97.834) , Yearly Support(2) , and the lower line of the descending channel .
In terms of Elliott Wave theory , it seems that the DXY index has managed to complete microwave 5 of the main wave C . The corrective structure is of the Zigzag Correction(ABC/5-3-5) type.
Also, we can see the Regular Divergence (RD+) between consecutive valleys .
I expect the DXY index to rise to at least $98.07(First Target) before the US indexes are announced.
Second Target: $98.56
Stop Loss(SL): $96.997
Note: With the DXY index rising, we can expect a correction in Gold( OANDA:XAUUSD ), Bitcoin( BINANCE:BTCUSDT ), and major Forex pairs (dollar strength).
Please respect each other's ideas and express them politely if you agree or disagree.
U.S. Dollar Index Analyze (DXYUSD), 1-hour time frame.
Be sure to follow the updated ideas.
Do not forget to put a Stop loss for your positions (For every position you want to open).
Please follow your strategy and updates; this is just my Idea, and I will gladly see your ideas in this post.
Please do not forget the ✅' like '✅ button 🙏😊 & Share it with your friends; thanks, and Trade safe.
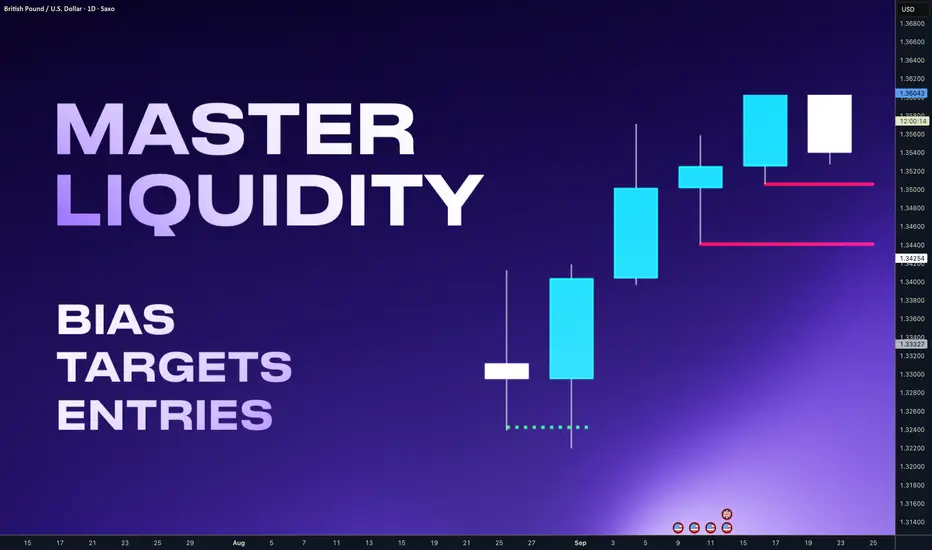
Liquidity in Trading: The Basics You Must Understand👉 If you can’t identify liquidity, you become the liquidity.
It's not an indicator, It's not a pattern. It's not a theory.
It's how the markets actually move.
Every trader has seen it happen: you take a position at the “obvious” level, only to get stopped out by a quick wick — and then the market runs exactly where you expected. That wasn’t bad luck. That was liquidity.
In this post, you’ll learn few main forms of liquidity that move markets and how to avoid being stop hunted and actually use such a phenomena for your advantage.
Don't be a liquidity
Price doesn’t move randomly inside ranges. It hunts liquidity at the edges.
• Retail trap: Traders pile orders right at the range high/low.
• Smart money: Hunt's edges of range before starting the move.
Wait for the sweep of those levels. The stop runs happen first, the real move comes after.
⚠️ If a pivot level gets tapped multiple times, it's on purpose. Smart money are creating illusion of strong support / Resistance.
Les informed traders trades patterns like : Double bottom, Double top and they put the stop losses above the range - This creates a Liquidity cluster which smart money needs to execute their orders. They will come for it before the real move happen.
How to enter continuation
Even in strong trends, price doesn’t move in straight lines.
• Consolidation → Expansion: Liquidity builds during pullbacks or sideways pauses, then gets released in a sharp move.
• Retracement → Expansion: don’t chase the first pullback. Wait for at least 50% pullbacks. Not earlier. Best setup is when it has all like the one below.
Double top as liquidity, range, 50% pullback , stop hunt
• Double tops and Triple tops are engendered liquidity if you see it expect price go thru that levels
The win isn’t catching the exact bottom. It’s catching a clean entry with strong Trend continuation - low timeframe reversal and with right timeframe allignements.
So here is again GBPUSD example where we had the weekly range, stop hunt to 50% of the swing.
After stop hunt occurs you wait for. H4 OB being created in other words engulf of last bulky down candle and clean close above. Then you can enter with SL below the stop hunted lows, not only that traders was liquidated there but also another group of traders entered shorts and they will be now liquidated above that double top and its your target.
Importance of key level
Even when smart money moves price to the highs where it seems there is not key level always look left price mostly stop just right above or below the key level. Ranges for some time makes false move in the direction which sucks traders in to to a trade and then they hit key level and go that direction.
If the move is not going from key level it's a trap. We can use many types of levels, but here is a tip for the forex Whole, quarter, half levels are strong. If your order block, supply / demand occurs or classic support occurs around that level it will have higher probability and its not because of psychological level. It's because these levels are what institutions are trading.
Stop hunts are not your enemy — unless you ignore it. The market makers hunts liquidity before it moves. By starting thinking about the markets this was way you will recognize and will be able to visualize future movements.
Summary
Big challenge is waiting patiently for the stop hunt to happen. And yes sometimes price moves without a stop hunt and you will miss a move. But it's always better not to be in a trade you want to be than being In trade you dont want to be.
Shift from being the exit liquidity to being the trader who patiently waits, confirms, and executes with precision.
🩸 Spot the trap. 🩸 Wait for the sweep. 🩸 Trade with intention.
Dont trust me and fact check this on your chart for your confidence. It's only way to start to see markets differently.
David Perk aka Dave FX Hunter
Trading Psychology 101: Master Your Mind Before the MarketWhen people first start trading, most of their attention goes to entries, indicators, and strategies. It feels like the secret to success must be hidden in the charts.
Over time, traders realize something uncomfortable: the biggest challenge isn’t the market—it’s themselves.
You can learn technical analysis, understand risk management, and even copy profitable strategies. Yet, if fear, greed, or impatience take over, the outcome will be inconsistent.
Research suggests that trading performance depends far more on mindset than on technical skill alone.
Here are a few patterns almost every trader will recognize:
Entering too quickly because of FOMO.
Closing winners too early out of fear they will reverse.
Holding on to losers, hoping they will turn around.
Ignoring rules after a streak of good trades because of overconfidence.
Each one might feel harmless in the moment, but over time they erode consistency.
Imagine two traders using the exact same strategy with a 60% win rate.
Trader A lets emotions dictate actions. They cut winners short, stretch losers, and end up losing money.
Trader B follows rules calmly. Losses are accepted, winners are allowed to run. Over the same number of trades, this trader ends profitable.
The system is identical, but psychology makes all the difference.
5. The Real Lesson
Markets are unpredictable. Strategies are never perfect. What you can control is how you respond.
Strong psychology allows you to execute consistently and let probabilities play out. Without it, even the best system will eventually fail.
6. Benefits of a Solid Mindset
Building psychological strength in trading gives you:
Patience to wait for quality setups.
1. Discipline to stick with your plan.
2. Resilience to handle losing streaks.
3. Consistency across weeks and months.
4. Mental clarity to make rational decisions under stress.
Another bullish move goldThis is a Gold Spot vs U.S. Dollar (XAU/USD) chart on the 1-hour timeframe from OANDA. At the current moment, the gold price is trading around $3,657.19, showing a gain of +21.345 points (+0.59%).
The chart highlights a bullish momentum, with the price consistently forming higher highs and higher lows since September 7th. Buyers are dominating, pushing the market upward after breaking through consolidation zones.
Key support levels can be seen around:
$3,655.97
$3,646.27
$3,628.16
$3,578.10
These levels serve as potential zones where buyers may step in again if the price pulls back.
The projection on the chart shows a bullish continuation setup. After a short retracement, the market is expected to resume its upward movement, aiming toward the new high zone at $3,708. This suggests traders are anticipating further upside momentum if gold maintains its current bullish strength.

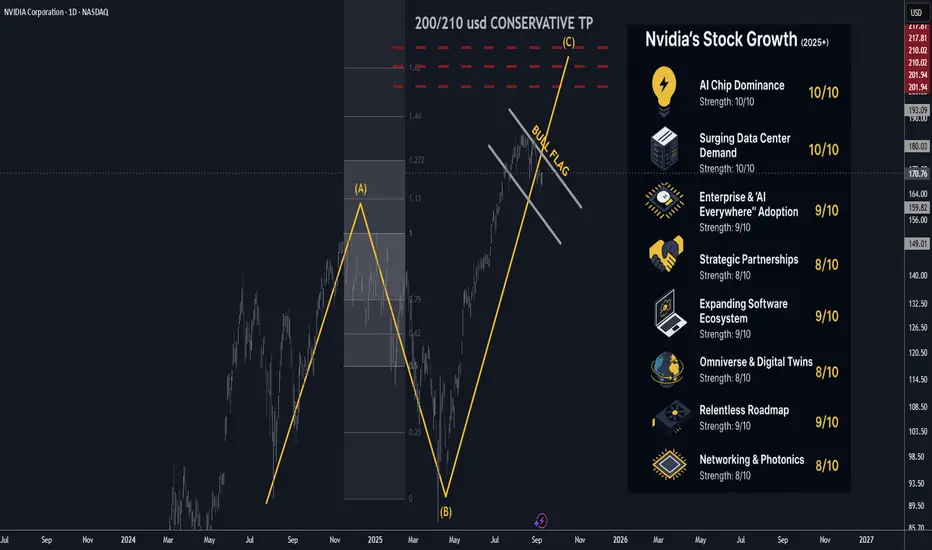
Nvidia (NVDA) 2025+ Catalysts Updated: Analyst Views September🚀 Nvidia (NVDA) 2025+ Catalysts & Risks: Analyst Views — Updated September 2025
________________________________________
📝 Summary Outlook (September 2025)
Nvidia remains at the center of the global AI boom, with dominant GPU share, a strengthening networking/software moat, and multi-year sovereign and enterprise buildouts driving demand. Q2 FY26 confirmed strong momentum, while Q3 guidance points to continued growth. The main risks lie in tariff policy, China licensing, supply chain tightness, and valuation sensitivity. Street consensus remains bullish, with targets in the $207–$211 range and a Strong Buy bias.
🔑 Key Catalysts Driving Nvidia’s Stock Growth (2025+)
1. 🏆 AI Chip Dominance — Score: 10/10
Nvidia still commands ~90%+ of data-center AI accelerators, with CUDA/NVLink lock-in keeping switching costs high.
2. 🏗️ Surging Data Center Demand — Score: 10/10
Hyperscalers remain in an AI “build” cycle. 2025 data-center CapEx is approaching ~$300B, with Nvidia reporting record $41.1B Data Center revenue in its latest quarter.
3. 🌐 Enterprise & “AI Everywhere” Adoption — Score: 8.7/10
Companies across industries are rolling out AI assistants, copilots, and retrieval-augmented applications; Nvidia benefits via GB200 NVL72 racks and RTX-based inference at the edge.
4. 🤝 Strategic/Channel Partnerships — Score: 8.9/10
Cisco is integrating Spectrum-X into networking solutions, while HPE has expanded its Nvidia “AI factory” offerings—broadening reach into enterprise and hybrid AI buildouts.
5. 🚗 Automotive & Robotics — Score: 8.4/10
Auto revenue grew ~70% Y/Y; DRIVE Thor shipments have begun, and Nvidia’s Jetson/AGX Thor and robotics platforms are expanding into industrial automation.
6. 🧑💻 Software & Subscriptions — Score: 8.6/10
Nvidia’s AI Enterprise, DGX Cloud, CUDA-Q, and TensorRT deepen recurring, high-margin revenue and increase developer lock-in.
7. 🌎 Omniverse, Digital Twins & Industrial AI — Score: 8.2/10
Ansys, Siemens, and other industrial software vendors are embedding Omniverse into simulation suites, accelerating adoption of “digital twins” and simulation AI workflows.
8. 🛜 Networking & Photonics — Score: 8.8/10
Spectrum-X Photonics enables co-packaged optics for exascale “AI factories,” improving bandwidth and efficiency while giving Nvidia more end-to-end control.
9. 🧪 Relentless Roadmap (Blackwell → Rubin) — Score: 9.0/10
Blackwell Ultra is ramping into 2025, with the Rubin architecture slated for 2026—sustaining Nvidia’s upgrade cycles.
10. 🌍 Sovereign & Global AI Buildouts — Score: 8.5/10
Europe, the Middle East, and India are launching sovereign AI projects. Saudi-backed Humain alone has committed to tens of thousands of Blackwell chips for 2026 buildouts.
________________________________________
📈 Latest Analyst Recommendations (September 2025)
• Street Stance: Strong Buy/Overweight remains dominant. ~85% of analysts rate NVDA a Buy; avg 12-mo PT ~$207–$211.
• Recent Calls: Multiple firms reiterated Overweight/Buy, with price targets up to $230.
• Common Bull Case: Nvidia’s accelerator lead, software moat, sovereign/enterprise AI pipeline, and expanding networking portfolio.
• Common Cautions: Premium valuation, competition from custom silicon, and export/tariff risk.
________________________________________
🗞️ Latest Events & News (Aug–Sep 2025)
• Q2 FY26 results (reported Aug 27, 2025): Revenue $46.7B (+56% Y/Y); Data Center $41.1B; Blackwell shipments +17% Q/Q; buyback program boosted by $60B.
• Q3 FY26 guidance: ~$54B (±2%) revenue.
• Networking push: Spectrum-X Photonics unveiled; Cisco partnership expanding enterprise deployments.
• Omniverse OEM deal: Ansys to embed Omniverse tech within its simulation platforms.
• Sovereign AI momentum: Saudi Humain centers to deploy 18k+ Blackwell chips starting 2026; UAE and India also ramping large-scale AI initiatives.
• Ecosystem investing: Nvidia continues selective investments in AI startups, strengthening CUDA adoption.
________________________________________
🇺🇸🇨🇳 US–China Tariffs & Export Controls — September 2025 Update
• Tariff truce extended (Aug 2025): Current tariffs remain at ~30% U.S. on Chinese imports and ~10% reciprocal from China. Next decision point: Nov 10, 2025.
• Supreme Court review: The Court will hear a case challenging U.S. executive authority on tariffs this fall.
• China export licensing: U.S. has begun granting licenses for Nvidia’s H20 China-compliant GPUs. Advanced Blackwell exports remain restricted without further approvals.
Impact on Nvidia: Truce reduces near-term disruption, but future tariff or licensing changes remain key risks. China sales are limited to compliant GPUs with lower margins.
________________________________________
⚠️ Key Negative Drivers & Risks (Updated)
1. 🇨🇳 US–China Tech Policy
Tariff truce is temporary; licensing decisions and court rulings keep China exposure uncertain.
2. 🏛️ Regulatory/Legislative Overhang
Proposals like the GAIN AI Act could impose stricter controls on exports and prioritize domestic deployments.
3. 🏭 Supply Chain Bottlenecks
Advanced packaging and HBM memory remain tight despite expansions—potential bottlenecks for shipments.
4. 🧮 Competitive Threats & Custom Silicon
AMD, Intel, and hyperscaler-designed accelerators continue to advance, potentially eroding Nvidia’s hyperscale share.
5. 🏷️ Valuation & Expectations
Nvidia trades at high multiples; any slowdown or guidance miss could trigger volatility.
6. 💵 Customer Concentration
Top cloud giants still account for a large share of revenue; CapEx pauses or custom chip adoption would materially impact results.
________________________________________
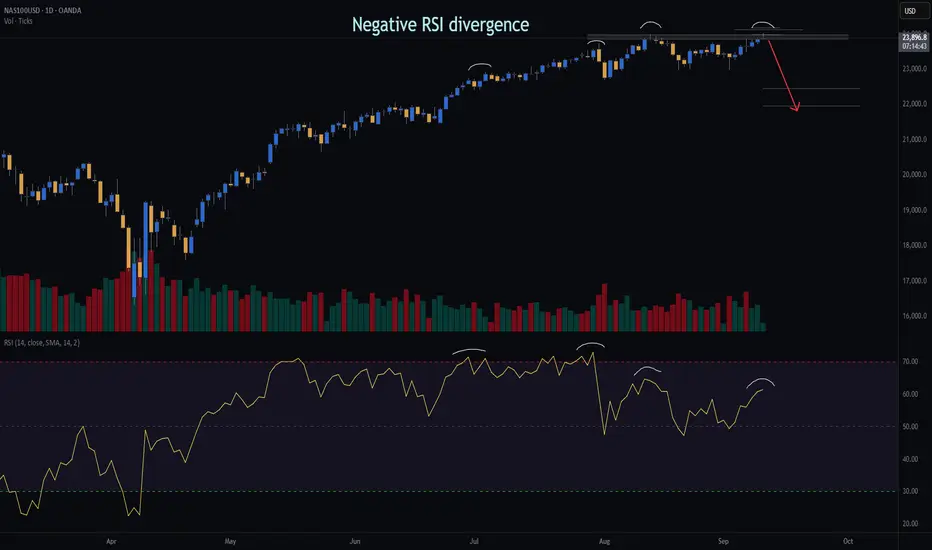
NASDAQ | Daily Double Top | GTradingMethodHello Traders 👋
🧐 Market Overview:
I’ve opened a short on the NASDAQ based on a clear double top setup that formed yesterday. Several of my key variables aligned, giving this trade a high-probability edge:
Negative RSI divergence → showing weakening buying momentum
Lower volume on the second top → indicating exhaustion
Daily candle closure within threshold → confirming structure validity
📊 Trade Plan:
RR: 9.1
Entry: 23 931
Stop Loss: 23 178
Take Profit 1 (50%): 22 453
Take Profit 2 (50%): 21 969
💡 GTradingMethod Tip:
When trading reversal patterns like double tops, I always wait for confirmation across multiple variables (momentum, volume, candle structure). This increases probability and reduces false entries.
🙏 Thanks for checking out my post!
Follow me for more setups and let me know — do you see this double top holding, or is there more upside left in the NASDAQ?
📌 Disclaimer:
This is not financial advice. This content is to track my trading journey and for educational purposes only.
16,532% growth in just 37 days! A new star in the crypto world!MYX Finance: Understanding the Crypto Star that Soared Over 16,000%
BINANCE:MYXUSDT.P
In the fast-moving world of cryptocurrency, stories of incredible growth often capture our imagination. Recently, a new star has emerged, producing a truly breathtaking performance. In just 37 days, the MYX Finance token (MYX) experienced a massive price increase of over 16,532%. This kind of rocket launch makes everyone ask two simple questions: What is MYX Finance, and how did its price rise so fast?
This article is your guide to understanding this exciting story. We will explore what makes MYX Finance a special project in the crypto universe. Then, we will uncover the key reasons behind its recent, explosive growth. This is more than just a story about numbers; it’s a look into the innovation and energy that makes the world of digital finance so exciting.
Part 1: What is MYX Finance? A Simple Guide to a Powerful Platform
Before we understand why MYX grew so quickly, we first need to understand what it is. At its heart, MYX Finance is a new type of crypto trading platform designed to be powerful, fair, and easy for everyone to use.
The Best of Both Worlds - A New Kind of Crypto Market
In the crypto world, there are two main types of exchanges. Centralized Exchanges (CEXs) are like big, traditional banks. They are fast and easy to use, but you have to trust them to hold your money safely. Decentralized Exchanges (DEXs) are more like a community market. You always control your own money, but they can sometimes be slower and more complicated. MYX Finance combines the best features of both. It’s a DEX, so you always have control of your funds, but it’s designed to be as fast and easy to use as a CEX. It achieves this with a special system that lets trades happen instantly and with a feature they call “zero-slippage.”
The Magic of "Zero-Slippage"
Imagine you want to buy a crypto token for $100. On many platforms, by the time your order is processed, the price might have changed to $101. That $1 difference is called “slippage.” It can be very frustrating for traders. MYX Finance has built a system to eliminate this problem. Zero-slippage means the price you see when you click “buy” is the exact price you get. This makes trading fairer and more predictable, which is a huge advantage for traders of all levels.
More Than Just Trading - A Multi-Chain Universe
MYX isn't limited to just one blockchain. It operates across more than 20 different chains, including popular ones like Ethereum, BNB Chain, and Arbitrum. This means users can trade a huge variety of tokens without having to move their funds between different platforms, saving them time and money.
Part 2: The Perfect Storm: Four Key Catalysts for Explosive Growth
A 16,532% price increase doesn't happen by accident. It takes a “perfect storm” of technology, timing, and community excitement. For MYX, four main factors came together to create this incredible rally.
Excitement for the V2 Upgrade: Before the big price surge, there was a lot of positive talk in the MYX community about a major platform upgrade called V2. This upgrade promised to make the platform even better, faster, and more powerful, creating a strong foundation of positive sentiment.
Major Exchange Listings: The real explosion began when the MYX token was listed on popular crypto exchanges, especially Binance Alpha. This exposed the token to millions of new potential buyers. In one day, trading volume surged by 710%, reaching an incredible $354 million.
The "Short Squeeze": When the price started to rise, traders who had bet against the token (shorting) were forced to buy it back to cover their losses. This created a rapid buying frenzy called a “short squeeze.” In just 24 hours, over $14.6 million in these short positions were liquidated, adding even more fuel to the rally.
Industry Recognition and Awards: Finally, MYX Finance received a prestigious award from the BNB Chain, one of the biggest networks in crypto. They were named a “Volume Powerhouse,” which served as a powerful endorsement and gave new buyers more confidence in the project.
Part 3: The Big Picture - Why This Matters for Crypto
The story of MYX Finance is more than just one token's success; it shows us some important trends in the world of crypto.
Innovation Matters: MYX didn’t just grow because of hype; it grew because it offers a genuinely better trading experience with its zero-slippage feature. This shows that projects with strong technology can achieve incredible things.
The Power of Community: The excitement and support from the MYX community played a huge role in its success. In decentralized finance, a strong community is one of the most valuable assets a project can have.
Opportunity Still Exists: It reminds us that the crypto market is still young and full of opportunity. While there are always risks, stories like MYX show that there is still massive potential for growth.
Conclusion: Your Adventure in the World of Crypto Begins
The incredible 37-day journey of MYX Finance is a powerful reminder of how dynamic and exciting the world of digital assets can be. We’ve seen how a project with innovative technology, strong community support, and perfect timing can capture the attention of the entire market.
As the Founder of ForecastCity and the creator of the 4CastMachine AI software, my mission is to help traders navigate this exciting market with better tools and insights. The crypto world is full of opportunities like this one. To stay ahead of the curve and continue your learning journey, make sure to follow me! Let's explore the future of finance together.
Frequently Asked Questions (FAQs)
What is MYX Finance in one sentence?
MYX Finance is a next-generation decentralized exchange (DEX) that makes trading crypto fast, easy, and fair by offering zero-slippage trading across more than 20 different blockchains.
What does "zero-slippage" mean?
It means the price you see when you make a trade is the exact price you get, which prevents you from losing money to sudden price changes during your transaction.
Why did the MYX token price rise so fast?
It was a "perfect storm" of four main factors: excitement for a major platform upgrade (V2), listings on popular exchanges like Binance, a "short squeeze" that forced rapid buying, and a prestigious award from BNB Chain that boosted confidence.
Is MYX a good investment?
Like all cryptocurrencies, MYX is a high-risk, high-reward asset. Its recent performance has been incredible, but the market is very volatile. This article is for educational purposes, and you should always do your own research (DYOR) and assess your personal risk tolerance before investing.
For ongoing analysis and to discover more exciting projects in the crypto space, don't forget to follow me!
Trade Smart!
Navid Jafarian

GBP/AUD - Triangle Breakout (08.09.2025)The GBP/AUD Pair on the M30 timeframe presents a Potential Selling Opportunity due to a recent Formation of a Triangle Breakout Pattern. This suggests a shift in momentum towards the downside in the coming hours.
Possible Short Trade:
Entry: Consider Entering A Short Position around Trendline Of The Pattern.
Target Levels:
1st Support – 2.0493
2nd Support – 2.0457
🎁 Please hit the like button and
🎁 Leave a comment to support for My Post !
Your likes and comments are incredibly motivating and will encourage me to share more analysis with you.
Best Regards, KABHI_TA_TRADING
Thank you.
Disclosure: I am part of Trade Nation's Influencer program and receive a monthly fee for using their TradingView charts in my analysis.

EURUSD - The Heat Is Still OnHello everyone, what do you think about the trend of FX:EURUSD ?
Today, EUR/USD is experiencing a slight pullback, currently hovering around the 1.169 level after approaching the resistance at 1.177. The first target is aimed at the support zone near 1.163, following a violation below the two EMA lines.
Economic factors from both the Eurozone and the US continue to significantly influence this currency pair's movement. Recent data shows downward pressure on the USD as expectations for a Fed policy easing are being priced in, which continues to support bullish momentum for EUR/USD.
However, from a technical perspective, we expect EUR/USD to slightly correct toward the 1.163 support level before the uptrend resumes.
What do you think? Is this a good opportunity for traders to look for new buying positions? Please share your thoughts in the comments and don’t forget to like the post if you agree with my view!

Gold Analysis – Correction Not Yet Over (IMO)Yesterday, after printing a new ATH at 3674, Gold sold off aggressively and overnight reached a low of 3620.
Now the key question: Is Gold done correcting?
👉 My answer: Not yet.
Here’s why:
1. The 550 pip drop from the top is barely scratching the surface compared to the 3500 pip rally in the last two weeks.
2. Yesterday’s daily candle is a bearish pin bar. While this pattern is weaker in strong uptrends, it can still trigger continuation.
3. Structurally, the market looks like it’s forming an ABC correction. The current rebound may be wave B, with wave C expected to target the 3570 zone.
4. Confluence supports act like magnets once corrections begin. The zone I’m watching aligns with the 23% Fibonacci retracement, which fits perfectly with the correction scenario.
📌 Trading Plan:
As long as 3675 holds, I remain bearish in the short term. The best strategy is to sell rallies against the ATH, targeting deeper retracement levels.
Bitcoin - Important Breakout!Hello Traders!
The Bitcoin price failed to create a new lower low!
The market formed an ascending triangle pattern.
Currently, the resistance level is broken!
So, I expect a bullish move📈
TARGET 1: 116900🎯
TARGET 2: 119000🎯
