Live trade: AUD USD long with explanation It's a 'USD short trade', although NFP was fairly mixed, the higher unemployment number, followed by Hassetts comments suggesting rates can go a lot lower, 'should' weigh on the dollar.
I've once again gone with the AUD but you could make a case to long any of the currencies', the CAD in particular has momentum but is sitting at daily support.
Arguably JPY short is also an option but the yen could be volatile with the BOJ meeting this week.
I've gone with a 20pio stop loss and 25 pip profit target up to 4hr resistance.
The risk to the trade is negative market sentiment or 'hawkish FED speak.
Livetrading

NQ Bear FlagLooking at the chart here still room down going off my levels from last week would need to break out of this flag to have any room up

ETH/USDT : LIVE TRADEHello friends
you can see that a spike has formed and then the price has ranged.
Now with a valid breakout from above and a breakout from below, buyers can push the price to the specified points.
This analysis is purely technical and is not a buy or sell recommendation. So please refrain from emotional behavior.
*Trade safely with us*

AUD USD long: live trade with explanation It took a little while for the market to make up its mind. But the ultimate takeaway from the FOMC has been that the message wasn't 'too hawkish', putting the USD under pressure against the rest of the currencies.
You could even make a case for long JPY or CHF.
I'm sticking with AUD long because I feel the chart has room to the upside, although 'soft employment data' has taken the wind out of the AUD a little and is a risk to the trade. The other risk being the markets reaction at the US open. But I'm heading out and I'm 'anticipating' USD weakness. Particularly given US jobless claims data.
This is a trade I will leave on through market close until completion, for better or worse.

AUDCAD MUST LONG...✅ AUDCAD – Buy Setup Levels
Entry: 0.91650 (current reaction area)
Take Profit (TP):
TP1: 0.92000 (previous equal highs)
TP2: 0.92200 (upper supply zone)
Stop Loss (SL):
SL: 0.91495 (below demand zone + liquidity sweep)

btc live tradeHello friends
Given the sharp upward movement we had, you can see that the sellers have made a high, which increases the possibility of a price correction, and we can witness a price increase in the price correction until the specified targets are reached.
This analysis is purely from a technical perspective and is not a buy or sell recommendation, so please observe risk and capital management.
*Trade safely with us*

AVAX/USDT : LIVE TRADEHello friends
Considering the decline I had, you can see that the price has been supported in our support area and the price has grown well.
Now, given the good growth we had, we have a high and low, which is a sign of the entry of sellers, and this means that the price will correct to the specified areas, and from there we can again expect the price to grow to the specified targets.
This analysis is technically reviewed and is not a buy or sell recommendation, so please follow risk and capital management.
*Trade safely with us*

AUD JPY long: 'Risk on trade'. Yesterday's trade stopped out before I even had the opportunity to decide whether to take close it before end of day.
With hindsight I perhaps should have been more patient and waited for a pullback.
We've now had a pullback and nothing has happend to alter my 'risk on' view.
I've reverted to JPY short and I'm sticking with AUD long. You could make a case to place any form of 'risk on' trade.
The risks being, negative market sentiment or subdued 'action' ahead of the FOMC meeting.
I've gone with a 20 pip stop loss and 25 pip profit target.
I will leave the trade running through the BOC but close before the FOMC meeting, which has the potential to shape the markets tone into year end.
Interesting day ahead and I wouldn't like to predict to outcome and reaction to the FOMC meeting.

AUD CHF long: With reasoning I've gone with the 'hawkish AUD rhetoric' Vs the weak CHF momentum, backed up by suggestions the SNB nay well offer a 'dovish hold' on Thursday.
Given HASSETT'S comments, there is a case to say USD is the better short option, but in this moment, the USD has momentum Vs the CHF.
The other option would be JPY short and I might be wrong in thinking the yen is due a pullback.
The risk to the trade is negative sentiment, it also feels quite a bold trade as the chart might also pullback.
I will update at 8:30 UK time as to whether I will hold the trade during market close (if it's ongoing).

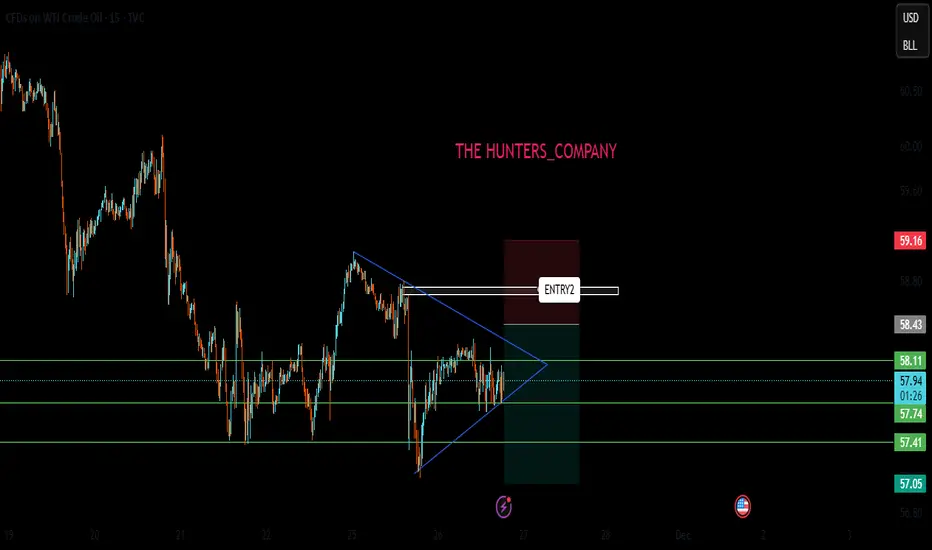
usoil : live tradeHello friends
Well, according to the channel we had, you can see that the sellers broke the specified support with strength and caused the price to fall.
Now, given that it has become clear to us that the power is in the hands of the sellers, we can re-enter the sell trade if the price rebounds or pullbacks in the specified area, of course with the necessary confirmations...
This analysis is purely technical and does not constitute a buy or sell recommendation, so please observe risk and capital management and avoid emotional movements.
*Trade safely with us*

GOLD Consolidation Starts (Correction zone) Buyers Slow ExitNow after the all time high of 3482.
GOLD enters into a Consolidation zone Starts or (Correction zone) Buyers Slow Exit.
So at current market price 4180 Sell and again buy at 4000 and again sell at 4170 range and again buy at 3890 and again sell at 4050 and again buy at 3890 and again sell at 4160 and again buy at 3737.
This is for Education Purpose only, am still testing WD Gann theory!

Live trade: CAD JPY long, fundamental analysis The overall market mood remains positive and following a brief period of 'UEDA hike chatter strength', the JPY is weakening again.
You could put forward a case to long any of the currencies Vs the JPY as a 'risk on' trade. I've chosen the CAD as has it has maintained Friday's 'post GDP positivity'.
The risk to the trade is negative market sentiment, BOJ hike chatter, possibly the falling oil price, or, once again, the stop loss is 'only' behind a 15min swing.
I will hold the trade through market close if required.

XRP/USDT : LIVE TRADEHello friends
Given the growth we had, the price has now broken its trading range strongly by sellers and our trend has also been broken, which is likely to push the price down.
Observe risk and capital management and avoid emotional behavior.
*Trade safely with us*

USOIL : LIVE TRADE
Hello friends
Well, considering the downtrend and the power of the sellers, we should also follow the trend and go to the side of the one who has the power.
Given the price drop, if the price pullbacks, we can see the price drop again.
This post is not a buy or sell offer and is only reviewed from a technical perspective.
Observe risk and capital management and avoid emotional movements.
*Trade safely with us*
BITCOIN:LIVE TRADEHello friends
considering the decline we had, the sellers made a bottom and the buyers came in. The sellers again broke the previous bottom with strength and made a bottom, and the buyers came in and raised the price and succeeded in hitting a higher ceiling.
And in the pullback, the open price is supported and here we can enter a buy transaction considering the support of buyers and hitting a higher ceiling, of course with risk and capital management and be careful not to make emotional decisions.
*Trade safely with us*

XAUUSD:LIVE TRADEHello friends
Well, we had a decline that we found support for with Fibonacci, and you can see that there was good support from buyers at this point.
We also have a head and shoulders pattern, which is again a positive.
The downtrend line has also been broken, which is also a positive point.
Now, given the arrival of buyers, we can enter the trade and move with it to the specified targets.
Note that the first principle of trading is capital and risk management, so be sure to follow it and avoid emotional behavior.
*Trade safely with us*

USOIL : LIVE TRADEHello friends
Given the bearish structure we had, the price has now been supported by buyers at the specified support several times and we can expect this support to continue.
Observe risk and capital management and avoid emotional and irrational behavior.
*Trade safely with us*

BITCOIN:LIVE TRADEHello friends
You know that this is a risky situation, so observe risk and capital management.
The price has risen after the decline, has collected good liquidity, and now it has fallen again, has collected low liquidity, and is waiting now that this floor has been made, to move to the specified targets. Of course, the opening of the US government is also effective.
Observe capital management.
*Trade safely with us*

EURUSD 5Min: Downtrend Continuation - Failure Trade Execution Setup Analysis:
Price in established downtrend with pullback (discount) to the last posted high. After breaking above this high, buyers failed to show conviction - no follow-through. This signals weakness and validates our sell entry.
Trade Execution:
Entry: 1.15845
Stop Loss (Invalidation): 1.15900
Risk: -5.5 pips
Target: 1.15160 (Fibonacci -23.6% extension)
Initial Risk: Reward: 3.04:1
Trade Management:
After several hours, price approached T1 but reversed before reaching the target. Price came within 1 pip of our target before showing reversal signals.
Decision: Manually closed via mobile for +12 pips profit, protecting gains against the emerging reversal pattern.
How To Behave While In Trade - Five Fundamental Truths:
1️⃣ Anything can happen in the market
2️⃣ Every moment is unique
3️⃣ An edge is just an indication of higher probability
4️⃣ There will be random distribution between wins and losses
5️⃣ I don't need to know what happens next
Key Lesson: Sometimes taking partial profits or closing early based on price action is better than waiting for a full target. Mechanical trading includes reading price behaviour and protecting your gains.
Outcome: ✅ Closed manually for +12 pips profit due to reversal pattern near target.
This is the WavesOfSuccess methodology - React to price, manage risk, protect profits.
👍 Boost if you found this valuable
👤 Follow for more live trade breakdowns

Gold Bullish Continuation from Demand ZoneThis XAUUSD (Gold) 30-minute chart shows a recent bullish move after breaking structure and forming higher highs. Price has pulled back into a small demand zone (highlighted in purple), suggesting a potential continuation to the upside. The marked arrow indicates an expectation of a bounce from this demand zone, aiming for further bullish momentum toward higher levels.

XAU/USD 30-Min Smart Money Concept Analysis with Buy & Sell The chart displays a 30-minute timeframe of the XAU/USD (Gold vs. U.S. Dollar) with a Smart Money Concepts (SMC) analysis. It highlights a **Break of Structure (BOS)** followed by a **demand zone retest** marked as a potential entry point. Two trade scenarios are mapped: a **buy setup**, expecting a bullish continuation above the 3,891.093 level, and a **sell setup**, forecasting a bearish move towards a lower demand zone around the 3,844.000–3,852.000 range if price fails to hold the current support. The analysis is based on order blocks, price action, and market structure shifts, aiming to capitalize on institutional trading behavior.

XAUUSD Eyes Bullish Reversal After Retracement to Key DZThe 30-minute chart for XAUUSD (Gold vs US Dollar) illustrates a potential bullish scenario following a recent market structure shift. Price has shown a strong recovery from previous demand zones, marked by bullish order blocks. The current outlook suggests a short-term dip into the blue demand zone around $3,835–$3,840, followed by a possible rally targeting the "Weak High" near $3,865. This move could be driven by liquidity grabs below recent lows before a bullish continuation, making it a key level to watch for intraday traders.

XAUUSD Bearish Dip Toward Demand Zone Before Potential ReboundThis 30-minute gold (XAU/USD) chart shows a sharp drop after rejecting resistance around the $3,870 zone, where a weak high was formed. Price broke structure (CHOCH) and is currently retracing lower, targeting the demand zone between $3,750–$3,770. The projection suggests a possible rebound from this support area, with the potential to recover back toward the $3,860 resistance region, aligning with the marked weak high. This indicates a short-term bearish move followed by a bullish correction.
