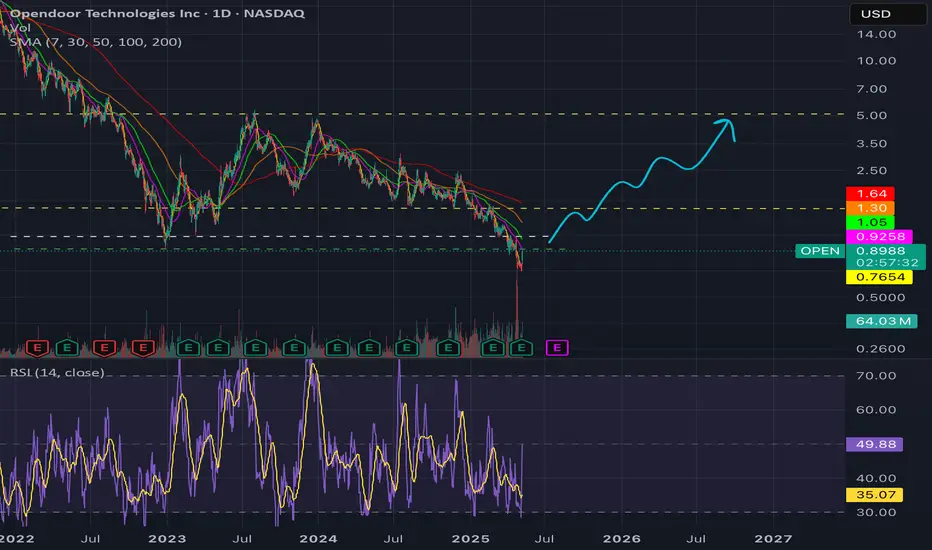
$OPEN asymmetric risk/reward- Market cap is super low and rate cuts could fuel a multi bagging opportunity
- Risk of going bankrupt is not a concern for at least 2 years.
- Good R/R for a swing.
Longsetup
Gold price maintained above 3400⭐️GOLDEN INFORMATION:
Gold prices surged over 1% on Monday as both the US Dollar and Treasury yields declined sharply, driven by ongoing uncertainty surrounding trade negotiations, despite a generally positive risk tone in broader markets. At the time of writing, XAU/USD trades at $3,397, having rebounded from daily lows of $3,338.
While risk sentiment has improved ahead of upcoming US corporate earnings releases, anxiety lingers as the August 1 tariff deadline set by the White House approaches. Investors remain cautious about potential trade disruptions between the US and its key partners—the European Union (EU), Canada, and Mexico.
Meanwhile, reports from Bloomberg indicate that EU officials are preparing to convene this week to finalize a retaliation strategy, should trade talks with President Trump collapse. This backdrop of trade tension continues to support gold’s safe-haven appeal.
⭐️Personal comments NOVA:
Gold price continues to increase before FED's statement, market's expectation of early interest rate cut, setting new ATH in Q4/2025
⭐️SET UP GOLD PRICE:
🔥SELL GOLD zone: 3450- 3452 SL 3457
TP1: $3435
TP2: $3422
TP3: $3405
🔥BUY GOLD zone: $3332-$3330 SL $3325
TP1: $3345
TP2: $3358
TP3: $3370
⭐️Technical analysis:
Based on technical indicators EMA 34, EMA89 and support resistance areas to set up a reasonable BUY order.
⭐️NOTE:
Note: Nova wishes traders to manage their capital well
- take the number of lots that match your capital
- Takeprofit equal to 4-6% of capital account
- Stoplose equal to 2-3% of capital account

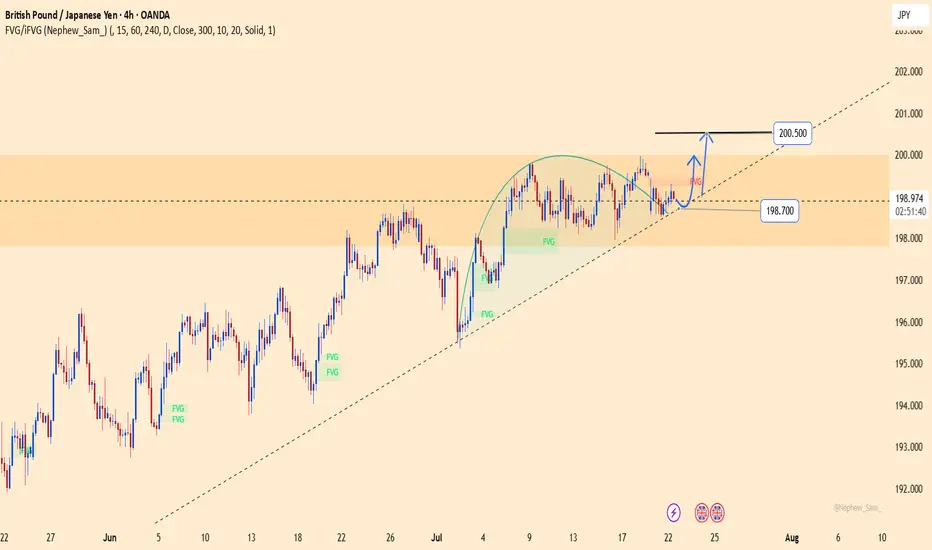
GBPJPY – breakout loading: final leap to 200.500?After days of compression, GBPJPY is flashing clear signs of an explosive breakout.
Price is holding firmly above the ascending trendline and consolidating right at the top of the FVG zone – a strong signal that buyers are preparing to punch through the 200.500 resistance in one decisive move.
Meanwhile, the JPY continues to lose ground as the BoJ shows no clear intention to hike rates, while GBP gains support on expectations that the BoE will maintain its hawkish stance longer due to persistent core inflation.
Trade setup (reference):
Buy limit: 198.900
SL: below 198.500
TP: 200.500
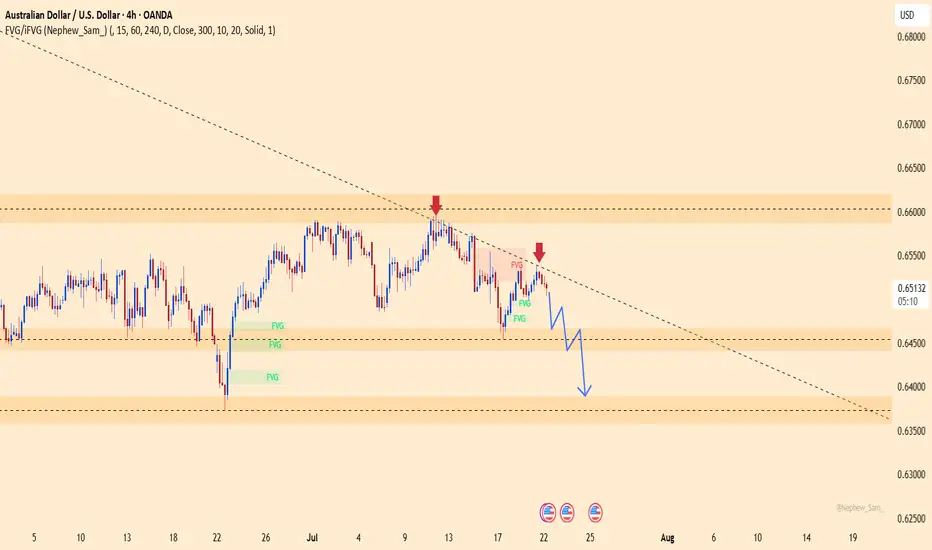
AUDUSD – Sellers taking over, the drop is on!This pair just got slapped hard at the descending trendline, right as it hit a familiar resistance zone. No more doubts – buyers are losing steam, and sellers are waiting to strike.
Market sentiment from Down Under is shaking, with weak economic signals piling up. Meanwhile, the mighty U.S. dollar is reclaiming the spotlight after gold’s flashy surge. The tide has turned!
Unless a miracle shows up, AUDUSD is set to dive deeper – and this is the perfect stage for traders who thrive on strong downtrends.
Sellers are in position – are you ready to join the ride?
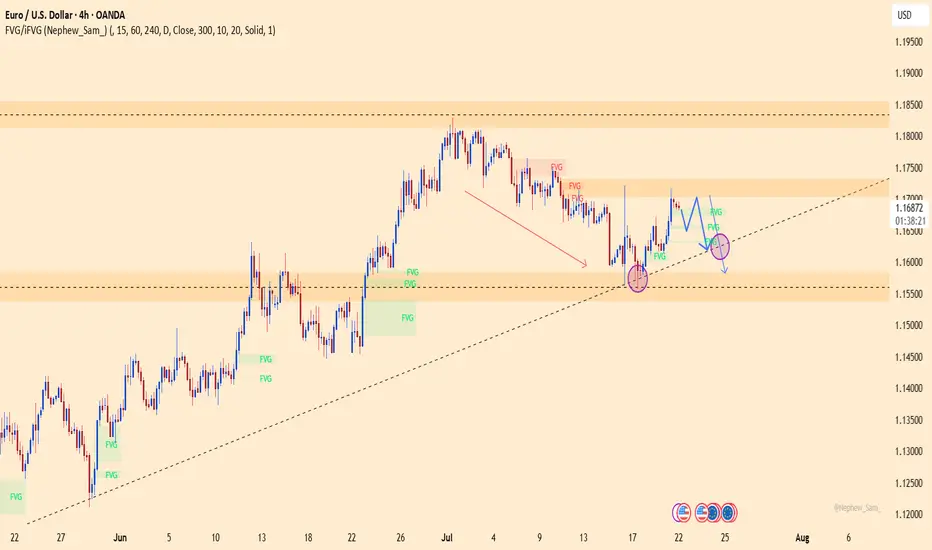
EURUSD – Is the rally over? Time for a collapse?The technical picture reveals that EURUSD is losing momentum after a brief rebound. The 1.1700 level stands as a key resistance – if bulls fail to break it, the bears will take the wheel! A clear scenario is forming: lower highs, FVGs filled, and a potential drop toward the 1.1580 support zone this week.
The bad news for the euro isn’t over: yesterday’s Eurozone PMI data disappointed heavily, signaling stagnating growth. Meanwhile, the USD is gaining traction from strong labor data and hawkish Fed remarks, putting EURUSD under double pressure.
If the ascending trendline breaks, EURUSD could plunge even further – get ready for a potential breakdown!
Suggested strategy: Prioritize SELL below 1.1700, with a short-term target at 1.1580.
Stop-loss: Above 1.1720 – a breakout here would invalidate the bearish setup.
ALK LOOKING BULLISH 22 JULY 2025ALK is looking good to go long at current price. I am going long as it looks very good. If you dont understand a trade then don't push yourself.
NOTE: LONG WITH STOCKS ONLY

HBAR Game Plan: Short the Bounce, Long the Liquidity GrabHBAR has been moving strongly and is currently offering both short and long trade opportunities based on a clean potential ABC corrective pattern, key fib levels, volume profile, and anchored VWAP. Let’s break down the setup.
🧩 Technical Breakdown
Higher Timeframe Confluence:
0.618 fib retracement from the macro move
1.618 trend-based fib extension
1.272 VWAP band resistance
Point of Control (POC) from the visible range profile
This is marked as a major take profit/short opportunity zone.
For extra confluence, the negative fib extension golden pocket (-0.618 to -0.666) also aligns right at this resistance zone
Current Structure:
We’re potentially completing wave B of an ABC corrective move
Price has retraced into a high-probability short zone
🔴 Short Setup
Entry Zone:
Between the 0.702 and 0.786 fib retracement levels
Why Here?
0.702–0.786 fib retracement → short zone for reversals
Potential wave B top → setting up for a C leg down
Target (TP):
Around $0.25–$0.24, near the expected wave C completion
🟢 Long Setup
Entry Zone:
~$0.25–$0.24 area.
Why Here?
This zone is a strong confluence area:
➡️ 0.786 fib retracement
➡️ 1.0 trend-based fib extension of ABC
➡️ Anchored VWAP from the entire trend, offering dynamic support
➡️ Liquidity pool
➡️ Previous weekly Open
Plan:
Wait for price to complete wave C into this zone, then look for bullish reaction signs to enter long.
💡 Educational Insight
Why the 0.702–0.786 short zone?
These fib levels are often overlooked but are key “hidden” zones where wave B tops out before C waves.
Why anchored VWAP?
Anchored VWAP gives you dynamic institutional support/resistance, especially when aligned with fibs and liquidity.
Why wait for confirmation?
Blindly longing or shorting levels can trap you. Wait for SFPs, wick rejections, or lower timeframe structure flips to boost trade probability.
Final Thoughts
HBAR is in a highly interesting zone, offering both:
A short setup into the C wave,
And a long setup at the C wave completion, backed by multiple confluence factors.
Let the levels come to you and wait for confirmation!
_________________________________
💬 If you found this helpful, drop a like and comment!
Want breakdowns of other charts? Leave your requests below.

Continued price increase - gold increased to 3450⭐️GOLDEN INFORMATION:
Gold prices climbed for a second straight session on Tuesday, gaining over 0.9% as sliding US Treasury yields continued to weigh on the US Dollar. Investors remained cautious amid lingering uncertainty over upcoming US trade agreements. At the time of writing, XAU/USD is trading at $3,427, having rebounded from an intraday low of $3,383.
Yields on US government bonds have now declined for five consecutive days, pressuring the Greenback—reflected in the softer US Dollar Index (DXY). Heightened speculation that the US and European Union (EU) may fail to secure a trade agreement before the looming August 1 deadline has intensified demand for safe-haven assets. As a result, gold surged to a five-week high of $3,433.
⭐️Personal comments NOVA:
Gold price continues to increase, FOMO from the market is good and positive. Heading towards 3450
⭐️SET UP GOLD PRICE:
🔥SELL GOLD zone: 3449- 3451 SL 3456
TP1: $3435
TP2: $3422
TP3: $3405
🔥BUY GOLD zone: $3380-$3378 SL $3373
TP1: $3390
TP2: $3400
TP3: $3415
⭐️Technical analysis:
Based on technical indicators EMA 34, EMA89 and support resistance areas to set up a reasonable BUY order.
⭐️NOTE:
Note: Nova wishes traders to manage their capital well
- take the number of lots that match your capital
- Takeprofit equal to 4-6% of capital account
- Stoplose equal to 2-3% of capital account

ADA / USDT lying on support ,ready to bounce and break trendlineADA/USDT broke above horizontal resistance and is now retesting from the trendline above. If it holds this support and bounces, a strong move toward $1.00, $1.20, and even $1.40 could follow. One to watch closely in the coming days.

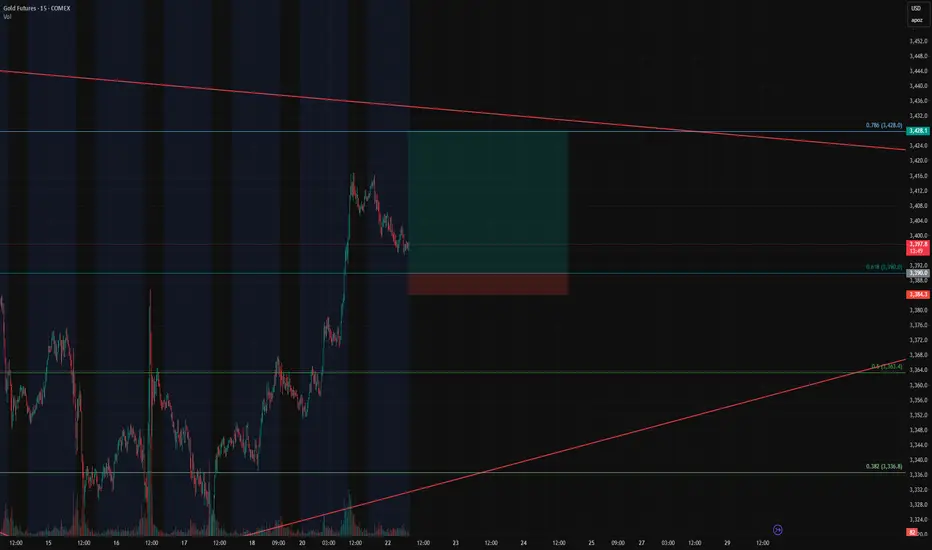
Gold Futures Long Setup – Breakout Continuation off the 0.618 FiGold Futures Long Setup – Breakout Continuation off the 0.618 Fib
Instrument: Gold Futures – COMEX ( COMEX:GC1! )
Timeframe: 15-Minute
Trade Type: Long – Breakout Continuation
Entry Zone: 3390 (0.618 Fibonacci retracement)
Take Profit: 3428 (0.786 Fib)
Stop Loss: 3384
Risk/Reward Ratio: 6.68
Setup: Bullish Flag on Retest
🔍 Trade Thesis
This trade is part of an ongoing breakout continuation strategy we've been trading, and now we're eyeing a pullback entry as price returns to a key retracement level.
Price nearly exploded through the 0.618 Fibonacci level (3390) during the prior breakout.
Now it's pulling back in a textbook bullish flag formation, suggesting healthy consolidation before the next leg.
The 0.618 retracement is aligning with previous intraday structure and trendline support — making this an ideal level to scale in.
This is a high R:R continuation play, with targets set at the 0.786 Fib level (3428) — right before macro resistance kicks in.
🎯 Entry & Exit Strategy
Entry: As price touches 3390 or forms bullish confirmation at the level.
Stop Loss: 3384 – tight and below key fib/flag structure.
Target: 3428 – based on 0.786 Fib extension and breakout continuation projection.
📊 Why This Works
Breakout behavior: Price respected the breakout impulse and retraced cleanly into a bull flag.
Fib confluence: 0.618 pullbacks are a classic entry in trending markets.
R/R of 6.68: Excellent reward profile vs. limited risk.
EURUSD – Recovery losing steam, correction risk is risingAfter rebounding from the trendline support, EURUSD is now approaching the key resistance area around 1.17500 — a zone that has historically triggered multiple rejections. However, with French and German PMI figures coming in below expectations and the ECB holding rates steady without providing any fresh policy guidance, the euro lacks the momentum for a sustained move higher.
On the H4 chart, price action is showing signs of exhaustion as it tests resistance. If buyers fail to break through convincingly, a pullback toward the 1.16800 support zone — or even deeper toward 1.16400 — becomes increasingly likely.
Preferred strategy: Watch for bearish rejection patterns near 1.17500. If confirmed, this could be a favorable opportunity to initiate short positions in anticipation of a correction.

3380 gold price recovered at the beginning of the week⭐️GOLDEN INFORMATION:
Gold prices (XAU/USD) trade with modest gains around $3,350 in early Asian hours on Monday, supported by persistent uncertainty surrounding global trade negotiations as the US tariff deadline approaches. Lingering concerns over fresh levies are likely to sustain demand for the safe-haven metal. Investors now look ahead to comments from Federal Reserve (Fed) Chair Jerome Powell, scheduled for Tuesday, for clearer policy direction.
On Sunday, US Commerce Secretary Howard Lutnick confirmed that August 1 remains the firm deadline for countries to comply with Washington’s tariff demands. While President Trump’s earlier announcements saw shifting deadlines, the White House now insists this date is final. This cloud of uncertainty continues to bolster gold’s appeal as a hedge in volatile markets.
⭐️Personal comments NOVA:
Gold prices continued to recover last weekend, mainly still accumulating above 3300.
⭐️SET UP GOLD PRICE:
🔥SELL GOLD zone: 3380- 3382 SL 3387
TP1: $3370
TP2: $3360
TP3: $3350
🔥BUY GOLD zone: $3322-$3320 SL $3315
TP1: $3333
TP2: $3345
TP3: $3356
⭐️Technical analysis:
Based on technical indicators EMA 34, EMA89 and support resistance areas to set up a reasonable BUY order.
⭐️NOTE:
Note: Nova wishes traders to manage their capital well
- take the number of lots that match your capital
- Takeprofit equal to 4-6% of capital account
- Stoplose equal to 2-3% of capital account

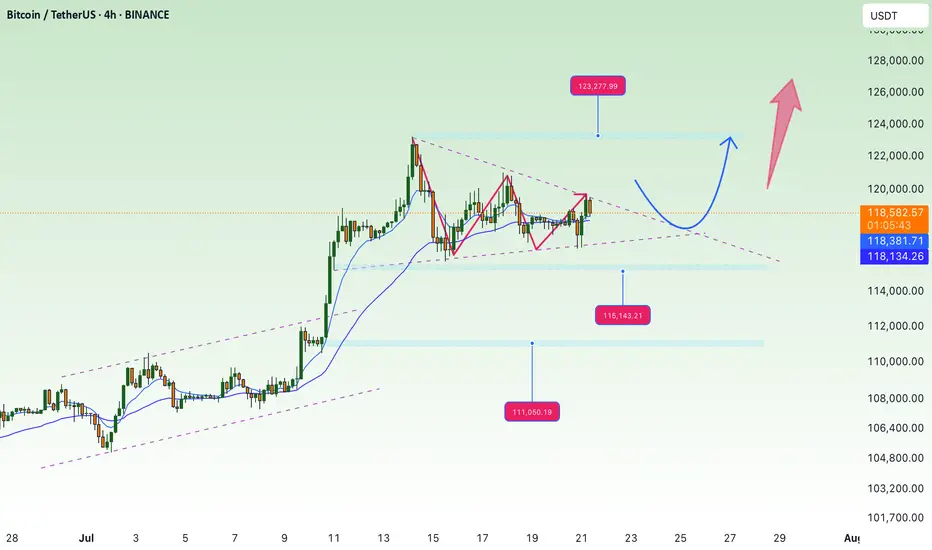
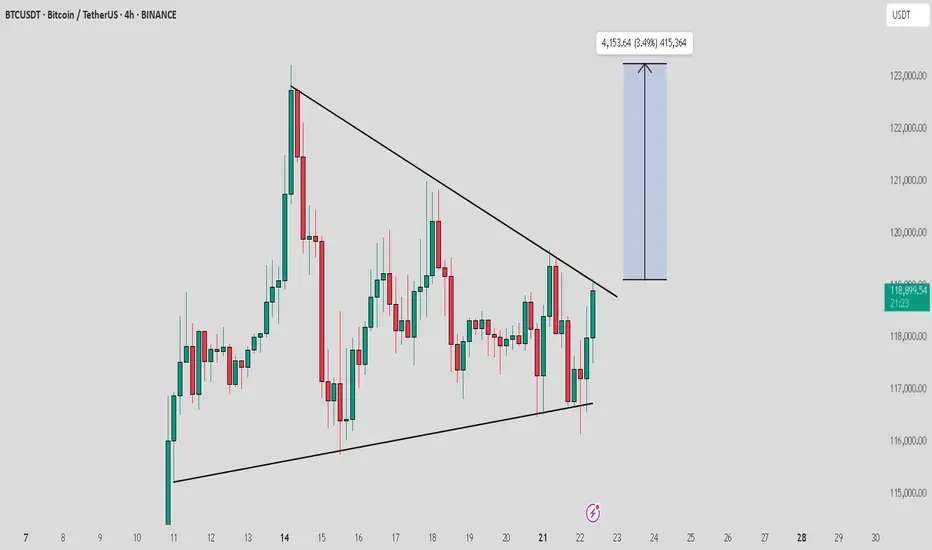
accumulate, continue to aim for new ATH💎 Update Plan BTC (July 21)
Notable news about BTC
CEO of Charles Schwab, Rick Wurster, said the company plans to deploy Bitcoin and Ethereum transactions for customers.
This company aims to compete with Coinbase, where customers buy BTC.
This development takes place after the progress of cryptocurrencies when President Donald Trump signs the Genius bill into law.
In an interview on Friday, the CEO of Charles Schwab, Rick Wurster, said the company plans to launch Bitcoin (BTC) and Ethereum (ETH) to compete with Coinbase cryptocurrencies. The move took place after President Donald Trump signed the Genius bill, officially confirming the first cryptocurrency law in the United States.
Technical analysis angle
🟠 Main trend:
BTC is sideway accumulated in the amplitude of 117,000 - 122,000 after a sharp increase.
The chart shows the descending triangular model - a potential sign for Breakout.
🔍 important areas:
Resist:
122,000 - 122,700: Strong resistance area, fibonacci mold 1.0.
130,600 - 131,100: The expected area if Breakout is successful (Fibonacci extension 1.618).
Support:
116,000: Support close, coincide with EMA 200.
111,100: The support area is stronger if the current support breaks.
✅ Scenario 1 - Rise:
If the price turns from supporting 116k → Test the resistance area of 122k.
If the 122K break is definitive, the next goal is 130k - 131k.
❌ Scenario 2 - Discount:
If the 116k area is lost, the possibility of falling will fall more deeply at 111k.
This is also the strong EMA area Fibo 0.382 of the previous wave.
Please follow the channel to receive the latest and continuous updates on XauUSD, currency and BTC
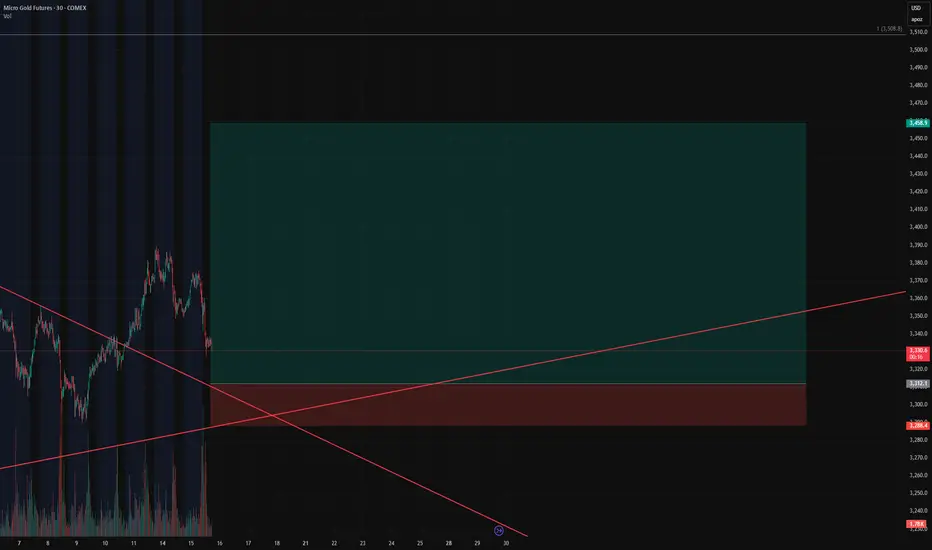
Gold Bulls Loading Up – Our Short Squeeze Trigger is Set!🚨 Gold Bulls Loading Up – Our Short Squeeze Trigger is Set!
We’re flipping the script on COMEX_MINI:MGC1! After a prolonged downtrend and textbook wedge compression, our breakout long is LIVE – but not without trapping the late shorts first.
💥 Entry: $3,312.1
🛑 Stop: $3,288.4
🎯 Target: $3,458.9
🧮 Risk/Reward: 6.19
Price just bounced at the retest of the wedge apex, and volume is confirming the move. If this holds, we’re riding momentum all the way up – and letting short pressure fuel the breakout.
📈 Trendline breached.
⏳ Time compression converging.
⚠️ If you’re still short, watch your stops!
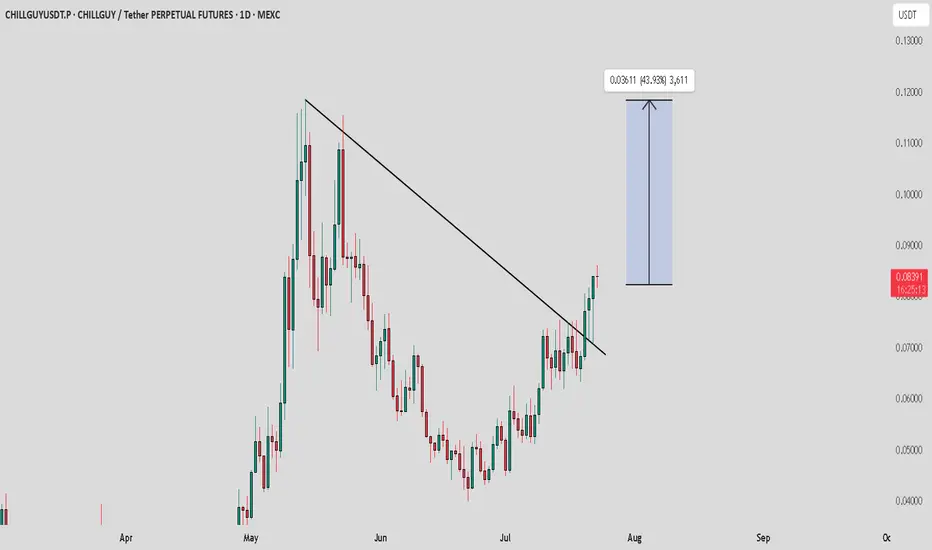
CHILLGUY / USDT : Trend shift and Retest confirmedChillGuy/USDT - Trend Shift & Retest
ChillGuy/USDT has fully shifted its trend, and after a successful retest, we expect a strong pump towards $0.10 - $0.12 soon.
Bullish Scenario:
Successful retest confirms the trend shift, leading to a potential move towards $0.10 - $0.12.
Pro Tip:
Keep a close watch for any signs of weakness or reversal before entering.
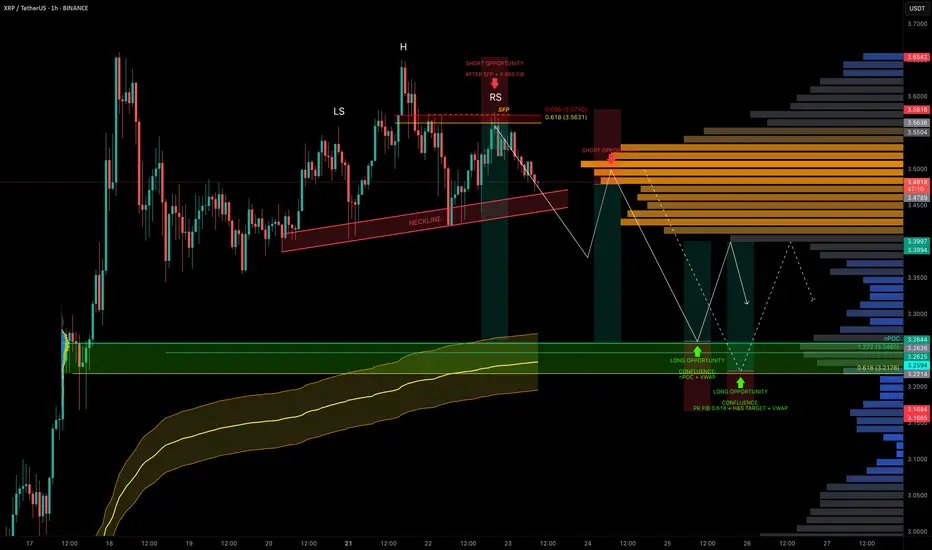
XRP Coiled in Range — Liquidity Below, Trade Setups AheadXRP has been stuck in a trading range around $3.50 for the past 5 days, offering multiple trade opportunities within the chop.
A notable short was triggered after a swing failure pattern (SFP) at the 0.666 fib retracement level near $3.563.
Now, with liquidity building to the downside, we’re watching closely for the next high-conviction setups.
🧩 Current Structure & Short Setup
🔴 Short Opportunity (Triggered):
SFP + 0.666 fib retracement at $3.563 led to rejection.
Market now shows a head & shoulders pattern forming.
Target: $3.2176 (0.618 fib retracement).
Trigger: Watch for a neckline break + retest for short confirmation.
Stop-loss: Above the right shoulder.
🟢 Long Setup:
Watching for a high-probability long around:
$3.26 → nPOC + 1.272 TBFE
$3.23 → anchored VWAP bands
This zone offers strong confluence and could act as the next launchpad.
Long Trade Plan:
Entry Zone: potential entries between $3.26–$3.22, price action needed for confirmation
Stop-loss: Below swing low at $3.1675
Target (TP): ~$3.40
✍️ Plan: Set alerts near the lows and react to price action at the zone — don’t front-run, let structure confirm.
💡 Pro Tip: Trade the Confluence, Not the Emotion
High-probability trades come from confluence, not guessing.
This setup combines nPOC, TBFE, VWAP, fib levels, and classical market structure (H&S) to map precise zones for both longs and shorts.
Let price come to you and wait for confirmation — especially in a rangebound environment where liquidity hunts are frequent.
Final Thoughts
We’re still rangebound, but liquidity is building below.
Keep an eye on the $3.26–$3.22 support zone for long entries and the H&S neckline for short breakdown confirmation.
_________________________________
💬 If you found this helpful, drop a like and comment!
Want breakdowns of other charts? Leave your requests below.
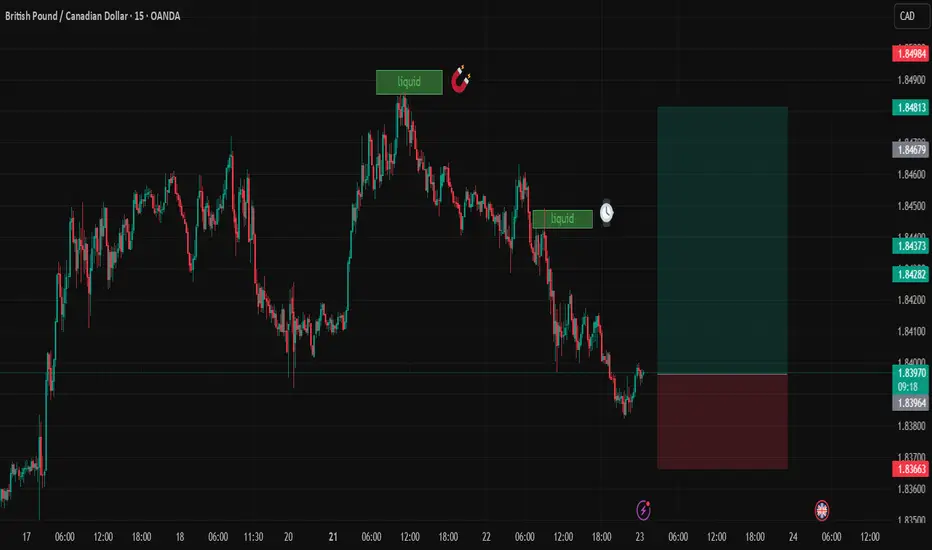
GBPCADDate:
July 23,2025
Session:
Tokyo and London session
Pair:
GBPCAD
Bias:
Long
2 liquidity pools that are waiting to be swept this week. Looks like price is gonna be magnetized towards these levels during London and Tokyo. The trade may even stretch into NYC.
Entry: 1.83970
Stop Loss: 1.83674
Target: 1.84811
RR: 2.82
Solid setup for $DLTR in 2025 : $95-$105- NASDAQ:DLTR is a nice turn around story for 2025. It is showing great strength when the market is red.
- Any fear around recession will skyrocket this stock. This is by far one of the best risk/reward setup which provide gains when the market is red or is going under correction of some sort.
- It's a better buy than its peer NYSE:DG as headwinds for NASDAQ:DLTR are temporary and can be resolved as compared to NYSE:DG which has headwinds which will take time.

BTC / USDT near to breakout from trendline resistanceBTC is testing its trendline resistance after a steady buildup. A successful breakout could trigger a strong move toward the $122,000–$125,000 range. Worth watching closely in the coming sessions.
XAUUSD – Strong bullish structure, buyers in control!Gold is trading within a well-defined ascending channel, with each higher low being consistently respected – indicating strong buying pressure. The recent move broke through a fair value gap (FVG) and is approaching short-term resistance. High-probability scenario: a pullback toward the rising trendline, followed by a strong rebound aiming for the previous highs.
RSI remains in a positive zone, supporting the bullish bias. If the trendline support holds, the next target is the upper resistance area.
Supporting news: The US dollar has stalled after a sharp rally, while persistent inflation concerns and renewed hopes for a mild Fed rate cut are boosting gold’s appeal.

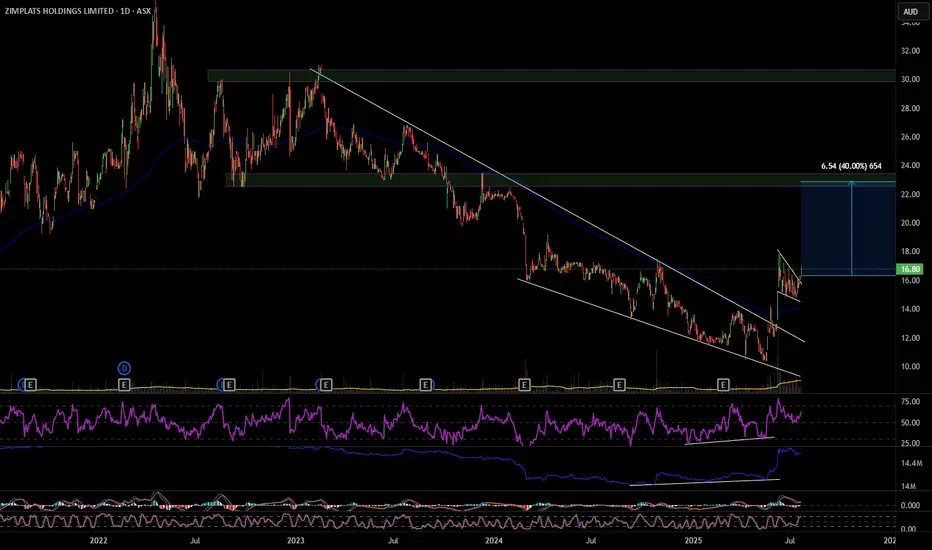
ZIM 40% move up
ZIM has broken out of a descending wedge with bullish RSI and OBV divergence, also multiple divergences on smaller time frames. On the hourly it's had a pull back and formed a bull flag that it has also broken out of. ZIM looks to have formed a change of structure forming higher highs and higher lows, my first target will be $22.90 a move of 40%. Definitely one to consider. Good luck and happy trading 🍀
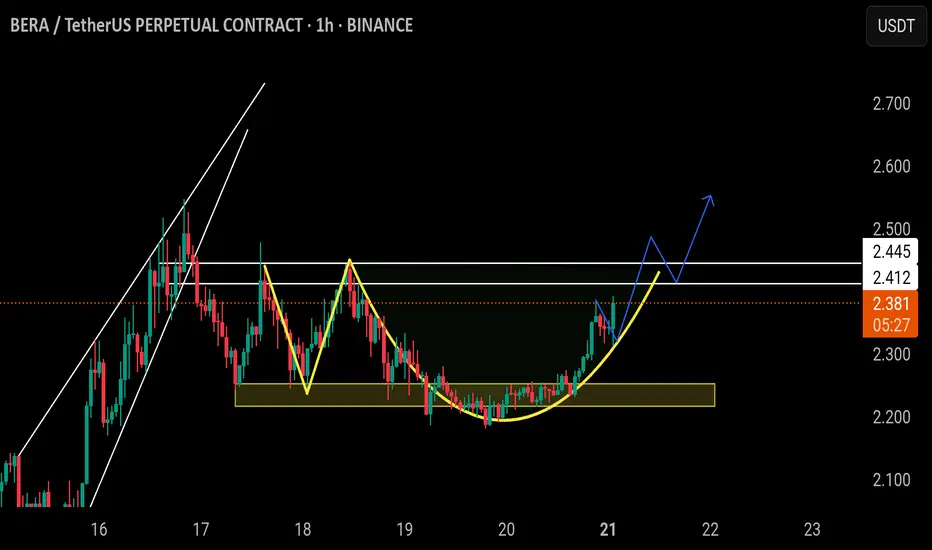
$BERA/USDT | READY TO FLY (ADAM AMD EVE PATTERN)BINANCE:BERAUSDT.P
$Bera/Usdt
The price is forming Adam and even pattern, if the price able the break above the white lines resistance, following a successful retest, the price will go higher and higher.
Aggressive entry at Current market price.
Safe entry after the breakout of white lines resistance following a successful retest of the white lines.
NFA DYOR
Bearish or bullish? Analysis:
Daily outlook:
- if market moves to to the daily key level, and make a short term bounce or sweep
will take longs setups
- if market moves sharply through the Daily key level, will look for short setups
