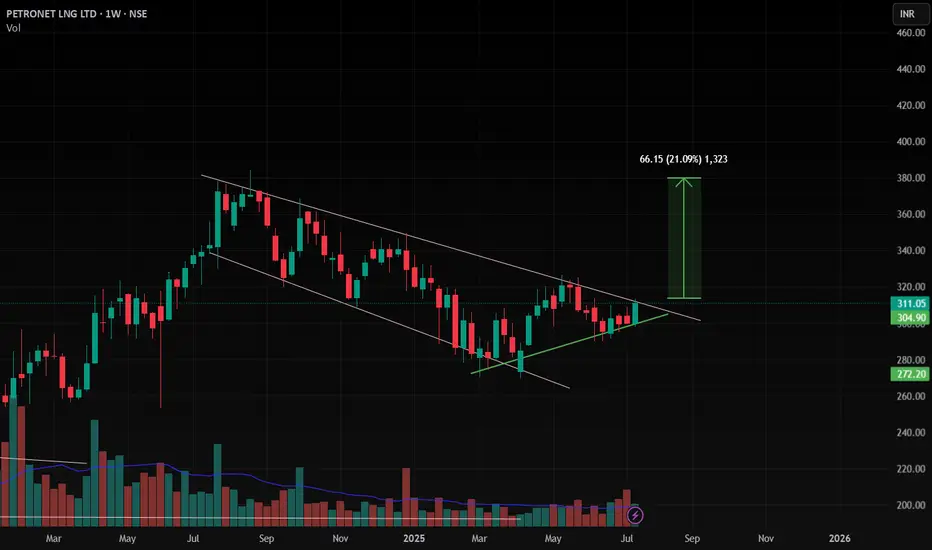
Petronet , 1W , BullishAs the Pattern is Formed and Ready for Breakout , enter after strong candle close in weekly Timeframe and put SL below Swing low . follow proper risk management
follow for more swing ideas like this
Longsetup
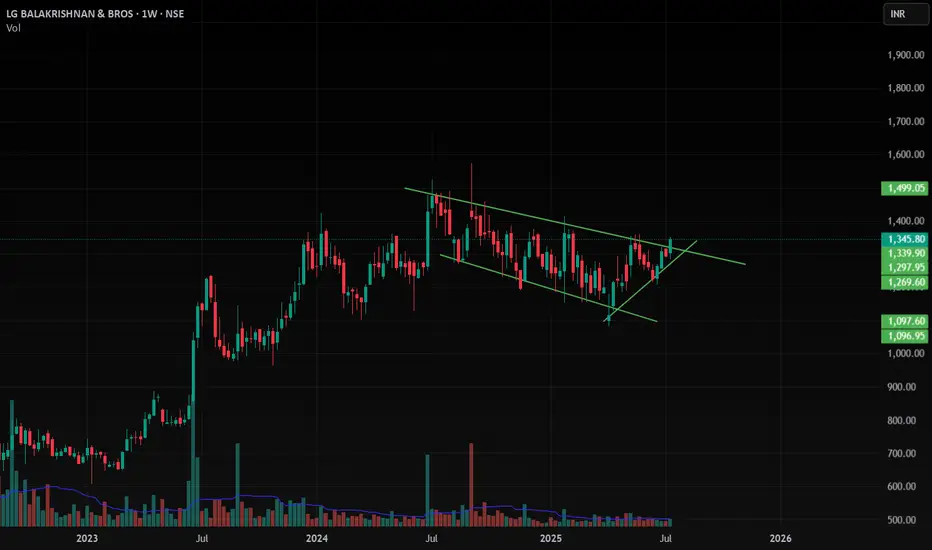
LGBBROSLTD , 1W , Bullish NSE:LGBBROSLTD as the channel pattern is Broken , wait for proper Close in Weekly then enter with proper risk management ,
put SL below its swing low
Follow for more swing ideas like this
TAJGVK , 1D , Bullish as this stock given breakout from the Triangle Pattern with Good Volume , this stock is ready to Enter .
put SL below its swing low
follow more swing ideas like this .

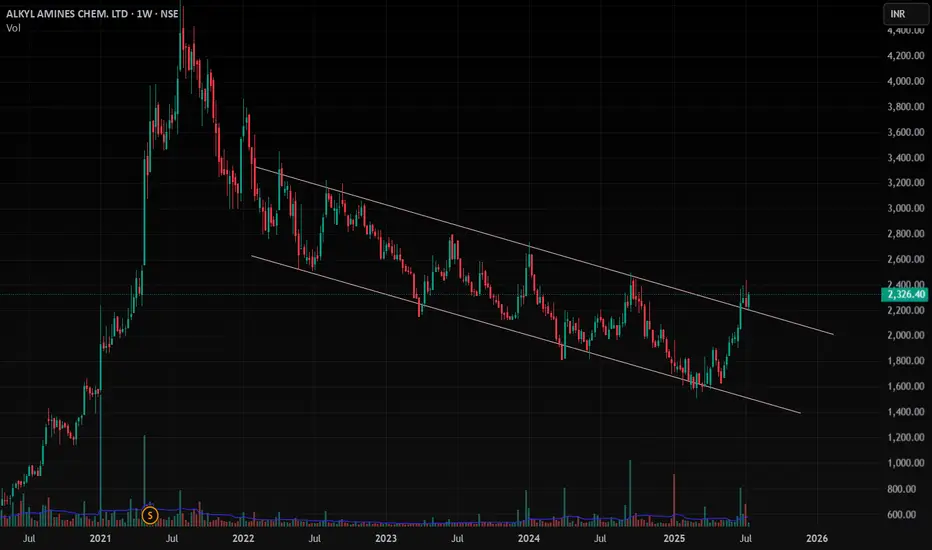
ALKYLAMINE , 1W , Bullishas this stock is given good breakout and now it is at Retest Point and You can enter with Good position Size with very minimal Risk
put the SL below the Swing Low . Take risk according to your position size
Follow for More Swing Ideas Like this
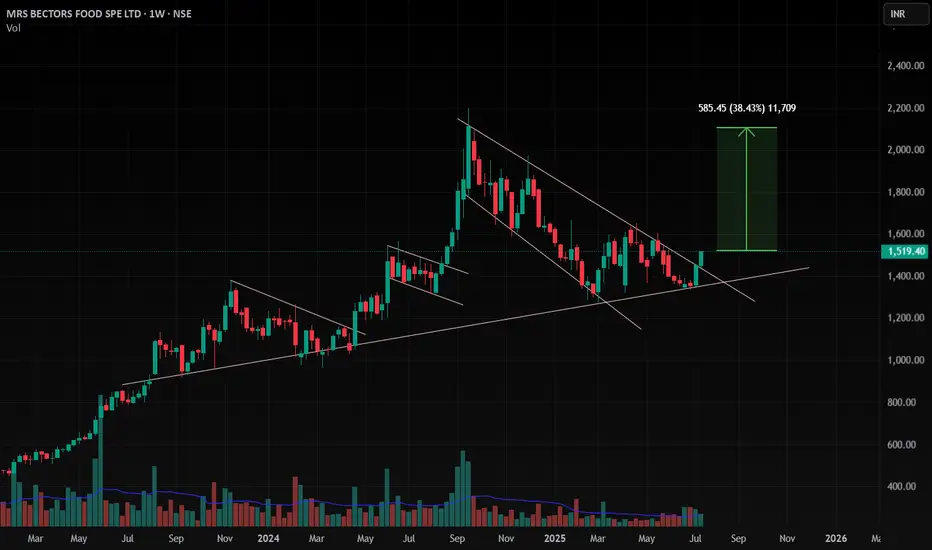
BECTORFOOD , 1W , Bullish As the trendline is giving support at below and formed a good pattern and given breakout with good close in weekly and daily .
This stock is ready to enter into this
Follow for more Ideas like this
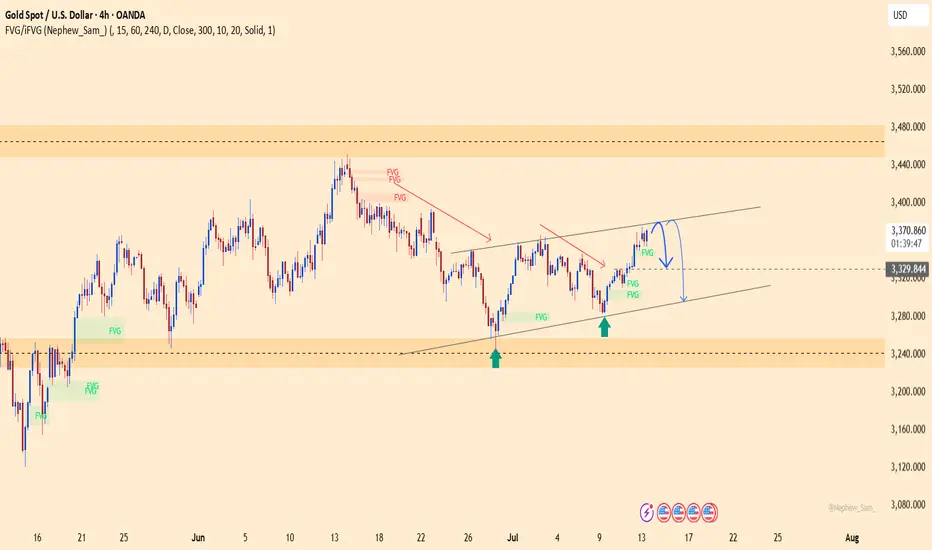
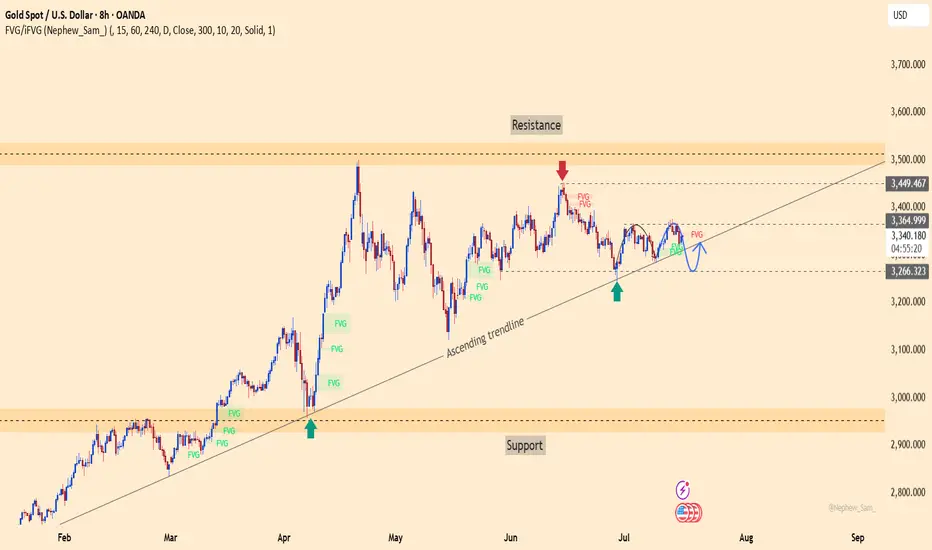
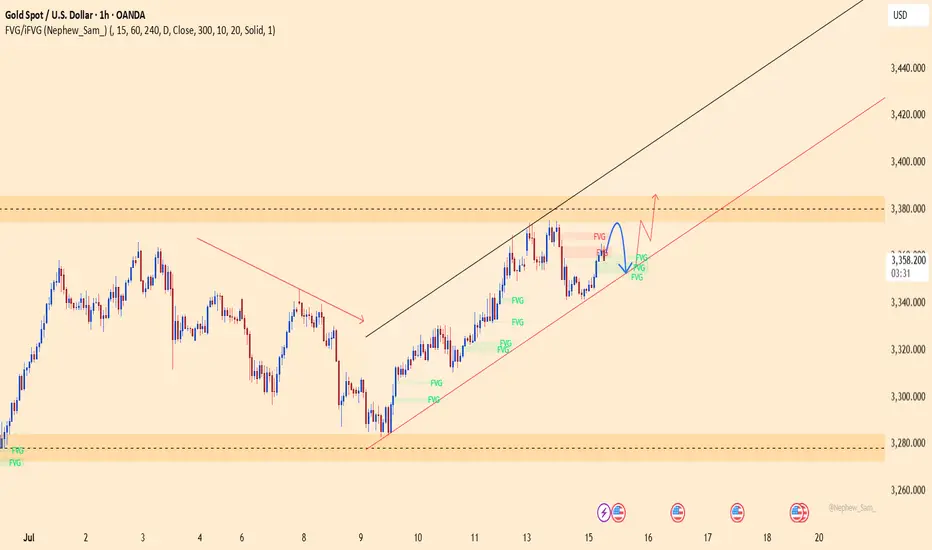
xauusd – is gold coiling up for a breakout?After multiple retests of the ascending trendline since March, gold (XAUUSD) continues to hold a solid bullish structure. While it hasn’t decisively broken through the 3,366 resistance, price action suggests that buyers are still in control. The repeated appearance of FVG zones signals smart money accumulation beneath the surface.
On the news front, U.S. PPI data came in at a 0.2% increase — exactly in line with expectations. This neutral result hasn’t given the USD a strong push, which may allow gold to maintain or even inch higher in the short term.
As long as the 3,265 support zone holds, the path remains open for a move toward the 3,449 target area. This might be the final consolidation before a powerful breakout. The question is: are you ready to ride the next leg up?
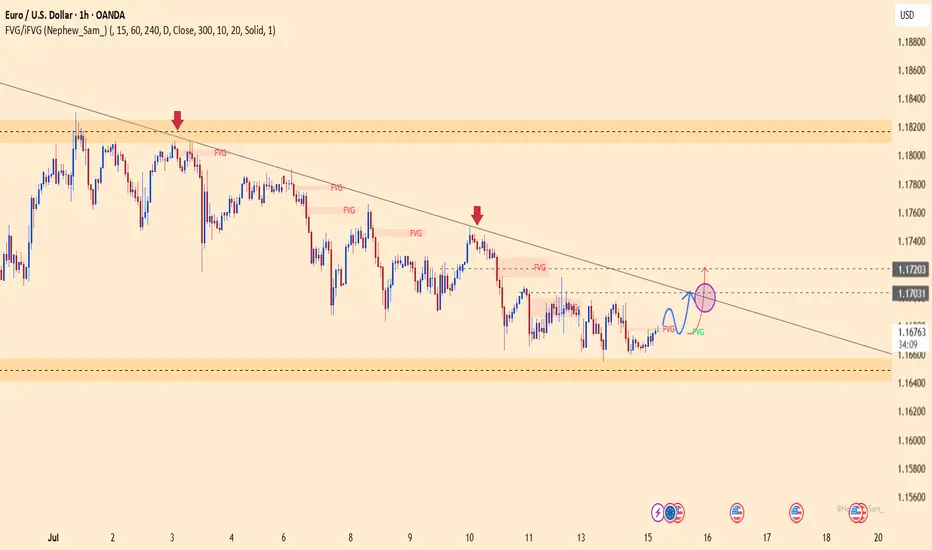
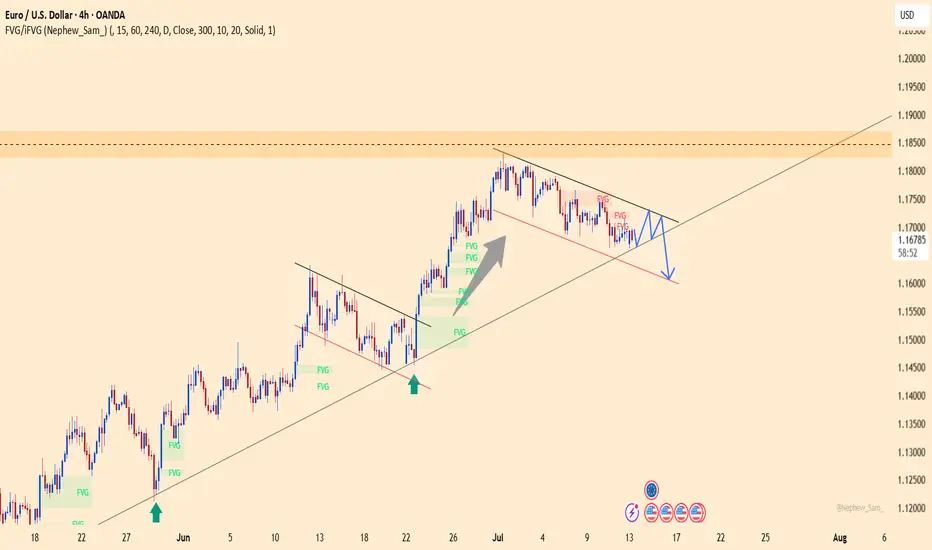
EURUSD – Weakness emerges at descending channel resistanceEURUSD remains within a well-defined descending channel and was recently rejected at the upper trendline – a key dynamic resistance zone. Price action shows the recovery is limited around 1.16600, with multiple FVG (Fair Value Gap) zones reinforcing the potential for further downside.
On the news front, the euro remains under pressure as Eurozone inflation data brought no surprises, while the US dollar is supported by June’s PPI rising exactly as expected at 0.2%. This combination leaves EURUSD with little momentum to break higher, making a move back toward the 1.15300 support area a scenario to watch.
If the price fails to break above 1.16600 and forms a lower high, the bearish trend will be further confirmed. Keep an eye on price behavior around the FVG zones to identify optimal entry points.

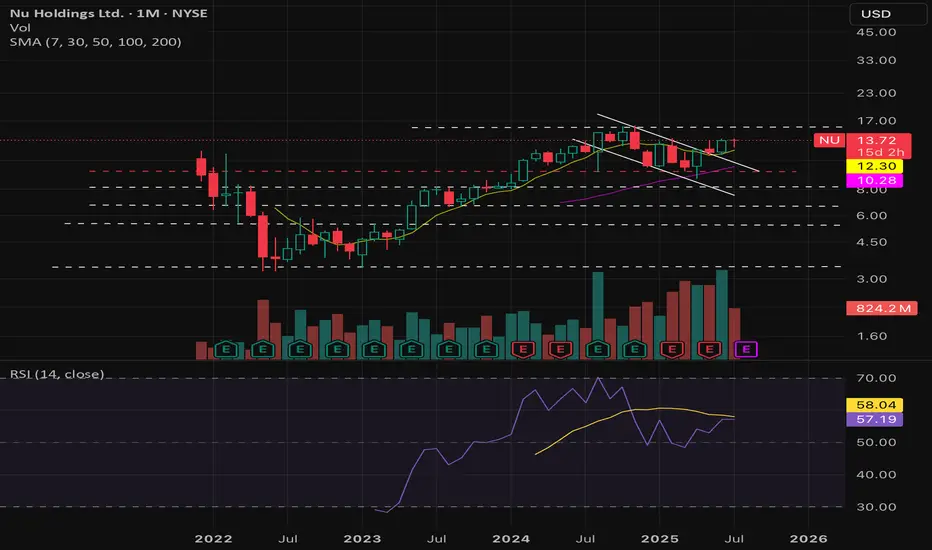
$NU : 30% CAGR for your portfolio for the next 3-5 years!- NYSE:NU is a big name in the LATAM.
- LATAM is expected to grow significantly in next decade with digitalization as the strongest theme.
- Let's talk about fundamentals:
Year | 2025| 2026| 2027 | 2028
EPS | 0.56 | 0.77 | 1.05 | 1.45
EPS growth% | 31.99% | 37.71% | 36.05% | 38.58%
For a company growing EPS at 30%+ deserves a forward p/e of 30
Base Case Stock Value ( Forward p/e = 30 ):
Year | 2025| 2026| 2027 | 2028
fair value | $16.8 | $23 | $31 | $43
Bear Case ( Forward p/e = 20 )
Year | 2025| 2026| 2027 | 2028
fair value | $11.2 | $15.4 | $21 | $29
Bull Case ( Forward p/e = 35 )
Year | 2025| 2026| 2027 | 2028
fair value | $19.6 | $26.95 | $36.75 | $50
Bitcoin: New All-Time High — What’s Next?Bitcoin had an incredible run, breaking the old all-time high ($111,980) with strong bullish momentum and setting a fresh ATH at $123,218 (Binance). We just witnessed the first major corrective move of ~6% and a decent bounce so far — but the big question is:
What’s next? Will Bitcoin break higher over the summer or form a trading range here?
Let’s dive into the technicals.
🧩 Higher Timeframe Structure
May–June Range:
BTC was stuck between $110K–$100K, forming an ABC corrective pattern. Using trend-based Fib extension (TBFE) from A–B–C:
✅ C wave completed at $98,922 (1.0 TBFE)
✅ Upside target hit at $122,137 (-1 TBFE)
Full Bull Market TBFE:
➡️ 1.0 → $107,301 → previously rejected
➡️ 1.272 → $123,158 → recent rejection zone
Pitchfork (log scale):
➡️ Tapped the upper resistance edge before rejecting.
Previous Bear Market Fib Extension:
➡️ 2.0 extension at $122,524 hit.
2018–2022 Cycle TBFE:
➡️ 1.618 at $122,011 tapped.
Macro Fibonacci Channel:
➡️ Connecting 2018 low ($3,782), 2021 ATH ($69K), 2022 low ($15,476) →
1.618–1.666 resistance band: $121K–$123.5K.
✅ Conclusion: Multiple fib confluences mark the $122K–$123K zone as critical resistance.
Daily Timeframe
➡️ FVG / Imbalance:
Big daily Fair Value Gap between the prior ATH and $115,222 swing low.
BTC broke the prior ATH (pATH) without retest → a pullback to this zone is likely.
Lower Timeframe / Short-Term Outlook
We likely saw a completed 5-wave impulse up → now correcting.
The -6% move was probably wave A, current bounce = wave B, next leg = wave C.
➡ Wave B short zone: $120K–$121K
➡ Wave C target (1.0 TBFE projection): ~$113,326
➡ Confluence at mid-FVG + nPOC
Trade Setups
🔴 Short Setup:
Entry: $120,300–$121,000
Stop: Above current ATH (~$123,300)
Target: $113,500
R:R ≈ 1:2.3
🟢 Long Setup:
Entry: Between Prior ATH and $113,000
Stop: Below anchored VWAP (~$110,500)
Target: Higher, depending on bounce confirmation.
🧠 Educational Insight: Why Fibs Matter at Market Extremes
When markets push into new all-time highs, most classic support/resistance levels disappear — there’s simply no historical price action to lean on. That’s where Fibonacci extensions, channels, and projections become powerful tools.
Here’s why:
➡ Fibonacci extensions (like the 1.272, 1.618, 2.0) help estimate where trend exhaustion or profit-taking zones may appear. They are based on the psychology of crowd behavior, as traders anchor expectations to proportional moves from previous swings.
➡ Trend-Based Fib Extensions (TBFE) project potential reversal or continuation zones using not just price levels, but also the symmetry of prior wave moves.
➡ Fibonacci channels align trend angles across multiple market cycles, giving macro context — like how the 2018 low, 2021 ATH, and 2022 low project the current 1.618–1.666 resistance zone.
In short:
When you don’t have left-hand price history, you lean on right-hand geometry.
That’s why the $122K–123K zone wasn’t just random — it’s a convergence of multiple fib levels, cycle projections, and technical structures across timeframes.
⚡ Final Thoughts
Bitcoin faces major resistance around $122K–$123K backed by multiple fib and structural levels. A retest of the prior ATH zone (~$112K–$113K) looks probable before the next big directional move. Watch lower timeframe structure for signs of completion in this corrective phase.
_________________________________
💬 If you found this helpful, drop a like and comment!
Want breakdowns of other charts? Leave your requests below.

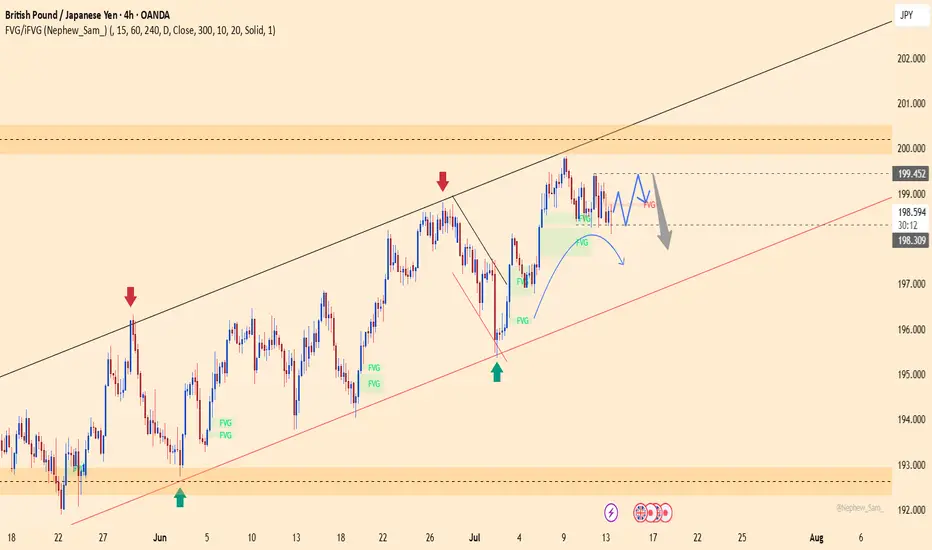
GBPJPY – Eyeing new highs as bullish structure holdsGBPJPY continues to trade within a steady ascending channel and has recently bounced from short-term support around 198.200. If price breaks above 199.400, bullish momentum could strengthen, targeting the previous high near 200.800 — a key resistance zone that has been rejected before.
From a fundamental perspective, expectations that the Bank of England will maintain high interest rates to combat inflation are supporting the pound. Meanwhile, investor sentiment remains cautious toward the yen following dovish signals from the Bank of Japan. If upcoming UK economic data is positive, GBPJPY may continue climbing in the sessions ahead.

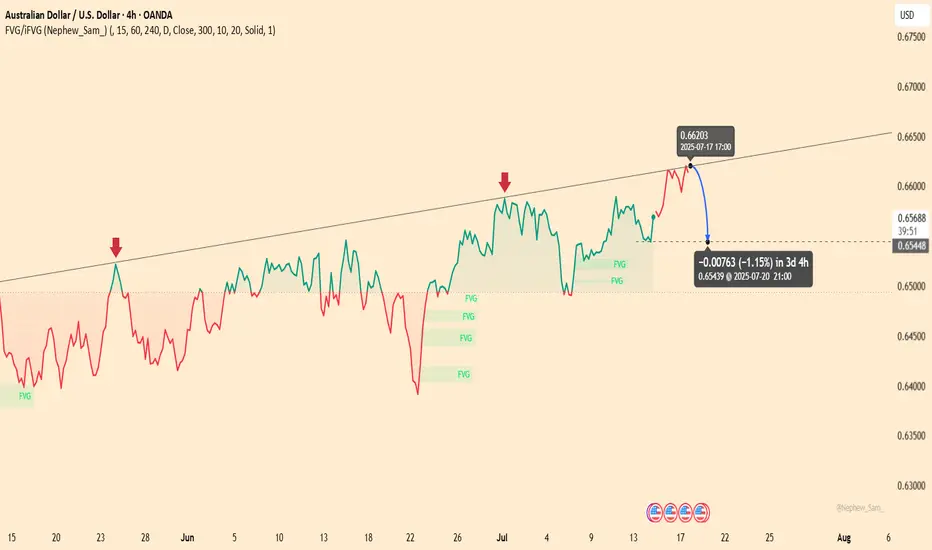
AUDUSD – Mild rebound, downside risk aheadAUDUSD is approaching a key trendline resistance after a short-term recovery. However, repeated rejections at this level in the past suggest a potential reversal is forming. The current structure mirrors previous setups – a mild rally into the trendline followed by weakness.
On the news front, recent U.S. economic data has supported the dollar, particularly stable job numbers and consumer confidence. Meanwhile, the market is awaiting the upcoming FOMC meeting minutes and Australia’s CPI report. Without a surprise boost from AUD fundamentals, the pair could face renewed downward pressure in the coming sessions.
Gold set to surge? XAUUSD is holding firmly within a clear ascending channel on the H1 chart. After a strong rally, price is showing signs of a minor pullback toward the trendline support – potentially the last chance for buyers before gold accelerates toward the upper resistance zone.
On the news front, lower-than-expected U.S. producer inflation data has weakened the dollar, increasing gold’s appeal as a safe haven. In the coming days, key economic events like retail sales and comments from the Fed could serve as catalysts for the next bullish leg.
EURUSD – Bullish Momentum ReturnsEURUSD is gradually breaking free from downward pressure as it breaches the short-term accumulation structure, aiming for the resistance zone around 1.1720. On the chart, a clear bullish trend is emerging, supported by FVG signals reinforcing the recovery.
On the news front, expectations are rising that the European Central Bank will maintain a tighter policy stance for longer, as core inflation in the Eurozone remains elevated. Meanwhile, the USD is under corrective pressure following last week’s lower-than-expected U.S. CPI data. Upcoming statements from ECB and Fed officials today will be key in determining the next move for this currency pair.
Unless a surprise arises from the U.S. side, EURUSD is likely to sustain its short-term upward momentum and test the next technical resistance area.
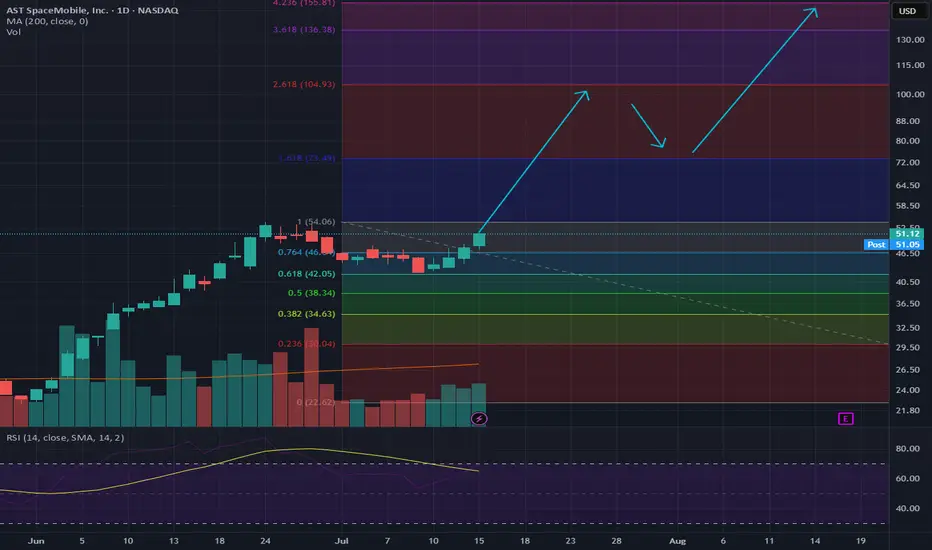
LONG-TERM $ASTSYou can't spell Sats without ASTS
This will be a trillion dollar company - here's the next few years, cheers!
CRV ANALYSIS🔮 #CRV Analysis 💰💰
🌟🚀 As we can see that #CRV is trading in a symmetrical triangle and given a perfect breakout. But there is an instant resistance. If #CRV breaks the resistance 1 then we will see a good bullish move in few days . 🚀🚀
🔖 Current Price: $0.7280
⏳ Target Price: $1.0800
#CRV #Cryptocurrency #DYOR

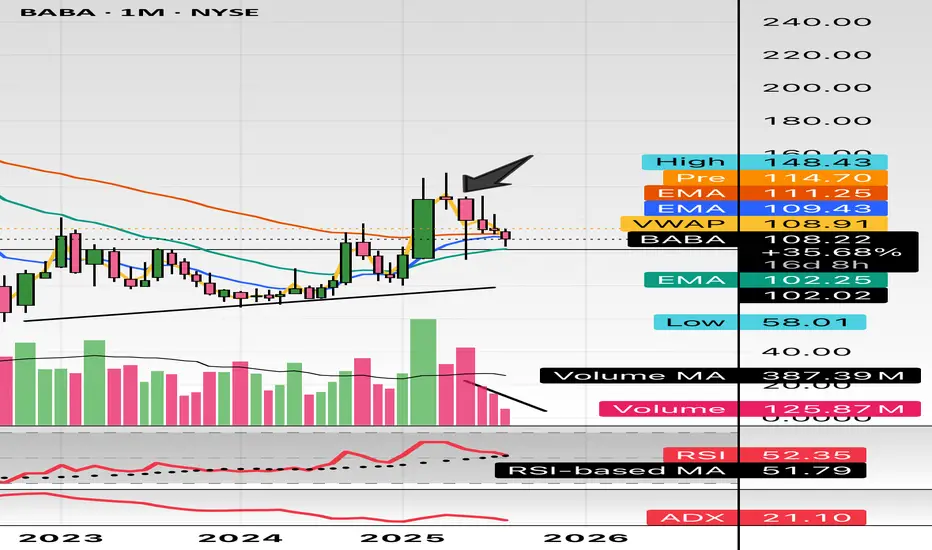
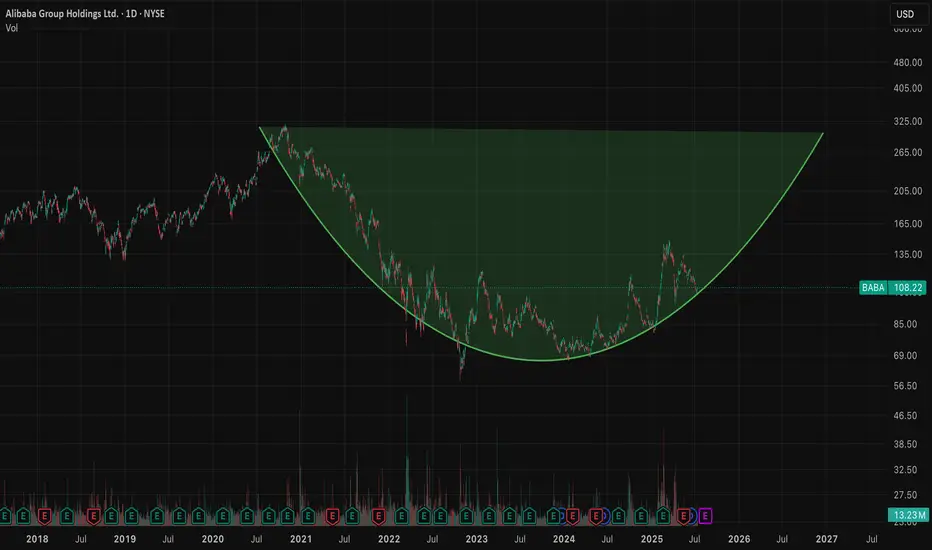
$BABA don’t miss this milky bottle. Called this out at $105 in minds. This Monthly declining volume, support at $100, and uptrend pattern. China will boom into the end of Q3 and early 2026. Target is $180 and $200.
WSL.

Elliott Wave Analysis of Kirloskar Brothers KIRLOSBROSThe script is currently in 4th wave of hourly chart. The 4th wave seems to be ending, which means a 5th wave will start from here. The wave patters and patterns, retracements and analysis have been highlighted on the chart. Will update this as it progresses.

$BABA 160+ before year end looks realistic thanks $NVDA- NASDAQ:NVDA export ban lifted for China will be beneficial for NASDAQ:NVDA for sure but main advantages would be for NYSE:BABA as they can get the shovels from the shop as well so that they can compete in Gold Rush and compete with NASDAQ:GOOGL , NASDAQ:META and other private companies like Open AI and Anthropic.
- There are good universities in China and NYSE:BABA is regional big tech in China which gets great talent. I'm confident that NYSE:BABA would be able to compete with NASDAQ:META & NASDAQ:GOOGL in building LLMs even better with this export ban lift.
- Long NYSE:BABA and short/avoid NASDAQ:META ( overvalued )
uptrend, heading towards 3400⭐️GOLDEN INFORMATION:
Gold prices (XAU/USD) climb toward $3,350 in early Asian trading on Tuesday, supported by renewed safe-haven demand after US President Donald Trump threatened sweeping 100% tariffs on Russia. Traders now shift focus to the upcoming US Consumer Price Index (CPI) report, which could offer further cues for the Federal Reserve’s policy outlook.
Late Monday, Trump warned that unless Russian President Vladimir Putin agrees to a peace deal to end the Ukraine conflict within 50 days, the US will impose 100% tariffs on Russian goods. The proposed sanctions, described as secondary tariffs, lack detailed clarification but have already fueled market anxiety. Heightened geopolitical tensions are likely to sustain near-term demand for gold as investors seek safety in the yellow metal
⭐️Personal comments NOVA:
Maintaining buying pressure above 3350, gold price in an uptrend, paying attention to CPI results to assess the inflation level of the world's number 1 economy
⭐️SET UP GOLD PRICE:
🔥SELL GOLD zone: 3400- 3402 SL 3407
TP1: $3390
TP2: $3380
TP3: $3370
🔥BUY GOLD zone: $3330-$3328 SL $3323
TP1: $3340
TP2: $3350
TP3: $3360
⭐️Technical analysis:
Based on technical indicators EMA 34, EMA89 and support resistance areas to set up a reasonable BUY order.
⭐️NOTE:
Note: Nova wishes traders to manage their capital well
- take the number of lots that match your capital
- Takeprofit equal to 4-6% of capital account
- Stoplose equal to 2-3% of capital account

EURUSD – Bearish Pressure Mounts Ahead of Triangle Breakout EURUSD is trading within a contracting triangle and currently leans toward a bearish bias. After several failed attempts to break the upper boundary, momentum is weakening, and the pair is showing signs of a potential breakdown toward lower support levels.
With several key events ahead, the euro may face additional pressure if upcoming Eurozone inflation data disappoints or if the Fed maintains a hawkish tone through upcoming speeches by U.S. officials. Unless there is a strong bullish catalyst, EURUSD is likely to correct further to the downside.
GBPJPY: Downside Pressure Increasing - Sell Opportunity!GBPJPY is showing clear signs of weakness, currently trading around 198.620. If it breaks and holds below 198.300, the bearish trend will be confirmed, with the next potential target at 192.000.
Upcoming key economic news from the UK (inflation, retail sales) and Japan (BOJ policy) will be decisive. Prioritize selling strategies, monitor news closely, and manage risk tightly.
XAUUSD – Topping Out, Correction Pressure MountsGold prices are stalling after approaching the key resistance at $3,381, precisely at the upper boundary of the short-term ascending channel. The bullish momentum is fading as the USD and U.S. bond yields remain firm, supported by stable jobs data and a lack of clear rate guidance from the Fed.
Additionally, the World Gold Council (WGC) has warned of medium-term correction risks if geopolitical tensions ease or the dollar continues to strengthen — prompting buyers to stay cautious. In the near term, XAUUSD may pull back toward the $3,295 support zone before the market defines its next direction.