#IPUSDT – Long Setup, Testing Resistance ZoneLONG BYBIT:IPUSDT.P from $7.0000
🛡 Stop Loss: $6.6900
⏱ 1H Timeframe
✅ Market Analysis:
📍 The BYBIT:IPUSDT.P price is showing strong upward momentum, breaking key resistance levels.
📍 The asset has held above the $6.8982 level, which may confirm a continuation of the uptrend.
📍 POC (Point of Control) at $4.8742 – the highest volume area, previously serving as a consolidation point.
🎯 TP Targets:
💎 TP 1: $7.3100
🔥 TP 2: $7.6200
⚡ TP 3: $7.8600
📢 Holding above $6.8982 could confirm trend strength.
📢 A dip toward $6.6900 (stop loss) could be a fakeout – monitoring price action is crucial.
📢 The $7.3100 level is the first TP, where a retracement may occur before further upside.
📢 If the price breaks $7.6200, the move toward $7.8600 becomes more likely.
🚀 BYBIT:IPUSDT.P is showing strength – monitoring the $7.0000 breakout and securing profits as the price moves up.
Longsetup

GOLD → Volatile. Entering consolidation. What is next?OANDA:XAUUSD after a short-term uptrend, gold is now shifting into a consolidation phase, with speculative traders actively defending key risk zones. In this environment, what can we expect from the precious metal next?
Uncertainty surrounding Trump’s tariff policies and weak U.S. economic data has driven investors back toward safe-haven assets. However, after reaching a record high of $2,956 on Tuesday, gold experienced a pullback due to profit-taking and a decline in Chinese imports. Despite this, weak U.S. consumer confidence data has helped support a partial recovery.
While gold still holds bullish potential, its upside movement is being restrained by a stronger U.S. dollar and rising bond yields. However, trade war concerns continue to fuel demand for the metal.
Key Levels to Watch:
Resistance: 2,921 – 2,942
Support: 2,905 – 2,888
At this stage, the market is forming a sideways range, leading to two potential scenarios:
A pullback to retest the 2,905 – 2,888 support zone before a potential rebound.
A breakout above resistance, confirming a continuation of the bullish trend.
If buyers can push gold into the 2,921 – 2,929 zone and maintain control above this level, the metal could regain upward momentum.
Stay tuned and seize the best opportunities!

Ready to Skyrocket? Story/USDT at Key Level!The chart shows a strong uptrend, respecting an ascending trendline with three confirmed touches (1, 2, and 3). The price is currently testing a minor resistance zone, which has previously acted as a rejection point.
At this moment, the price is near the trendline for a potential fourth retest (marked as "4?"). If the trendline holds, it could act as a springboard for another upward move, potentially breaking the minor resistance and continuing the bullish trend.

Whats next after the Bitcoin correction In this video I Breakdown a couple of potential Targets for longs .

Bullish on All Time Frames.Bullish on All Time Frames.
Crossing & Sustaining 208 will lead
it towards 260 - 265 & then 300+
Immediate Supports lies around 200 &
then around 183 - 187
Fresh Entry can be made once 208 is
Sustained.

Beautifully making HH HL.Beautifully making HH HL.
Immediate Support is around 29 - 29.30
Monthly Closing above 29.13 would be a
healthy sign.
If 29 is Not Sustained, Next Support would be
around 24.30 - 26.30
& if 29 is Sustained,34 - 35 can be witnessed.
Immediate small Resistance is around 31.55
Should Not Break 24 even in Worst Case.

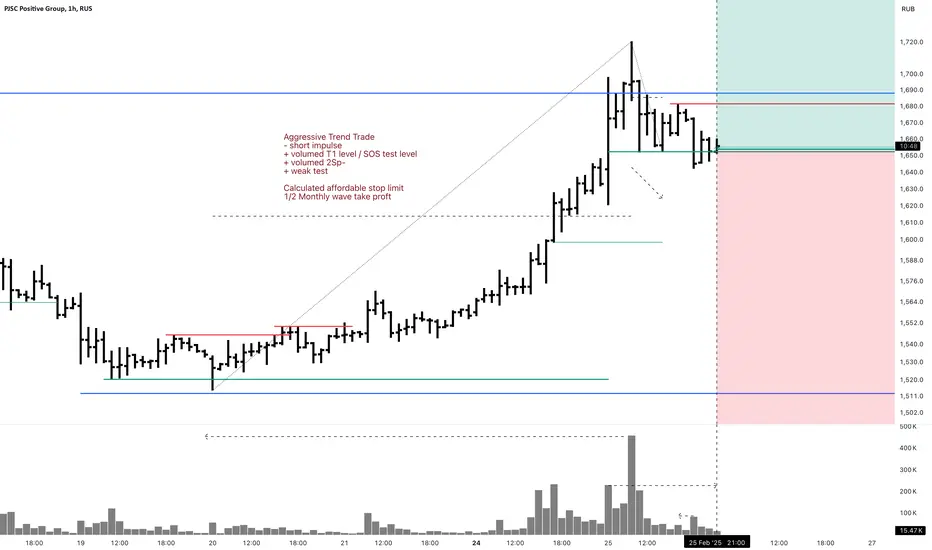
POSI 1H Investment Aggressive Trend TradeAggressive Trend Trade
- short impulse
+ volumed T1 level / SOS test level
+ volumed 2Sp-
+ weak test
Calculated affordable stop limit
1/2 Monthly wave take profit
Daily Trend
"+ long impulse?
- resistance level
- short volume distribution"
Monthly Trend
"+ long impulse
+ 1/2 correction
+ volumed expanding T1
+ support level
+ biggest volume manipulation"
Yearly Trend
+ long impulse
Weird set up. Market is strong and Monthly look a lot like exhaustion!

GOLD NEXT MOVEgold clear all lequidity of sell market currently trade at demand zone who is agree and take buy with us from this level.

MSFT MicroStrategy Update Quick update on the move to the downside that we had been expecting . Sharing my thoughts on what next.

Will gold continue to jump and create ATH?⭐️ Smart investment, Strong finance
⭐️ GOLDEN INFORMATION:
Gold price (XAU/USD) edges lower during the Asian session on Tuesday, pulling back from its recent record high. A recovering US Dollar (USD) from its lowest level since December 10 weighs on demand for the metal. Additionally, overbought conditions lead some traders to trim their bullish positions. However, the broader market outlook suggests caution before making strong bearish moves.
⭐️ Personal comments NOVA:
Gold price is maintaining an upward trend, TRENDLINE H1
⭐️ SET UP GOLD PRICE:
🔥 BUY GOLD zone: $2917 - $2915 SL $2910
TP1: $2922
TP2: $2930
TP3: $2940
🔥 SELL GOLD zone: $2966 - $2968 SL $2973
TP1: $2960
TP2: $2950
TP3: $2940
⭐️ Technical analysis:
Based on technical indicators EMA 34, EMA89 and support resistance areas to set up a reasonable BUY order.
⭐️ NOTE:
Note: Nova wishes traders to manage their capital well
- take the number of lots that match your capital
- Takeprofit equal to 4-6% of capital account
- Stoplose equal to 2-3% of capital account

SOLUSD looks to be aiming towards golden ratio - time to buy..Currently, SOLUSD is showing signs of aiming towards this pivotal level. Fibonnaci retrace from beginning of bullrun shows gold ratio to be at 120-130 level, a local support. Going to buy heavy here at 120-130.

Morning Star Formation on Weekly TF.Morning Star Formation on Weekly TF.
Strong Trendline Support around 9.40 - 9.50
However, Accumulation can be started from
Current Level (10 - 10.50);
Should not Break 8 (even in worst cases)
Upside Targets can be around 13 - 14 & then
16 -18


DEEP - Finding The Next Trade SetupDEEP recently took out the January 13, 2025 low at $0.12345 with a Swing Failure Pattern (SFP), followed by a successful retest. This led to a bounce that hit a key level at $0.12141, presenting a solid long opportunity with minimal risk.
After this, the market turned bullish, forming a 5-wave structure and rallying to the 0.786 Fibonacci retracement level at $0.18643 (measured from the $0.20473 high to the $0.11922 low). This was a key take-profit zone for longs and a great short opportunity.
Adding confluence, the anchored VWAP also acted as resistance just above at $0.19, offering another low-risk short setup. Additionally, a key resistance level at $0.1809 further reinforced the rejection zone.
Current Price Action & Short Setup
From the 0.786 Fib retracement, DEEP retraced 20% downward, nearly touching the 0.618 retracement of the 5-wave structure before bouncing. Now, price is finding resistance at the golden pocket (0.618 at $0.17347 and 0.666 at $0.17534) of the recent drop, aligning perfectly with the daily 21 EMA ($0.1757) and daily SMA ($0.17347).
This setup suggests an ABC corrective move is forming.
Using the trend-based Fibonacci extension, the 0.786 extension aligns with the 0.618 retracement at $0.1457, creating a strong short setup.
Short Entry: Between $0.17347 - $0.17534
Target: $0.1457 (0.786 trend-based Fib extension / 0.618 retracement)
Stop Loss: $0.1845
Risk/Reward: 2.5:1
There’s also potential to extend the target to the 1:1 trend-based Fib extension at $0.13733, but this would depend on price action.
Potential Long Setup
If price reaches the $0.1457 support zone, this could present a high-probability long opportunity.
Entry: Around $0.1457
Risk/Reward: 2:1 or better, but confirmation is needed before executing the trade

O 1D Investment Aggressive Trend TradeAggressive Trend Trade
- short impulse
+ biggest volume TE / T1
+ support level
+ biggest volume 2Sp-
+ weak test
+ first bullish bar close entry
Calculated affordable stop limit
1 to 2 R/R take profit
Monthly Trend
"+ long impulse
+ 1/2 correction
+ SoS level
+ support level
+ weak approach"
1Y Trend
"+ long balance
+ volumed manipulation
- neutral zone"

Pteronet Lng bullish Pole and FlagEntry- 303-304
Support- 298-300
Target- 310, 312, 315
Pattern- Bullish Pole N Flag in 1hr Time Frame and a bullish engulfing candlestick.
Disclaimer- This is just for educational purpose please take advice from you own financial advisor before making any decision.
Note- Market sentiment is bearish. Focus on fundamentally strong oversold stocks which have corrected 50 percent or more.
Jai Shree Ram

chzusdt longterm setup"🌟 Welcome to Golden Candle! 🌟
We're a team of 📈 passionate traders 📉 who love sharing our 🔍 technical analysis insights 🔎 with the TradingView community. 🌎
Our goal is to provide 💡 valuable perspectives 💡 on market trends and patterns, but 🚫 please note that our analyses are not intended as buy or sell recommendations. 🚫
Instead, they reflect our own 💭 personal attitudes and thoughts. 💭
Follow along and 📚 learn 📚 from our analyses! 📊💡"

GBPUSD LONGIn the uptrend, I expect a pullback to the green area and I expect a positive position to go even bigger than my TP.

ADA ANALYSIS🚀#ADA Analysis :
🔮As we can see in the chart of #ADA that there is a formation of Descending Channel Pattern. #ADA is consolidating in a parallel channel.... currently waiting for breakout the pattern. It is trading above its major support zone and there maybe a small retest towards support zone and after that we will see a bullish move📈📈
🔰Current Price: $0.7650
🎯 Target Price: $0.9440
⚡️What to do ?
👀Keep an eye on #ADA price action. We can trade according to the chart and make some profits⚡️⚡️
#ADA #Cryptocurrency #TechnicalAnalysis #DYOR

DOGE ANALYSIS📊 #DOGE Analysis : Update
✅There was a formation of Falling Wedge Pattern on daily chart.
We could expect bullish move if #DOGE breaks the pattern and also breaks the major resistance zone.
👀Current Price: $0.2436
🚀 Target Price: $0.3400
⚡️What to do ?
👀Keep an eye on #DOGE price action and volume. We can trade according to the chart and make some profits⚡️⚡️
#DOGE #Cryptocurrency #TechnicalAnalysis #DYOR

Bullish Momentum - Tariffs! Waiting for New ATH next week✍️ NOVA hello everyone, Let's comment on gold price next week from 02/24/2025 - 02/28/2025
🔥 World situation:
Gold price slides late on Friday, poised to end the week positively, accumulating eight straight weeks of gains that pushed the yellow metal to all-time highs of $2,954. At the time of writing, the XAU/USD trades at $2,940, down 0.15%.
The financial markets' narrative has not changed as US President Donald Trump continues with rhetoric related to tariffs. In addition to imposing 25% tariffs on cars, pharmaceuticals and chips, Trump broadened duties to lumber and other soft commodities.
This fueled the rally in Bullion prices as investors seeking safety drove prices higher amidst uncertainty about US trade policies. Meanwhile, geopolitics took a second stage as there was some progress in the discussion to end the Russia-Ukraine war, which relieved the markets.
🔥 Identify:
Accumulated price zone 2918 - 2954, uptrend maintained well above zone 2900
🔥 Technically:
Based on the resistance and support areas of the gold price according to the H4 frame, NOVA identifies the important key areas as follows:
Resistance: $2954, $2965, $2980
Support : $2918, $2895, $2877
🔥 NOTE:
Note: Nova wishes traders to manage their capital well
- take the number of lots that match your capital
- Takeprofit equal to 4-6% of capital account
- Stoplose equal to 2-3% of capital account
- The winner is the one who sticks with the market the longest

MKR ANALYSIS📊 #MKR Analysis : Update
✅There was a formation of Falling Wedge Pattern on daily chart with a huge breakout 🧐
We could expect more bullish move if #MKR breaks the major resistance zone.
👀Current Price: $1.537
🚀 Target Price: $2.060
⚡️What to do ?
👀Keep an eye on #MKR price action and volume. We can trade according to the chart and make some profits⚡️⚡️
#MKR #Cryptocurrency #TechnicalAnalysis #DYOR
