NZDJPY - Shifting Trends Soon!Hello TradingView Family / Fellow Traders. This is Richard, also known as theSignalyst.
📉NZDJPY has been overall bearish , trading within the falling channel marked in red.
However, it is currently retesting the lower bound of the channel which lines up perfectly with the support zone marked in blue.
📈As per my trading style , as long as the support zone holds, I will be looking for buy setups on lower timeframes.
📚 Always follow your trading plan regarding entry, risk management, and trade management.
Good luck!
All Strategies Are Good; If Managed Properly!
~Rich
Disclosure: I am part of Trade Nation's Influencer program and receive a monthly fee for using their TradingView charts in my analysis.
Longterm

3074 ! Next price zone, gold ATH reached⭐️GOLDEN INFORMATION:
Gold prices (XAU/USD) continue their consolidation phase into the European session on Thursday, as traders exercise caution amid slightly overbought conditions. Additionally, a prevailing risk-on sentiment limits the metal’s intraday advance to a new record high. However, downside risks remain contained due to lingering uncertainty surrounding US President Donald Trump’s aggressive trade policies and their potential ramifications for the global economic outlook.
⭐️Personal comments NOVA:
Bulls continue their excitement, pushing prices higher, amid global trade tensions.
⭐️SET UP GOLD PRICE:
🔥SELL GOLD zone: $3062 - $3064 SL $3067 scalping
TP1: $3058
TP2: $3050
TP3: $3040
🔥SELL GOLD zone: $3073 - $3075 SL $3080
TP1: $3065
TP2: $3050
TP3: $3040
🔥BUY GOLD zone: $3003 - $3001 SL $2996
TP1: $3009
TP2: $3015
TP3: $3023
⭐️Technical analysis:
Based on technical indicators EMA 34, EMA89 and support resistance areas to set up a reasonable BUY order.
⭐️NOTE:
Note: Nova wishes traders to manage their capital well
- take the number of lots that match your capital
- Takeprofit equal to 4-6% of capital account
- Stoplose equal to 2-3% of capital account

ETHEREUM -Weekly forecast,Technical Analysis & Trading IdeasMidterm forecast:
While the price is above the support 1521.00, beginning of uptrend is expected.
We make sure when the resistance at 2090.33 breaks.
If the support at 1521.00 is broken, the short-term forecast -beginning of uptrend- will be invalid.
BITSTAMP:ETHUSD MARKETSCOM:ETHEREUM
Technical analysis:
A trough is formed in daily chart at 1750.30 on 03/11/2025, so more gains maximum to Major Resistance (2090.33) is expected.
Take Profits:
2362.31
2546.73
2801.10
3042.75
3516.43
3741.60
4107.80
4500.00
4868.00
__________________________________________________________________
❤️ If you find this helpful and want more FREE forecasts in TradingView,
. . . . . . . . Hit the 'BOOST' button 👍
. . . . . . . . . . . Drop some feedback in the comments below! (e.g., What did you find most useful? How can we improve?)
🙏 Your support is appreciated!
Now, it's your turn!
Be sure to leave a comment; let us know how you see this opportunity and forecast.
Have a successful week,
ForecastCity Support Team

When will the gold price adjust down?⭐️GOLDEN INFORMATION:
Gold prices (XAU/USD) enter a phase of bullish consolidation near their record high, as traders take a cautious stance ahead of the highly anticipated Federal Open Market Committee (FOMC) policy decision on Wednesday. The consensus widely expects the Federal Reserve (Fed) to maintain the federal funds rate within its current range of 4.25% to 4.50%. Consequently, market attention will be centered on the Fed’s updated economic projections and Chair Jerome Powell’s post-meeting remarks, which could offer crucial insights into the future trajectory of interest rate cuts. These developments will be instrumental in shaping US Dollar (USD) movements and influencing gold’s next directional move.
⭐️Personal comments NOVA:
continue to grow, long term uptrend
⭐️SET UP GOLD PRICE:
🔥SELL GOLD zone: $3058 - $3060 SL $3065
TP1: $3050
TP2: $3040
TP3: $3030
🔥SELL GOLD zone: $3044 - $3046 SL $3049
TP1: $3040
TP2: $3030
TP3: $3020
🔥BUY GOLD zone: $3004 - $3002 SL $2997
TP1: $3010
TP2: $3020
TP3: $3030
⭐️Technical analysis:
Based on technical indicators EMA 34, EMA89 and support resistance areas to set up a reasonable BUY order.
⭐️NOTE:
Note: Nova wishes traders to manage their capital well
- take the number of lots that match your capital
- Takeprofit equal to 4-6% of capital account
- Stoplose equal to 2-3% of capital account

SWING IDEA - ANGELONE
ANGELONE
's stock price has been retesting around the 2000 resistance level for approximately two and half years. Following multiple retest, the stock finally broke out above this level in October 2023 and has since established it as a key support.
The stock subsequently surged to a peak of 3895, representing a 87% increase. However, it then experienced a sharp correction, plummeting 45% to revisit the 2000 support level again. This pivotal point, formerly a resistance, has now become a robust support.
Currently, ANGELONE is exhibiting an upward momentum, poised to retest its swing high at 3895. The weekly MACD crossover, occurring after the establishment of support at 2000, indicates a bullish trend reversal.
KEY OBSERVATIONS:
- Two-year resistance level of 2000 broken in October 2023
- Stock surged 87% to 3895 before correcting 45%
- 2000 level now serves as robust support
- Weekly MACD crossover indicates bullish momentum
- Upward momentum poised to retest swing high at 3895
RECOMMENDATION:
Based on this technical analysis, I would recommend holding ANGELONE for a Long Term horizon. This could potentially yield:
- 35% returns from the current price (as of writing)
- 87% returns from the support point (2000)
This analysis highlights a compelling buying opportunity in ANGELONE, driven by its breakout and momentum reversal.
IMPORTANT NOTE: Investors should be aware that there is a possibility that the stock may revisit this Support level at 2000 in the near future before resuming its upward momentum towards the swing high at 3895. This potential pullback should be monitored closely, and investors may consider adjusting their strategies accordingly.
DISCLAIMER: This IDEA is for informational/educational purposes only and should not be considered as investment advice. The analysis presented is based on technical indicators and historical data but does not guarantee future performance. Please conduct thorough research based on financial goals and risk tolerance, and consult with a financial advisor before making any investment decisions.

Silver Update | $40This TA focuses on long term projections using the last fractal pattern and a fibonacci extension to help with finding targets.

Will THETA return to an upward trend?Hello everyone, I invite you to review the current situation on Theta Token. When we enter the one-day interval, we can see how the price moved in the formed downtrend channel. What's more, we can see here the movement at the lower border of the channel and how the price maintains a strong support at the level of $ 0.90, however, if we go lower, just below the channel border, a very strong support zone for the price from $ 0.69 to $ 0.42 is visible.
We can also see how the price enters a slight sideways trend in which it can approach the downtrend line lasting inside the downtrend channel, such consolidation and gathering of energy can have a positive impact on the movement in the coming weeks, which can lead to growth. When such a scenario works, we can see a nice upward movement around $ 1.36, another significant resistance can be seen at $ 1.75, and then we have strong resistance around $ 2.36.
It is worth paying attention to the MACD indicator here, which shows how we are staying in the lower range and the ongoing movement is visible here, which may also indicate a potential attempt to rebound the price.

Behind the DCA Strategy: What It Is and How It WorksWho invented the Dollar Cost Averaging (DCA) investment strategy?
The concept of Dollar Cost Averaging (DCA) was formalized and popularized by economists and investors throughout the 20th century, particularly with the growth of the U.S. stock market. One of the first to promote this strategy was Benjamin Graham , considered the father of value investing and author of the famous book The Intelligent Investor (published in 1949). Graham highlighted how DCA could help reduce the risk of buying assets at excessively high prices and improve investor discipline.
When and How Did Dollar Cost Averaging Originate?
The concept of DCA began to take shape in the early decades of the 20th century when financial institutions introduced automatic purchase programs for savers. However, it gained popularity among retail investors in the 1950s and 1960s with the rise of mutual funds.
Overview
The core principle of DCA involves investing a fixed amount of money at regular intervals (e.g., every month. This approach allows investors to purchase more units when prices are low and fewer units when prices are high, thereby reducing the impact of market volatility.
Why Was DCA Developed?
The strategy was developed to address key challenges faced by investors, including:
1. Reducing Market Timing Risk
Investing a fixed amount periodically eliminates the need to predict the perfect market entry point, reducing the risk of buying at peaks.
2. Discipline and Financial Planning
DCA helps investors maintain financial discipline, making investments more consistent and predictable.
3. Mitigating Volatility
Spreading trades over a long period reduces the impact of market fluctuations and minimizes the risk of experiencing a significant drop immediately after a large investment.
4. Ease of Implementation
The strategy is simple to apply and does not require constant market monitoring, making it accessible to all types of investors.
Types of DCA
Dollar Cost Averaging (DCA) is an investment strategy that can be implemented in two main ways:
Time-Based DCA → Entries occur at regular intervals regardless of price.
Price-Based DCA → Entries occur only when the price meets specific criteria.
1. Time-Based DCA
How It Works: The investor buys a fixed amount of an asset at regular intervals (e.g., weekly, monthly). Entries occur regardless of market price.
Example: An investor decides to buy $200 worth of Bitcoin every month, without worrying whether the price has gone up or down.
2. Price-Based DCA
How It Works: Purchases occur only when the price drops below a predefined threshold. The investor sets price levels at which purchases will be executed (e.g., every -5%). This approach is more selective and allows for buying at a “discount” compared to the market trend.
Example: An investor decides to buy $200 worth of Bitcoin only when the price drops by at least 5% compared to the last entry.
Challenges and Limitations
1. DCA May Reduce Profits in Bull Markets
If the market is in an bullish trend, a single trade may be more profitable than spreading purchases over time or price dips.
2. Does Not Fully Remove Loss Risk
DCA helps mitigate volatility but does not protect against long-term bearish trends. If an asset continues to decline for an extended period, positions will accumulate at lower values with no guarantee of recovery.
3. May Be Inefficient for Active Investors
If an investor has the skills to identify better entry points (e.g., using technical or macroeconomic analysis), DCA might be less effective. Those who can spot market opportunities may achieve a better average entry price than an automatic DCA approach.
4. Does Not Take Full Advantage of Price Drops
DCA does not allow aggressive buying during market dips since purchases are fixed at regular intervals. If the market temporarily crashes, an investor with available funds could benefit more by buying larger amounts at that moment.
5. Higher Transaction Costs
Frequent small investments can lead to higher trading fees, which may reduce net returns. This is especially relevant in markets with fixed commissions or high spreads.
6. Risk of Overconfidence and False Security
DCA is often seen as a “fail-proof” strategy, but it is not always effective. If an asset has weak fundamentals or belongs to a declining sector, DCA may only slow down losses rather than ensure future gains.
7. Requires Discipline and Patience
DCA is only effective if applied consistently over a long period. Some investors may lose patience and leave the strategy at the wrong time, especially during market crashes.

#1000CHEEMSUSDT is setting up for a breakout Long BINANCE:1000CHEEMSUSDT.P from $0,0014000
🛡 Stop loss $0,0013740
1h Timeframe
⚡ Plan:
➡️ POC is 0,0013254
➡️ Waiting for consolidation near resistance and increased buying activity before the breakout.
➡️ Expecting an impulsive upward move as buy orders accumulate.
🎯 TP Targets:
💎 TP 1: $0.0014380
💎 TP 2: $0.0014700
🚀 BINANCE:1000CHEEMSUSDT.P is setting up for a breakout—preparing for an upward move!

#API3USDT is setting up for a breakout📉 Long BYBIT:API3USDT.P from $0,8985
🛡 Stop loss $0,8543
1h Timeframe
⚡ Plan:
➡️ POC is 0,8185
➡️ Waiting for consolidation near resistance and increased buying activity before the breakout.
➡️ Expecting an impulsive upward move as buy orders accumulate.
🎯 TP Targets:
💎 TP 1: $0,9300
💎 TP 2: $0,9630
💎 TP 2: $0,9900
🚀 BYBIT:API3USDT.P is setting up for a breakout—preparing for an upward move!

EURCHF is starting to turn upLooks like a trend reversal at last.
1. Strong pinbars from the levels below 0.92 that rob the stops.
2. A broken trend line, higher lows, higher highs
3. it is currently at a very important level,we are watching how it will react and whether it will be overcome.
4. We are now long on a larger time frame.

Why Invest in CONMED Corp (CNMD)?Why Invest in CONMED Corp (CNMD)?
Strong Earnings Growth – CONMED has experienced a remarkable increase in earnings, with EPS surging by 104% year-over-year and net income rising by 105% YoY. This indicates strong financial performance and profitability momentum.
Attractive Valuation – The stock is currently trading at a P/E ratio of 13.79, which is significantly lower than its historical averages. This suggests that CNMD may be undervalued relative to its past performance and industry peers.
Consistent Revenue Growth – The company reported revenue of $1.31 billion for the last year, marking a 5% increase compared to the previous period. This steady growth highlights CNMD’s ability to expand its market presence.
Improving Margins and Efficiency – CONMED has seen an increase in operating income (+66% YoY), operating margin (+58% YoY), and return on assets (+104% YoY), demonstrating better cost management and operational efficiency.
Dividend and Low Payout Ratio – The company pays a dividend of $0.80 per share, yielding approximately 1.35%, with a conservative payout ratio of 18.6%. This allows room for future dividend increases while maintaining financial flexibility.
Healthcare Sector Stability – As a medical technology company specializing in surgical devices, CONMED operates in a defensive sector that tends to be resilient during economic downturns. This provides investors with a level of stability.
Solid Balance Sheet and Liquidity – The company has a current ratio of 2.3, indicating strong short-term liquidity. Additionally, its quick ratio of 0.94 suggests it can cover its immediate liabilities effectively.
Final Thoughts:
CONMED presents a compelling investment case due to its strong earnings growth, attractive valuation, improving profitability, and stable position in the healthcare sector. However, potential investors should always consider market conditions and individual risk tolerance before making investment decisions.

Reasons to Invest in CVS Health (CVS)Reasons to Invest in CVS Health (CVS)
Strong Market Position
CVS Health is a leading healthcare company with a diversified business model, including retail pharmacies, insurance, and healthcare services. Its extensive network provides a competitive advantage.
Attractive Valuation
CVS is currently trading at a P/E ratio of approximately 12.23, which is lower than its historical average of 17.55. This suggests the stock may be undervalued compared to its long-term performance【41】.
Consistent Free Cash Flow (FCF)
The company generates significant free cash flow, which allows it to invest in growth, reduce debt, and return capital to shareholders.
Dividend and Shareholder Returns
CVS has a stable dividend policy with a payout ratio that allows for sustainable growth while reinvesting in the business【40】.
Resilient Business Model
The healthcare industry is defensive, meaning CVS can perform well even in economic downturns. The company benefits from consistent demand for prescriptions and healthcare services.
Future Growth Potential
CVS is expanding its healthcare services through acquisitions and technology-driven solutions. Investments in Medicare, pharmacy benefits, and digital health are expected to drive long-term growth.
Would you like a deeper fundamental comparison between CVS and its competitors?

Occidental Petroleum - Warren Buffett's Strong EndorsementWhy Buying Occidental Petroleum (OXY) is a Good Investment
Warren Buffett's Strong Endorsement
Berkshire Hathaway, led by Warren Buffett, has been consistently increasing its stake in OXY, holding over 25% of the company. Buffett's long-term approach and confidence in OXY suggest strong fundamentals and future growth potential.
Solid Financial Performance
OXY has a P/E ratio of 20.95 and a profit margin of 19%, showing strong profitability in the energy sector. Its ROE of 15% indicates effective management of shareholder equity.
Strong Free Cash Flow (FCF)
The company generates around $1 billion in free cash flow, which enables it to reduce debt, buy back shares, and pay dividends—key factors Buffett looks for in an investment.
Favorable Industry Trends
With growing global energy demand and OXY's focus on low-cost production, the company is well-positioned to benefit from higher oil prices and long-term energy market stability.
Debt Reduction & Financial Strength
OXY has significantly reduced its debt-to-equity ratio (0.85), strengthening its balance sheet after the Anadarko acquisition. Buffett prefers companies that prioritize financial discipline.
Carbon Capture & Future Growth Potential
OXY is a leader in carbon capture technology, positioning itself for long-term sustainability as the world moves toward cleaner energy solutions. This gives it a competitive edge in the evolving energy market.
Buffett's Potential Full Acquisition
With Berkshire Hathaway increasing its stake and securing regulatory approval to buy up to 50% of OXY, there is speculation that Buffett may eventually acquire the entire company. This could drive further price appreciation for OXY shares.
Conclusion
Buffett's heavy investment in OXY, combined with strong financials, solid cash flow, and promising energy market trends, makes the company an attractive value play for long-term investors.

PayPal - Multiple Signals Pointing to a Potential Bottom!I’ve just entered a position in PayPal, and the reason is that several overlapping factors are lining up in a way that suggests a potential bottom may be in.
First, it looks very likely that Wave (2) is complete. The stock tapped the 61.8% Fibonacci retracement level with precision and has held that level over the past few days – all while the RSI has been climbing, which is a strong bullish divergence signal in my book.
Second, PayPal just touched last year’s VWAP level perfectly, which I view as another strong technical indicator for a potential reversal.
How far this move could go is still unclear, but the open gap above is definitely something I’m watching closely. For that to be in play, $71 needs to be reclaimed. And from here on, $66 should not be touched again.
That’s my plan – and that’s how I’m trading it. Let’s see if the market plays along.

WTI - Weekly Forecast - Technical Analysis & Trading IdeasMidterm forecast:
While the price is above the support 64.000, resumption of uptrend is expected.
We make sure when the resistance at 79.361 breaks.
If the support at 64.000 is broken, the short-term forecast -resumption of uptrend- will be invalid.
TVC:USOIL BLACKBULL:WTI
Technical analysis:
A peak is formed in daily chart at 79.355 on 01/15/2025, so more losses to support(s) 64.900 and minimum to Major Support (64.000) is expected.
Take Profits:
68.354
70.182
72.434
74.449
77.410
79.361
83.961
87.000
93.882
100.802
109.192
126.350
__________________________________________________________________
❤️ If you find this helpful and want more FREE forecasts in TradingView,
. . . . . . . . Hit the 'BOOST' button 👍
. . . . . . . . . . . Drop some feedback in the comments below! (e.g., What did you find most useful? How can we improve?)
🙏 Your support is appreciated!
Now, it's your turn!
Be sure to leave a comment; let us know how you see this opportunity and forecast.
Have a successful week,
ForecastCity Support Team

MSTR - MicroStrategy : Long Strategy
This stock Microstrategy Inc is showing some good recovery price action here on the 1Hr chart. It is a triple bottom and this is strong market structure, typical of a reversal sequence
The neckline is about 314 which will soon be taken. The chart has a very popular indicator FBB, Fibonacci Bollinger Bands. The middle line is derived from volume moving averages.
It is also bullish on the daily and weekly.
Fundamentals are good, I did hear they burnt through stacks of cash but this was for inventories. Future is bright for this techy and its these companies, Nvidia, Apple, Google etc that lead the markets bullish out of corrections.

GOLD(XAUUSD) -Weekly forecast,Technical Analysis & Trading IdeasMidterm forecast:
2772.38 is a major support, while this level is not broken, the Midterm wave will be uptrend.
OANDA:XAUUSD TVC:GOLD
Technical analysis:
A trough is formed in daily chart at 2832.55 on 02/28/2025, so more gains to resistance(s) 3000.00, 3050.00, 3080.00 and more heights is expected.
Take Profits:
2833.00
2879.11
2955.00
3000.00
3050.00
__________________________________________________________________
❤️ If you find this helpful and want more FREE forecasts in TradingView,
. . . . . . . . Hit the 'BOOST' button 👍
. . . . . . . . . . . Drop some feedback in the comments below! (e.g., What did you find most useful? How can we improve?)
🙏 Your support is appreciated!
Now, it's your turn!
Be sure to leave a comment; let us know how you see this opportunity and forecast.
Have a successful week,
ForecastCity Support Team

NZDCHF - Weekly Forecast - Technical Analysis & Trading IdeasMidterm forecast:
While the price is above the support 0.49439, beginning of uptrend is expected.
We make sure when the resistance at 0.52680 breaks.
If the support at 0.49439 is broken, the short-term forecast -beginning of uptrend- will be invalid.
OANDA:NZDCHF
Technical analysis:
A peak is formed in daily chart at 0.51845 on 02/20/2025, so more losses to support(s) 0.49950 and minimum to Major Support (0.49439) is expected.
Take Profits:
0.51043
0.51780
0.52680
0.53798
0.55094
0.56221
0.56728
0.57630
0.58900
0.60187
0.65051
__________________________________________________________________
❤️ If you find this helpful and want more FREE forecasts in TradingView,
. . . . . . . . Hit the 'BOOST' button 👍
. . . . . . . . . . . Drop some feedback in the comments below! (e.g., What did you find most useful? How can we improve?)
🙏 Your support is appreciated!
Now, it's your turn!
Be sure to leave a comment; let us know how you see this opportunity and forecast.
Have a successful week,
ForecastCity Support Team

RUNE/USDTHere i can see the best spot opportunity in RUNEUSDT as it is now on it's most important support level as it respect it's Support level it may show some good rally.

PPI, gold price opportunity to create new ATH above 2956⭐️Smart investment, Strong finance
⭐️GOLDEN INFORMATION:
Core CPI, excluding volatile food and energy prices, eased from 3.3% in January to 3.1% year-over-year, signaling ongoing disinflation in the U.S. economy.
Meanwhile, the Atlanta Fed’s GDPNow model projects a -2.4% contraction for Q1 2025, marking the first negative reading since the COVID-19 pandemic.
Money market traders have adjusted their expectations for Federal Reserve easing in 2025, pricing in 71 basis points of rate cuts—down from 77 bps the previous day, according to Prime Market Terminal data.
⭐️Personal comments NOVA:
Gold has accumulated, continues to grow and heads towards a new ATH: 2976
⭐️SET UP GOLD PRICE:
🔥SELL GOLD zone: $2954 - $2956 SL $2959 scalping
TP1: $2950
TP2: $2945
TP3: $2940
🔥SELL GOLD zone: $2975 - $2977 SL $2982
TP1: $2968
TP2: $2960
TP3: $2950
🔥BUY GOLD zone: $2920 - $2918 SL $2913
TP1: $2930
TP2: $2940
TP3: $2950
⭐️Technical analysis:
Based on technical indicators EMA 34, EMA89 and support resistance areas to set up a reasonable BUY order.
⭐️NOTE:
Note: Nova wishes traders to manage their capital well
- take the number of lots that match your capital
- Takeprofit equal to 4-6% of capital account
- Stoplose equal to 2-3% of capital account

EURCAD - Weekly Forecast - Technical Analysis & Trading IdeasOANDA:EURCAD
💡 Daily Timeframe:
As forecasted by 4CastMachine AI, The Euro also reached our TP7 at 1.5777 by breaking the resistance at 1.5156.
The broken resistance area will serve as our new support area and Buy Zone.
As long as this area is not broken down, there is a possibility of a resumption of the uptrend.
If the price enters our new buy zone with a corrective wave and is rejected from it, we will enter with buy trades.
💡 H4 Timeframe:
The bearish wave is expected to continue as long as the price is below the strong resistance at 1.5857
💡 H1 Timeframe:
The uptrend is broken, and price is in an impulse wave.
1.5729 support is broken now. It will act as a Resistance now!
Forecast:
Correction wave toward the Sell Zone
Another Downward Impulse wave toward Lower TPs
__________________________________________________________________
❤️ If you find this helpful and want more FREE forecasts in TradingView,
. . . . . . . . Hit the 'BOOST' button 👍
. . . . . . . . . . . Drop some feedback in the comments below! (e.g., What did you find most useful? How can we improve?)
🙏 Your support is appreciated!
Now, it's your turn!
Be sure to leave a comment; let us know how you see this opportunity and forecast.
Have a successful week,
ForecastCity Support Team

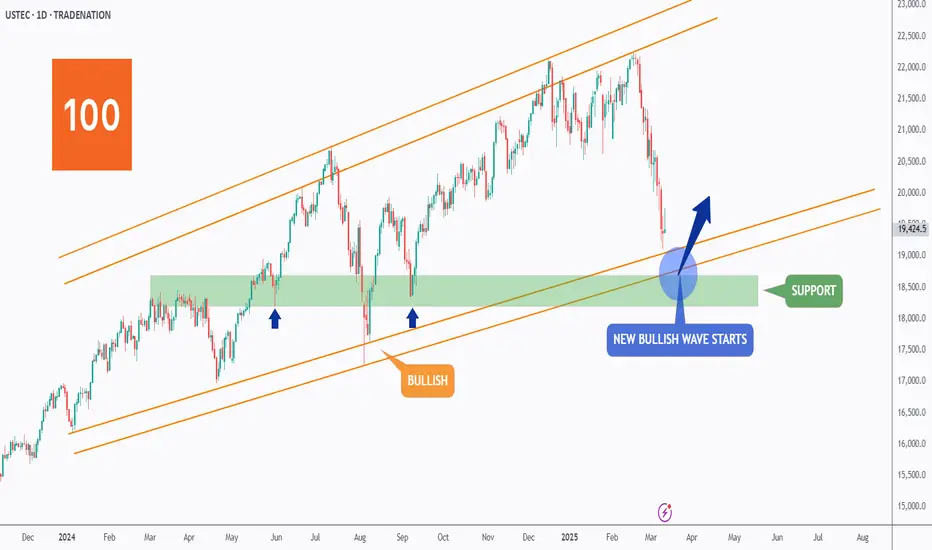
USTEC - Short-Term Pain, but...Hello TradingView Family / Fellow Traders. This is Richard, also known as theSignalyst.
📈Long-term, USTEC has been overall bullish trading within the rising channel marked in orange.
This month, USTEC has been in a correction phase, retesting the lower bound of the channel.
Moreover, the green zone is a strong support zone.
🏹 Thus, the highlighted blue circle is a strong area to look for buy setups as it is the intersection of support and lower orange trendlines acting as non-horizontal support.
📚 As per my trading style:
As #USTEC is hovering around the blue circle zone, I will be looking for bullish reversal setups (like a double bottom pattern, trendline break , and so on...)
📚 Always follow your trading plan regarding entry, risk management, and trade management.
Good luck!
All Strategies Are Good; If Managed Properly!
~Rich
Disclosure: I am part of Trade Nation's Influencer program and receive a monthly fee for using their TradingView charts in my analysis.