LTC Litecoin: Is the bottom in? Bottom in on LITECOIN? Are you bullish?
Long term im bullish on this coin as a side gig. Look how the ws are forming.. juicy?
Question is, have we bottomed or is more room to drop down to under 60EUR? It could drop even more, with the lunar eclipse coming on friday.. but we have hit the 78.6 already... RSI 44...
What do you think?
Longterm

USDCAD SHORTLongterm oportunity to short USDCAD. We are in bigger consolidation that we can see on Monthly chart. On weekly we touch upper area of consolidation and now we brake UP trend and currently we are in retracement.
Try to look for enteries for short.
SL: above highest point
TP: above lower band of consolidation (dont be too greedy)

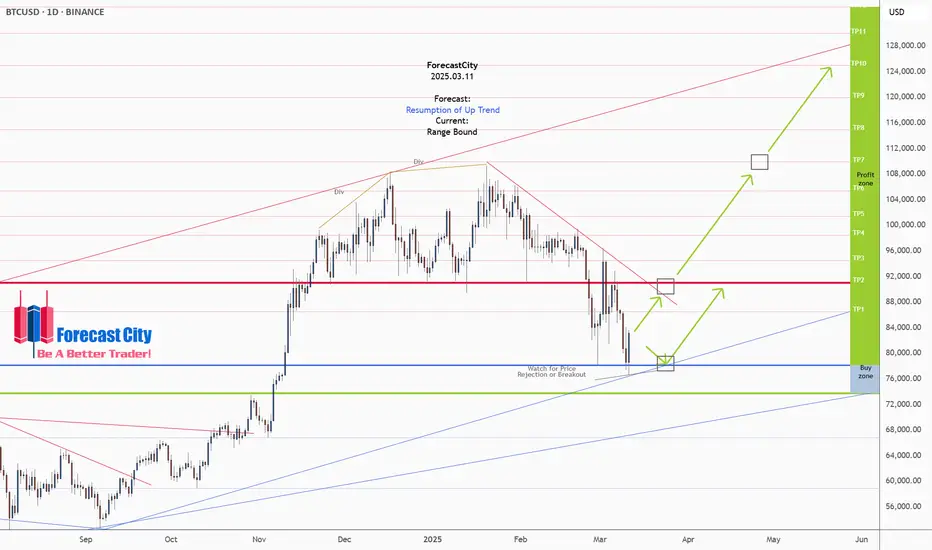
Bitcoin - Weekly Forecast - Technical Analysis & Trading IdeasMidterm forecast:
While the price is above the support 73777.00, resumption of uptrend is expected.
We make sure when the resistance at 91037.20 breaks.
If the support at 73777.00 is broken, the short-term forecast -resumption of uptrend- will be invalid.
BITSTAMP:BTCUSD
Technical analysis:
A peak is formed in daily chart at 109588.00 on 01/20/2025, so more losses to support(s) 78180.00 and minimum to Major Support (73777.00) is expected.
Take Profits:
86499.57
91037.20
94505.46
98489.63
101430.12
105431.17
109932.89
115000.00
120000.00
125000.00
__________________________________________________________________
❤️ If you find this helpful and want more FREE forecasts in TradingView,
. . . . . . . . Hit the 'BOOST' button 👍
. . . . . . . . . . . Drop some feedback in the comments below! (e.g., What did you find most useful? How can we improve?)
🙏 Your support is appreciated!
Now, it's your turn!
Be sure to leave a comment; let us know how you see this opportunity and forecast.
Have a successful week,
ForecastCity Support Team
130000.00
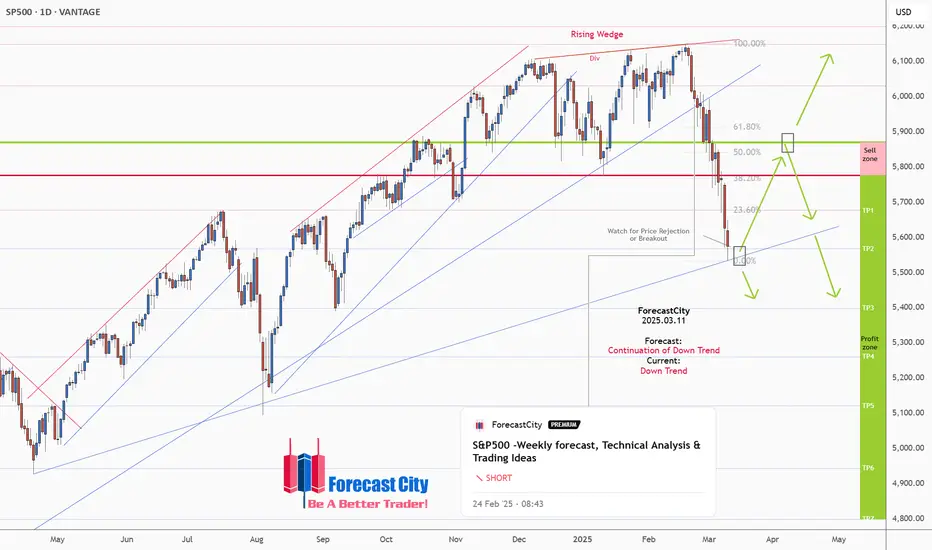
S&P500 -Weekly forecast, Technical Analysis & Trading IdeasMidterm forecast:
5870.56 is a major resistance, while this level is not broken, the Midterm wave will be downtrend.
$S&P500
Technical analysis:
A peak is formed in daily chart at 6150.05 on 02/19/2025, so more losses to support(s) 5568.78, 5398.95, 5261.00 and more depths is expected.
Take Profits:
5677.80
5568.78
5398.95
5261.00
5122.47
4944.41
4800.00
__________________________________________________________________
❤️ If you find this helpful and want more FREE forecasts in TradingView,
. . . . . . . . Hit the 'BOOST' button 👍
. . . . . . . . . . . Drop some feedback in the comments below! (e.g., What did you find most useful? How can we improve?)
🙏 Your support is appreciated!
Now, it's your turn!
Be sure to leave a comment; let us know how you see this opportunity and forecast.
Have a successful week,
ForecastCity Support Team
doge longterm buy spot"🌟 Welcome to Golden Candle! 🌟
We're a team of 📈 passionate traders 📉 who love sharing our 🔍 technical analysis insights 🔎 with the TradingView community. 🌎
Our goal is to provide 💡 valuable perspectives 💡 on market trends and patterns, but 🚫 please note that our analyses are not intended as buy or sell recommendations. 🚫
Instead, they reflect our own 💭 personal attitudes and thoughts. 💭
Follow along and 📚 learn 📚 from our analyses! 📊💡"

The Big ReloadI anticipate a significant pullback on the daily timeframe, targeting the $15,000 level before resuming the upward trend.
Following a substantial break in the bullish trend, a robust retracement is expected. This correction should trigger considerable buying momentum around the $15,000 to $16,000 range, presenting opportunities for long-term positions to the upside.

EURNZD - Weekly forecast, Technical Analysis & Trading IdeasMidterm forecast:
1.84895 is a major support, while this level is not broken, the Midterm wave will be uptrend.
Technical analysis:
A trough is formed in daily chart at 1.81705 on 02/21/2025, so more gains to resistance(s) 1.89340, 1.90550, 1.91400 and more heights is expected.
Supports and Resistances:
1.95650
1.90550
1.87650
1.85400
1.81700
1.78251
1.76500
__________________________________________________________________
❤️ If you find this helpful and want more FREE forecasts in TradingView,
. . . . . . . . Hit the 'BOOST' button 👍
. . . . . . . . . . . Drop some feedback in the comments below! (e.g., What did you find most useful? How can we improve?)
🙏 Your support is appreciated!
Now, it's your turn!
Be sure to leave a comment; let us know how you see this opportunity and forecast.
Have a successful week,
ForecastCity Support Team

BTC Time to FLY.As of now according to weekly chart i can see that the Market is on that resistance level of its channel, so what i think here is that the Market will goes according to its history, probability is market will retest 50 MA and will show the new high, after that it will move towards channel's support level.
So According to me, its the best time to be Bullish, or have some spot in portfolio.

BTC Warning Time .As of now according to weekly chart i can see that the Market is on that resistance level of its channel, so what i think here is that the Market will goes according to its history, probability is market will retest 50 MA and will show the new high, after that it will move towards channel's support level.
So According to me, its the best time to be Bullish, or have some spot in portfolio.

BTC - Get Ready!🚨 CRYPTOCAP:BTC is dipping hard! 🚨
📉 Get ready for a massive entry at $72,000—here’s why:
It aligns with:
1️⃣ Lower bound of the blue wedge pattern
2️⃣ Previous resistance turned support
3️⃣ Key demand zone
4️⃣ -34% correction phase
📊 This level could be a game-changer! Are you buying?

US500 Signaling Optimism!Hello TradingView Family / Fellow Traders. This is Richard, also known as theSignalyst.
📈Long-term, US500 has been overall bullish trading within the rising wedge pattern marked in blue.
This month, US500 has been in a correction phase, retesting the lower bound of the wedge.
Moreover, the green zone is a strong structure and previous ATH.
🏹 Thus, the highlighted blue circle is a strong area to look for buy setups as it is the intersection of structure and lower blue trendline acting as a non-horizontal support.
📚 As per my trading style:
As #US500 is hovering around the blue circle zone, I will be looking for bullish reversal setups (like a double bottom pattern, trendline break , and so on...)
📚 Always follow your trading plan regarding entry, risk management, and trade management.
Good luck!
All Strategies Are Good; If Managed Properly!
~Rich
Disclosure: I am part of Trade Nation's Influencer program and receive a monthly fee for using their TradingView charts in my analysis.

NF news - Opportunity for gold price to return to old ATH 2955⭐️Smart investment, Strong finance
⭐️GOLDEN INFORMATION:
Gold’s three-day rally came to a pause as investors locked in profits ahead of the highly anticipated US Nonfarm Payrolls report. A rise in US Treasury yields further dampened the appeal of the non-yielding metal. At the time of writing, XAU/USD remains steady at $2,918.
Despite consolidating above the $2,900 mark, gold faced resistance following an earlier surge in the US 10-year Treasury yield to a one-week high before retreating to 4.286%..
⭐️Personal comments NOVA:
Tariff Situation Remains Long Term Driver for Gold Growth, NF News Key Data to Determine Today's Trend
⭐️SET UP GOLD PRICE:
🔥SELL GOLD zone: $2954 - $2956 SL $2961
TP1: $2945
TP2: $2930
TP3: $2920
🔥BUY GOLD zone: $2832 - $2834 SL $2827
TP1: $2840
TP2: $2850
TP3: $2860
⭐️Technical analysis:
Based on technical indicators EMA 34, EMA89 and support resistance areas to set up a reasonable BUY order.
⭐️NOTE:
Note: Nova wishes traders to manage their capital well
- take the number of lots that match your capital
- Takeprofit equal to 4-6% of capital account
- Stoplose equal to 2-3% of capital account

UK100 (FTSE)-Weekly forecast, Technical Analysis & Trading IdeasMidterm forecast:
8380.25 is a major support, while this level is not broken, the Midterm wave will be uptrend.
Technical analysis:
A trough is formed in daily chart at 8611.20 on 02/21/2025, so more gains to resistance(s) 8854.99, 9000.00, 9100.00 and more heights is expected.
Take Profits:
8664.21
8765.00
8854.99
9000.00
9100.00
__________________________________________________________________
❤️ If you find this helpful and want more FREE forecasts in TradingView,
. . . . . . . . Hit the 'BOOST' button 👍
. . . . . . . . . . . Drop some feedback in the comments below! (e.g., What did you find most useful? How can we improve?)
🙏 Your support is appreciated!
Now, it's your turn!
Be sure to leave a comment; let us know how you see this opportunity and forecast.
Have a successful week,
ForecastCity Support Team

SWING IDEA - SAILSAIL Stock Technical Analysis
Steel Authority of India Limited ( NSE:SAIL ) has been consolidating around the 95 resistance level for over a year. After multiple attempts, the stock finally broke out above this level in January 2024, turning it into a strong support zone.
Following the breakout, SAIL surged to a peak of 175, marking an 85% gain. However, the stock then saw a sharp retracement, correcting by nearly 47% and revisiting the rising trendline support around the 100-105 range. This level, which previously acted as resistance, has now become a critical demand zone.
Currently, SAIL is showing signs of renewed bullish momentum, bouncing off its trendline support and forming a potential reversal. The weekly MACD crossover, observed in the chart, further reinforces a trend reversal signal. Additionally, a short-term upside target of 12% is indicated, while a long-term potential target of 76% upside is visible in the chart, aligning with the previous swing high.
The chart also highlights three take-profit targets:
Target 1: The first profit-taking zone, offering an initial opportunity to secure gains.
Target 2: A mid-level profit-taking zone, aligning with previous consolidation areas.
Target 3: The final take-profit level around 175, marking the prior high and a potential full exit point for long-term investors.
KEY OBSERVATIONS:
One-year resistance of 95 was decisively broken in January 2024
Stock surged 85% to a high of 175 before correcting 47%
100-105 level now acts as a strong rising trendline support
Weekly MACD crossover signals a bullish momentum shift
Three take-profit targets identified, with the final target at 175
Potential upside target of 76% from support levels, aligning with previous highs
RECOMMENDATION:
Based on this technical analysis, holding SAIL for the long term could be a strong strategy. The potential returns include:
12% upside in the short term
76% upside from current levels, targeting previous highs around 175
This analysis presents a compelling buying opportunity in SAIL, fueled by its breakout, support validation, and momentum reversal.
IMPORTANT NOTE:
Investors should be aware that there is a chance the stock may retest the 100-105 support level before resuming its upward trajectory. This potential pullback should be carefully monitored, and investment strategies should be adjusted accordingly.
DISCLAIMER: This analysis is for educational and informational purposes only and should not be considered as financial advice. Technical indicators and historical data are not guarantees of future performance. Investors should conduct thorough research, assess risk tolerance, and consult a financial advisor before making any investment decisions.

XRP Weekly-Monthly Analysis / Retracement Levels for BuyWeekly - Monthly trend: Bearish
Chart Pattern: Head & Shoulders (H&S) - Continuation Pattern
Retracement Fib Price Levels:
0.00% (3.4000)
23.60% (2.6879)
38.20% (2.2474)
50.00% (1.8914)
61.80% (1.5353)
78.60% (1.0284)
100.00% (0.3827)
Good prices for buy:
61.80% (1.5353) – Golden Zone / Golden Pocket
78.60% (1.0284) – Entry Zone
Between 78.60% (1.0284) and 100.00% (0.3827) is the Risk Zone, which we have the Neckline of the ‘’ Quadruple Bottom Pattern ‘’ at the price range ‘’ 0.6291 – 0.7850 ‘’

DOT in accumulation zone!Hello followers and haters,
I figured out that almost everyone here hates longterm analysis so I will post another one.
We can see DOT once again in beautiful accumulation zone , zone where I personally started accumulating tokens in previous cycle and in this one as well.
We are looking to take some profits on the FIRST TP where we can expect anywhere from 1 00% to 200% depending on our average buy price.
Second TP will bring us anywhere from 300% to 350%.
If we however drop even lower (WHICH WOULD BE AMAZING) there is an ALL-IN zone where I will be looking to put more money on my buys.
My accumulation is buying some DOT every 2-3 days while we are in the zone.
I marked only 2 TP zones for and as we will move UP in the BULL RUN I will post updates on where my next TP zones are.
Hope this helps, play it smart and stay patience!

USDCADLooking Ahead: USD/CAD Forecast for the Coming Years
When analyzing the future outlook of USD/CAD over the next few years, several key factors come into play, including economic policies, commodity prices, and overall market sentiment.

TSLA: Down 44% – Is This the Bottom?Tesla has been absolutely crushed since hitting its all-time high at $485. A 44% drop isn’t shocking after such a huge rally, but it’s still a brutal move. Now, we’re back into support, sitting near the level of Wave 1 – so far, nothing completely out of the ordinary.
Maybe to counter some of the selling pressure, Elon Musk tweeted yesterday that he sees a 1000% price increase in the next five years – if the work is put in. Take it however you want. The tweet probably gave TSLA a short-term boost, since Musk’s words always spark some level of hope. But we’ve seen this game before – big claims, and sometimes, reality doesn’t follow through.
Technically speaking:
As long as Tesla holds the order block between $240 and $260, or at least the current support, things don’t look too bad. But if that level breaks, things could get ugly – and $150 might not be far off.
For now, this remains one to watch.

Nifty 50 Long-Term Outlook: Bullish or Bearish ?NIFTY 50 VIEW :
KEY PONITS AND CONFIRMATIONS :
Monthly - Uptrend ( Higher Low )
Weekly - Take Support at 22500 - 22750
Pattern - Falling Wedge Formed
Indicator - RSI - 30 Level Maintain . Chance to buy
SETUP :
Wait for Pattern Breakout and 23800 Resistance Level.
More details and Level noted the chart .
Thank you , Happy Trading ...

Bitcoin - Weekly Forecast - Technical Analysis & Trading Ideas!Midterm forecast:
73777.00 is a major support, while this level is not broken, the Midterm wave will be uptrend.
Technical analysis:
A trough is formed in daily chart at 78181.05 on 02/28/2025, so more gains to resistance(s) 98489.63, 101430.12, 105431.17 and more heights is expected.
BITSTAMP:BTCUSD
Take Profits:
94200.00
98489.63
101430.12
105431.17
109932.89
115000.00
120000.00
125000.00
130000.00
134142.91
__________________________________________________________________
❤️ If you find this helpful and want more FREE forecasts in TradingView,
. . . . . Please show your support back,
. . . . . . . . Hit the 👍 BOOST button,
. . . . . . . . . . . Drop some feedback below in the comment!
🙏 Your Support is appreciated!
Let us know how you see this opportunity and forecast.
Have a successful week,
ForecastCity Support Team

GOLD(XAUUSD) -Weekly forecast,Technical Analysis & Trading Ideas💡 GOLD ( OANDA:XAUUSD )
💡 Daily Timeframe:
As forecasted last week, gold started its decline when it hit the red channel line.
This decline will continue, but the support area of 2789.95 to 2772.38 could trigger a rebound.
So, given the long-term uptrend, we can use this area as a long-term BUY ZONE.
💡 H4 Timeframe:
The uptrend is broken, and price is in an impulse wave.
The bearish wave is expected to continue as long as the price is below the strong resistance at 2893.51
💡 H1 Timeframe:
2879.11 support is broken now. It will act as a Resistance now!
Forecast:
Correction wave toward the Sell Zone
Another Downward Impulse wave toward Lower TPs
SL: Above 2893.51
__________________________________________________________________
❤️ If you find this helpful and want more FREE forecasts in TradingView,
. . . . . . . . Hit the 'BOOST' button 👍
. . . . . . . . . . . Drop some feedback in the comments below! (e.g., What did you find most useful? How can we improve?)
🙏 Your support is appreciated!
Now, it's your turn!
Be sure to leave a comment; let us know how you see this opportunity and forecast.
Have a successful week,
ForecastCity Support Team

GBPUSD Daily, H4,H1 Forecasts, Technical Analysis & Trading Idea💡 Daily Timeframe:
FX:GBPUSD has been in a Range Bound recently. It touched and rejected from 1.2700 major resistance today.
A peak is formed in daily chart at 1.27150 on 02/26/2025, so more losses to support(s) 1.25107, 1.23609, 1.22589 and minimum to Major Support (1.20981) is expected.
💡 Four-hour Timeframe:
The uptrend is broken, and price is in an impulse wave.
The bearish wave is expected to continue as long as the price is below the strong resistance at 1.2715
💡 One-hour Timeframe:
1.2640 support is broken now. It will act as a Resistance now!
A strong bearish divergence has also formed in the RSI.
Forecast:
Correction wave toward the Sell Zone
Another Downward Impulse wave toward Lower TPs
SL: Above 1.2715

EURUSD -Weekly forecast, Technical Analysis & Trading Ideas💡 Daily Timeframe:
EURUSD has been in a Range Bound recently. It touched and reject from 1.0528 major resistance today.
A peak is formed in daily chart at 1.05285 on 02/26/2025, so more losses to support(s) 1.03570, 1.02920 and minimum to Major Support (1.01779) is expected.
💡 Four-hour Timeframe:
The uptrend is broken, and price is in an impulse wave.
The bearish wave is expected to continue as long as the price is below the strong resistance at 1.0528
A strong bearish divergence has also formed in the RSI.
💡 One-hour Timeframe:
1.0457 support is broken now. It will act as a Resistance now!
Forecast:
1- Correction wave toward the Sell Zone
2- Another Downward Impulse wave toward Lower TPs
SL: Above 1.0528
__________________________________________________________________
❤️ If you find this helpful and want more FREE forecasts in TradingView,
. . . . . . . . Hit the 'BOOST' button 👍
. . . . . . . . . . . Drop some feedback in the comments below! (e.g., What did you find most useful? How can we improve?)
🙏 Your support is appreciated!
Now, it's your turn!
Be sure to leave a comment; let us know how you see this opportunity and forecast.
Have a successful week,
ForecastCity Support Team
