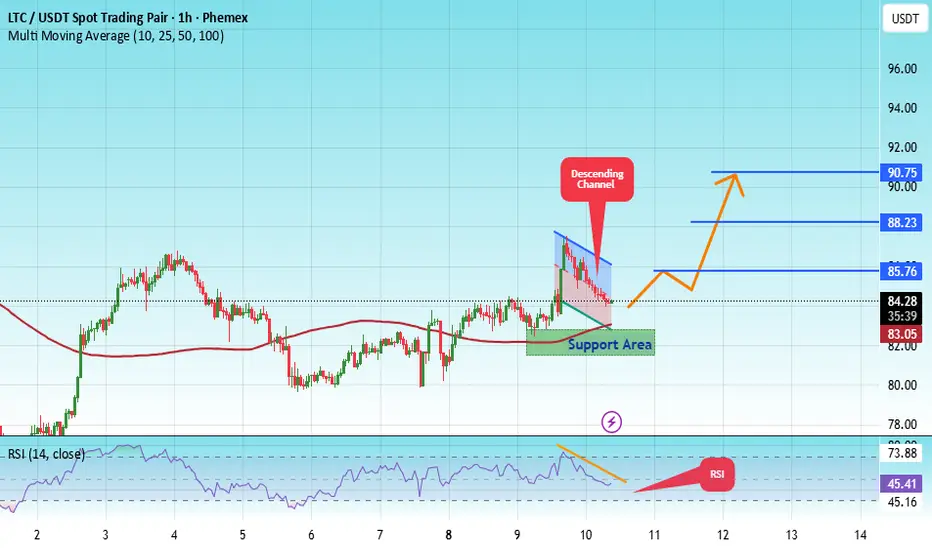
#LTC/USDT analysis.Give me some energy !!!#LTC
The price is moving in a descending channel on the 1-hour timeframe. It has reached the lower boundary and is heading towards breaking above it, with a retest of the upper boundary expected.
We have a downtrend on the RSI indicator, which has reached near the lower boundary, and an upward rebound is expected.
There is a key support zone in green at 82.00. The price has bounced from this level multiple times and is expected to bounce again.
We have a trend towards stability above the 100-period moving average, as we are moving close to it, which supports the upward movement.
Entry price: 84.29
First target: 85.76
Second target: 88.23
Third target: 90.75
Don't forget a simple principle: money management.
Place your stop-loss below the support zone in green.
For any questions, please leave a comment.
Thank you.
LTCUSD
LTC is going up or down ? Answer is be patience I still consider the LTC a Buy, for a potential of good returns and growth by 2027. At present it looks like many manipulators raising the fear index and making price fail under low volatility conditions. If we have to not fall in trap the only way is to stay patience even it shows a sharp fall to 65. Don’t make panic selling and account losses on your ledger. Let the market stable. Consider your 2x to 4x returns only by 2027 and stay quiet for now.
Just my opinion, be cautious on your investment strategy decisions.

LITECOIN can easily hit $43 in the next 10 months.Litecoin (LTCUSD) started its new Bear Cycle after a rejection on the 4-year Lower Highs trend-line. Now that it sits below its 1W MA200 (orange trend-line), which was formally a Resistance during the Bull Cycle, we can claim that the next stage should be targeting the Higher Lows 1 trend-line.
Given that all previous Bear Cycles lasted for at least a year and that the last one dropped less than the 2018, we can expect LTC's new Bear Cycle to last up until August 2026 at least. Even a 'modest' decline should still see it targeting Higher Lows trend-line 2, which by the end of August 2026 should have hit $43.00 at least.
---
** Please LIKE 👍, FOLLOW ✅, SHARE 🙌 and COMMENT ✍ if you enjoy this idea! Also share your ideas and charts in the comments section below! This is best way to keep it relevant, support us, keep the content here free and allow the idea to reach as many people as possible. **
---
💸💸💸💸💸💸
👇 👇 👇 👇 👇 👇

FireHoseReel | LTC:When does Litecoin explode next?🔥 Welcome to FireHoseReel!
Let’s dive into the 4H Litecoin (LTC) analysis.
👀 Litecoin is currently trading below a descending curve trendline.
Each time price hits this curve, it gets rejected to the downside. Price is now approaching the end of this compression zone, while a key support has formed at $81.48 near the bottom.
📊 Litecoin volume has been declining during the recent drop and is now at very low levels.
Once volume expands again, any upcoming move in LTC is likely to become more impulsive and powerful.
✅ The LTC/BTC pair is also in a strong corrective phase, showing a noticeable decline in Litecoin’s relative strength against Bitcoin.
✍️ You can review the main Litecoin scenarios below and use them alongside your own trading strategy if needed.
🟢 Long Scenario:
A breakout above the descending curve trendline, followed by a clean pullback, and then a push toward the static resistance at $87.42 with rising buy volume, could activate our long trigger.
🔴 Short Scenario:
A breakdown below the $81.48 support with a confirmed close below this level and increasing sell volume could activate our short trigger.
❤️ Risk Management & Emotional Discipline
Crypto trading is highly risky. Without proper risk management and emotional control, trading is no different from gambling.
Logic must always come before emotions. Learn to manage your trades—and enjoy the process of trading with control and discipline.

Litecoin LTC/USD Buy The Fear Sell The EuphoriaI haven't made a Litecoin chart in a while. We've been sideways and uneventful, figured I would wait till something eventful happens. Well here it is folks , the moment before we actually move up everyone is selling except for a few smart hands. This fractal says it all in my opinion. fractals are usually very similar but not exact. Where we are now in price for Litecoin around 83 is really close to the bottom of this pullback. It washed out and cleaned up all the leverage, a very common occurrence in this market before large moves up. The move will be absolutely explosive and probably no meaningful pullback until we break the all time high. I see a pullback to retest the high before the next massive leg up.
Right now in my opinion is the worst place to sell. I know this "bear market" is not a real bear market because of how many people are saying it is. The whole world says its a bear market right now, every youtube grifter has pivoted to bear market recently with this drop, every news channel is saying it is. Thats why its not, most have sold already and now the price I believe will rebound so fast it'll shock everyone and the ones who sold will be in denial waiting for the "next low". When that low doesn't come and we break the highs they will all pile back in.
Everyone says oh this moving average, or this indicator, or this RSI. Look its all helpful stuff but its also all imaginary lines. Who says that we MUST be in a bear market because we broke a 200 day moving average. Who says because RSI is overbought we must go down. RSI has infinite different adjustments so whos to say that the 14 length is correct? These indicators will begin to fail over time as more and more people look at them. Right now there is more traders and wanna be traders in the world than ever before so if everyone is looking at the same thing all the time then most likely those will start to fail. Oh its happened every time before , I know , I know. Come on at the end of the day Bitcoin is still in its infancy. I dont buy the four year cycle, or seasonality crap, its foolish and betting your portfolio on those factors alone is a recipe for BROKE! I still stand by my previous long term predictions. Obviously its taking much longer than I expected but timing these things is nearly impossible on the long term time frame. While all the youtube grifters flip flop weekly I listen to the Billonaires and people who MAKE the markets. Saylor said three days ago the pullback is almost over and hes buying. Blackrocks Robbie Mitchnick says this is a good buying area and thats just a couple theres dozens of big wigs saying the same thing.
So to wrap this up I believe we are at the point of rocket ship. Look at economic factors, liquidity worldwide is expanding, stimulus is coming, tightening is ending, rates are coming down. Fiat currencies worldwide are about to go into hyperinflation and certain cryptos will reap the benefit of that. Bitcoin and Litecoin being the top gainers in this next phase of hyperinflation in my opinion. This is just my opinion and not financial advice. Thank you

Litecoin: Target Zone Within ReachLTC has recently continued its decline, leading us to believe that the high for green wave B is likely already in place. Price is now just a short distance from our green Target Zone, which ranges from $78.52 to $64.53. Within this zone, we expect to see the low of orange wave ii. Afterward, orange wave iii should drive price above the resistance levels at $118.71 and $147.06.

LTC Litecoin Poised For Something Big Macro Style I still see lots of people selling and capitulating. Thats ok that cant be prevented, most have no idea how markets work and those same people are afraid of their own shadow. The capitulation is almost over. I just want to point out the confluence of various indicators on the macro long term time frame pointing to a massive bull run for Litecoin. This is not financial advice just my opinion. Like and follow for more updates.
LITECOIN Analysis (4H)It appears that a double correction is forming on Litecoin and is nearing completion. Around the origin zone, we can look for long buy positions so that once this second corrective leg finishes, the price can enter a bullish phase.
The entry zone and targets are marked on the chart.
For risk management, please don't forget stop loss and capital management
When we reach the first target, save some profit and then change the stop to entry
Comment if you have any questions
Thank You

LTCUSD - Symmetrical Triangles As seen in the first symmetrical triangle a massive break out followed
If the second is anything like the first we can expect a breakout like that one
I have posted this chart before but it really is a strong bull option for a long term altcoin.
Weekly timeframe

LTCUSD H4 | Could We See A Bullish Reversal?Momentum: Bullish
The price has recently bounced off the identified buy-entry level, which aligns with the pullback support zone.
Buy Entry: 889.05
Pullback support
Stop Loss: 79.91
Swing-low support
Take Profit: 102.38
Pullback resistance
Positioned slightly below the 61.8% Fibonacci retracement
High Risk Investment Warning
Stratos Markets Limited (tradu.com ), Stratos Europe Ltd (tradu.com ):
CFDs are complex instruments and come with a high risk of losing money rapidly due to leverage. 70% of retail investor accounts lose money when trading CFDs with this provider. You should consider whether you understand how CFDs work and whether you can afford to take the high risk of losing your money.
Stratos Global LLC (tradu.com ): Losses can exceed deposits.
Please be advised that the information presented on TradingView is provided to Tradu (‘Company’, ‘we’) by a third-party provider (‘TFA Global Pte Ltd’). Please be reminded that you are solely responsible for the trading decisions on your account. Any information and/or content is intended entirely for research, educational and informational purposes only and does not constitute investment or consultation advice or investment strategy. The information is not tailored to the investment needs of any specific person and therefore does not involve a consideration of any of the investment objectives, financial situation or needs of any viewer that may receive it. Past performance is not a reliable indicator of future results. Actual results may differ materially from those anticipated in forward-looking or past performance statements. We assume no liability as to the accuracy or completeness of any of the information and/or content provided herein and the Company cannot be held responsible for any omission, mistake nor for any loss or damage including without limitation to any loss of profit which may arise from reliance on any information supplied by TFA Global Pte Ltd.


LTCUSDT : Full analysisHello friends
well you see that the power is in the hands of the sellers and we must have sufficient approvals to buy.
So you see, we have two important support areas that we have identified for you with Fibonacci, and they can be good supports. We need to see how buyers react in these areas.
Well, the next point is that despite the sharp drop in Bitcoin, Litecoin did not fall much. It fell by almost half of Bitcoin. Considering the previous times I saw that when Bitcoin fell, other currencies fell several times as much, and this is a good sign (meaning that its holders have a positive view of the currency).
But to buy, we need to know where and when to buy, to find the best point to buy and to take our profits at the best point. For this reason, we expect that Litecoin will most likely bottom out again and buy in support areas with risk and capital management and in steps And to move with the specified goals.
*Trade safely with us*

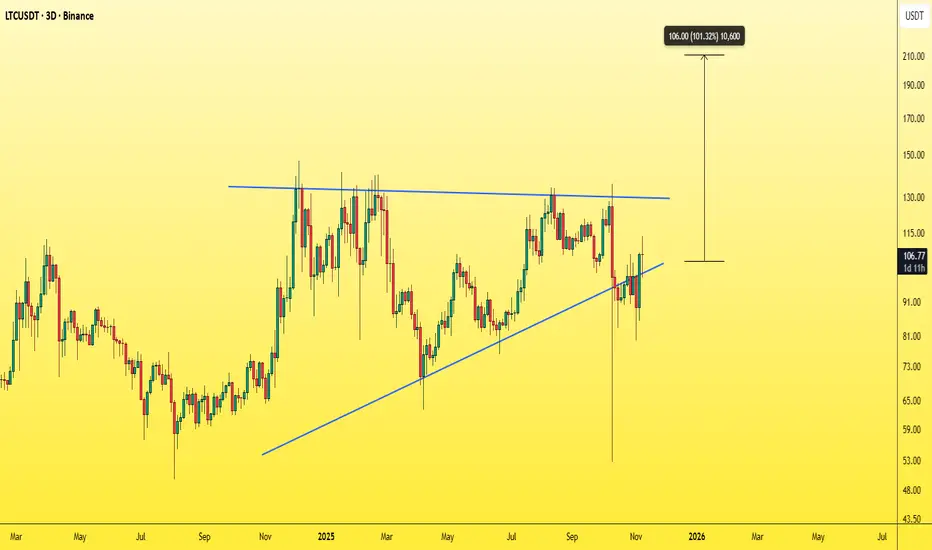
LTC: Don’t FOMO, Wait for Confirmation$LTC/USDT is getting squeezed between the rising trendline and the overhead resistance zone. Price has tested this resistance multiple times before but failed to break through.
A potential upside move could develop if we finally see a clean close above the marked zone.
Until then, it’s best to stay patient, don’t FOMO, wait for a clear breakout pattern.
DYOR, NFA

LTC Following Perfect Trend, May Breakout SOON !!! Keep an eye on these 2 trendlines for perfect setup
I have bought LTC as per below :
Bought Price : 120
TP : 130 +
Tight SL : 118 (To avoid risk)
LTCBTC Monthly – Multi-Year Downtrend Nearing Exhaustion?RSI Structure Suggests a Major Reversal Brewing
Timeframe: 1M (Monthly)
LTCBTC has spent almost a decade grinding lower inside a clearly defined multi-channel descending structure. Every major rally has formed a lower high, respecting long-term trendlines dating back to 2014–2015.
Price is now compressing at the bottom of the macro falling wedge/channel, with volatility at historic lows and volume drying up—a structure that often precedes a major trend change.
📐 Price Structure
1. Macro Downtrend Channels
Red support line marks the absolute long-term floor, tested several times since 2023–2025.
Price is currently sitting right on that red long-term support, with early signs of demand returning.
2. Volume Profile
Volume has been steadily decreasing for years.
This type of volatility + volume contraction at major support has historically preceded large expansions (both bullish or bearish, but combined with RSI, the bullish case is stronger).
📊 RSI Momentum Analysis
This is the strongest part of the chart.
1. Long-Term RSI Downtrend (Orange)
RSI has been respecting a 10-year descending trendline, creating lower highs since 2017.
Price is approaching this trendline again from below.
A monthly breakout above this RSI resistance would be the first macro bullish confirmation in nearly a decade.
2. RSI Higher Lows (Red)
Despite price making flat or lower lows, RSI is making higher lows, creating:
A long-term bullish divergence
A tightening momentum structure, signaling diminishing seller strength
This is the exact structure seen before previous LTCBTC macro reversals.
📈 Bullish Case
If LTCBTC holds the red support and RSI continues upward:
Key bullish triggers:
🔵 Monthly RSI breakout above the orange resistance line
🟢 Monthly close above the orange descending price channel
🟩 Volume expansion returning after multi-year compression
Targets on breakout (from conservative to aggressive):
0.0022 (bottom of mid-green channel)
0.0040 (mid of macro channel)
0.0060–0.0080 (top of the long-term green channel)
📉 Bearish Case
If LTCBTC loses the red macro support:
Structure invalidation
Retest of historical lows
Continuation of multi-year bleed
This would require RSI also rejecting at the orange line and rolling over.
📌 Conclusion
LTCBTC is sitting on a once-per-cycle support zone while RSI prints a multi-year bullish divergence and approaches a key breakout trendline.
This is one of the most interesting long-term setups on the chart in 2025.
Price compression + RSI compression + long-term support often leads to explosive moves.
Not financial advice — just a chart-based idea.

LTC LONG ENTRY 🚀 Trade Setup
🟢 Entry Range: $93 – $96
🎯 Targets :
1️⃣ $100
2️⃣ $105
3️⃣ $115
4️⃣ $125
🔴 Stop-Loss: Below $85
📊 Plan the trade, then trade the plan — patience is key!

Litecoin LTC price analysis📉 For weeks, OKX:LTCUSDT has been holding strong
And guess what — this consolidation has lasted over 3.5 years! 😮
💭 The last real pump was back in early 2021... feels like it’s time for a sequel, right? 😉
Now, here’s the interesting part:
🔹 Litecoin has the same tokenomics and mining method as Bitcoin ( CRYPTOCAP:BTC ) and
🔹 Recently, another “old school” coin — CRYPTOCAP:ZEC — just pumped hard 💥
🔹 And there are rumors about a potential LTC ETF 😏
With a current market cap of only $7.7B, there’s plenty of room to grow.
So maybe... just maybe... CRYPTOCAP:LTC at $900 isn’t that crazy after all? 🚀
What do you think — are we on the verge of a new #Litecoin era? 👇
______________
◆ Follow us ❤️ for daily crypto insights & updates!
🚀 Don’t miss out on important market moves
🧠 DYOR | This is not financial advice, just thinking out loud
LTC is shaping a global bullish flagLTC is forming a global bull flag pattern, and the asset has remained in the accumulation phase since 2022. At a more local level, a butterfly pattern formed but did not complete its move to point D. Afterward, the price entered a local descending channel, which often forms part of a bull flag formation. It's highly likely that after breaking out of the local pattern, the movement will continue as a local ascending channel within the global structure.
If the global pattern's boundaries are broken, the highs formed since 2024 may be renewed.
A resistance zone (purple area) is also highlighted on the chart, where increased LTC buying activity is observed.
Dropping the price below 70 and holding it there doesn't make much sense, as the accumulation zone has formed above.
More detailed analysis, additional charts, and key levels to watch are available on our site

LTC/USD Market Flow Blueprint – Bearish Bias Confirmed!🎯 LTC/USD: The Great Support Heist 🏴☠️ | Bearish Breakdown Blueprint
📊 Market Overview
Asset: LTC/USD (Litecoin vs. U.S. Dollar)
Market: Cryptocurrency
Trade Type: Swing Trade (Bearish Setup)
Strategy Style: "Thief Method" - Multi-Layer Limit Orders
🔍 Technical Analysis
Litecoin has officially broken through its STRONG SUPPORT ZONE, confirming a bearish market structure. This isn't just a casual dip—we're looking at a genuine breakdown that's validated by price action closing below critical support levels. The bears are in control, and the path of least resistance is pointing south. 🐻📉
What's Happening?
✅ Support zone broken with conviction
✅ Market structure showing lower highs forming
✅ Momentum shifting to the downside
✅ Volume confirming the breakdown
🎯 Trade Plan Breakdown
📍 Entry Strategy: "The Thief Layer Method"
Instead of going all-in at one price (rookie move 😅), we're using a multi-layer limit order strategy to build our position as price moves. Think of it as setting multiple traps along the way down.
Suggested Sell Limit Layers:
🎪 Layer 1: $92.00
🎪 Layer 2: $90.00
🎪 Layer 3: $88.00
Pro Tip: You can add more layers based on your risk appetite and position sizing strategy. Scale in, don't gamble in! 🎲
🛑 Stop Loss: $96.00
This stop is placed at the previous market structure's nearest higher high wick. Why? Because if price reclaims this level, it invalidates our bearish thesis and tells us the breakdown was fake news. 🚫
⚠️ IMPORTANT DISCLAIMER: This is MY stop loss based on MY analysis and risk tolerance. You should ALWAYS determine your own stop loss based on YOUR risk management rules. Trade your own plan, not mine! Your money, your rules. 💰
🎁 Target: $75.00
Our profit target sits at a confluence zone where we're expecting:
💎 Strong historical support
💎 Oversold conditions (RSI likely stretched)
💎 Bull trap potential zone
💎 Possible trend reversal area
This is where smart bears become bulls and take profits off the table. Don't be greedy—secure the bag! 💼
⚠️ IMPORTANT DISCLAIMER: This target is based on MY analysis. You should set YOUR OWN take profit levels based on YOUR trading plan and risk management. Lock in profits when YOU feel comfortable. Your capital, your decision! 🎯
🔗 Related Pairs to Watch
Keep an eye on these correlated assets for confluence:
BITSTAMP:BTCUSD - The king leads, alts follow. If Bitcoin dumps, LTC usually amplifies the move 👑
BITSTAMP:ETHUSD - Major alt indicator. Ethereum weakness = altcoin pain 🌊
BINANCE:LTCBTC - Shows LTC's relative strength against Bitcoin. Watch for breakdown here too 📊
TVC:DXY (Dollar Index) - Strong dollar = crypto weakness typically 💵
Correlation Play: Crypto markets move as a herd. When Bitcoin sneezes, Litecoin catches pneumonia. Watch BTC dominance and overall market sentiment. If BTC is showing weakness at key levels, it adds conviction to this LTC short setup. 🧩
📝 Key Takeaways
Confirmation is King - We're not guessing; the support break is confirmed ✅
Layer Your Entries - Don't blow your load at one price. Build the position strategically 🎯
Respect Your Risk - Stop loss is there for a reason. Use it. Love it. Don't delete it. 🛡️
Take Profits - The market doesn't care about your feelings. When you hit target, TAKE THE MONEY 💰
Stay Flexible - Markets change. If the setup invalidates, move on. No ego in trading 🧘
⚡ The Thief Philosophy
This isn't financial advice—it's a treasure map. 🗺️ You still have to dig, avoid the traps, and know when to run. The "Thief Method" is all about stealth entries, calculated risk, and knowing when to escape with the loot before the guards (market reversal) catch you.
We're not gambling; we're executing a heist. Plan the job, execute with discipline, and don't get caught holding bags. 🏴☠️💼
🎬 Final Words
Markets don't reward hope; they reward preparation and execution. This setup offers a solid risk-reward if you manage it properly. Remember: Your trade, your risk, your responsibility. I'm just sharing what I see and how I'm playing it.
Stay sharp, trade safe, and may your stop losses never get hit. 🎯🚀
✨ If you find value in my analysis, a 👍 and 🚀 boost is much appreciated — it helps me share more setups with the community!
#LTCUSD #Litecoin #CryptoTrading #BearishSetup #SwingTrade #TechnicalAnalysis #ThiefMethod #CryptoAnalysis #TradingStrategy #ShortSetup #CryptoTA #LTC #SupportBreakdown #LayeredEntry #RiskManagement

LTCUSDT - Time to wake up for this Monster!As usual, any popular coin like LTC tends to make you lose hope right before a major rally — it usually forms a bearish-looking triangle, breaks downward, and makes everyone think a bear market has started.
Here’s how you know it’s actually preparing to pump:
It gives a very bearish signal on the chart — spot traders panic sell at a loss, long traders get liquidated or trapped, and short traders start feeling confident right before price reverses and pumps hard.
When everyone’s losing, that’s when the path upward becomes clear and safe.
I believe a 100% move from here is the minimum we’ll see.
Best Regards:
Ceciliones🎯
TC and ICP · The Quiet Storm Before the BreakoutMarkets are buzzing again after Trump mentioned a possible “tariff dividend” – a $2,000 payout per person funded by tariffs. It reminds many of 2020’s stimulus wave that pushed Bitcoin from $4K to $69K. If liquidity returns, older assets like Litecoin COINBASE:LTCUSD and Internet Computer BINANCE:ICPUSDT could be the next to move.
LTC: The Silent Giant
Litecoin is showing one of the cleanest technical setups in the market. The monthly chart forms a massive symmetrical triangle that’s been tightening since 2018. LTC just reclaimed the $108–$110 zone, sitting right below resistance. A monthly close above it could confirm a breakout toward $175 or more.
Historically, LTC rallies begin in November – right before broader altcoin seasons. The pattern from 2017 and 2020 looks set to repeat. If it does, the next rally could align perfectly with the 2025 halving cycle.
LTC Trading Plan:
- Breakout: $135
- Resistance: $160–$170
- Cut Loss: $70
- Targets: $240 / $400 / $600 / $1000
ICP: Rising Scarcity, New Narrative
Coinbase reserves of ICP have hit record lows. Only ~284,000 tokens remain on the exchange, while Binance’s reserves grow. This shift hints at growing demand.
Coinbase’s CEO recently talked about taking the exchange onchain, and ICP’s tech is one of the few ready for that move. With 44% of its supply locked, ICP’s real market cap is smaller than it looks, making it ripe for repricing.
ICP Trading Plan:
- Entry: $6.0–$7.0
- Stop: $5.0
- Targets: $11 / $12.5 / $14 / $20
Both LTC and ICP show strong asymmetry. One stands on historical cycles, the other on real scarcity and narrative growth. The setup looks familiar – quiet now, but maybe not for long.
TheCryptoFire

$LTC LONG IDEAThe coin has fully formed an ABCDE pattern.
To confirm it, we need a break above wave D.
Potential: $300–500.
Possible risks: if wave D is broken and the price moves to capture wave E (or immediately forms wave C), the scenario becomes invalidated.
For now, the setup remains active and valid.

LTC at the Edge? — Hold $100 and We May Have a Ride to $300+ 📊 LTC Price Update | Major Level on Watch
Litecoin (LTCUSDT) is currently holding the $100 support — a crucial psychological and technical level.
If buyers manage to hold above $100, momentum could build toward the next key resistance zone near $135.
🔹 Key Levels:
Support: $100 (must hold for bullish structure)
Resistance: $135 – breakout here confirms mid-term reversal
Upside Target: $300+ possible if $135 breaks with volume
🔸 Market Outlook:
Price consolidation above $100 is showing early signs of accumulation.
A strong breakout above $135 could mark the beginning of a long-term uptrend, targeting the $250–$300 region.
Failure to defend $100, however, would risk revisiting lower demand zones around $85.
🧭 Strategy:
Watch for daily closes above $135 for trend confirmation. Until then, $100 remains the line in the sand for bulls.
