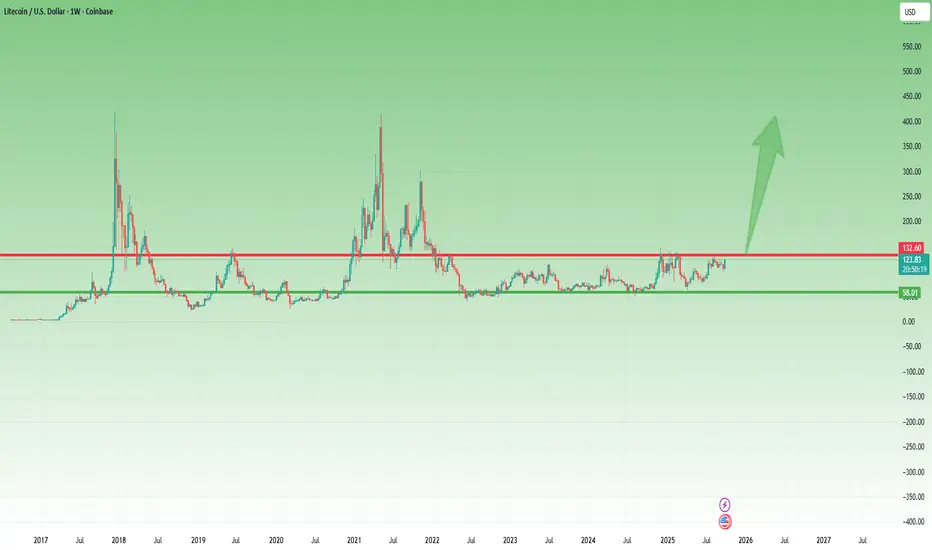
LTC/USDT — The Calm Before The Storm: A Major Move Is Brewing!Litecoin is currently trading inside an extended Symmetrical Triangle formation that has been developing since mid-2021.
Each price swing is tightening between two major trendlines, compressing volatility like a coiled spring ready to snap.
📊 At around $104, LTC is sitting right at a decision point, where the battle between bulls and bears is approaching its climax.
The next confirmed breakout — either up or down — will likely define Litecoin’s macro trend for the months ahead.
---
Pattern & Technical Structure
Main Pattern: Symmetrical Triangle (neutral → directional bias confirmed only after breakout)
Upper Resistance Zone: $110–$120 (descending trendline)
Horizontal Resistance: $134 (key pivot level), followed by $281–$295 (major historical resistance)
Support Zone: rising trendline around $85–$90, with strong historical supports at $69 and $40
Volatility: extremely compressed, suggesting an imminent expansion phase
---
Bullish Scenario
If LTC manages to break and close weekly above $120–$134 with solid volume, a macro trend reversal could ignite.
🎯 Initial Target: $134 (confirmation zone)
🎯 Mid-term Target: $200
🎯 Major Target: $281–$295
🛡️ Invalidation: weekly close back below the upper trendline
Such breakouts after long compressions often lead to explosive upside moves, as months of built-up energy get unleashed in one direction.
---
Bearish Scenario
If sellers take control and LTC breaks below $85, a significant downside move could unfold.
⚠️ First Target: $69
⚠️ Next Target: $46–$40 (major liquidity zone)
🛡️ Invalidation: price reclaims the broken support on a weekly close
A clean breakdown would likely trigger a capitulation flush, but could also offer long-term accumulation opportunities near historical lows.
---
Market Outlook & Conclusion
Litecoin is now sitting at the tip of a multi-year triangle — a structure that rarely stays quiet for long.
When such formations appear on the weekly timeframe, the next expansion phase usually brings a major directional shift.
Both sides are on alert — one decisive candle could rewrite the chart entirely.
📈 Key takeaway: Stay patient, stay prepared.
The volatility storm is loading — and it’s only a matter of time before it erupts.
---
#LTCUSDT #Litecoin #CryptoAnalysis #BreakoutAlert #SymmetricalTriangle #TechnicalAnalysis #CryptoTA #MarketStructure #SwingTrading
LTCUSD

Litecoin — Long-Term Accumulation and Breakout Setup (1W Chart)We have a blue horizontal accumulation zone, which has been acting as the cycle bottom area since 2018.
From this zone, long-term positions can be built with partial profit-taking targets at the yellow, red, and violet zones — each representing stages of distribution and de-risking from the accumulated position.
Additionally, we can observe a massive triangle formation.
If this pattern plays out, the breakout target zones are clearly indicated on the chart.
At the bottom, the blue line inside the white frame marks an additional support level, which may serve as a final retest zone before the next upward cycle.
LTC - GREAT Potential : ALT for 2026Hello Traders 📈
LTC / Litecoin may still present great opportunities for 2026.
From a bigger perspective, it may seem like LTC doesn't move much. But if we zoom in, we see massive bounces over the course of 3-4 weeks which presents big opportunities if you can buy in low:
From a technical indicator perspective, in the 4h LTC is still trading UNDER< showing that bears are still in control:
In the daily, we still see the same story however there seems to be a bullish W pattern appearing. As soon as the price reclaims the MA in the DAILY timeframe , that would be the first positive indicator of more upside:
For the short term, we need to see LTC trade ABOVE ALL the 4h moving averages in order to begin anticipating a bigger move up.

LTC : ETFHello friends
Due to the US government shutdown and the Lit coin ETF request that has been raised and is being reviewed, when the government and relevant institutions reopen, it is most likely that the ETF will be approved and expected. Now that the price has corrected and the good decline we had, there is a good opportunity to buy in steps in the specified areas with capital and risk management and move with it to the specified goals.
*Trade safely with us*

LTCUSD H4 | Bullish Bounce Off Pullback SupportLTC/USD has bounced off the buy entry which is a pullback support that aligns with he 50% Fibonacci retracemnt and could rise from this level to the upside.
Buy entry is at 96.09, which is a pullback support that aligns with he 50% Fibonacci retracemnt.
Stop loss is at 84.76, which is a swing low support.
Take profit is at 115.31, whichis a pullback resistance that aligns with the 61.8% Fibonacci retracemnt.
Stratos Markets Limited (tradu.com ):
CFDs are complex instruments and come with a high risk of losing money rapidly due to leverage. 68% of retail investor accounts lose money when trading CFDs with this provider. You should consider whether you understand how CFDs work and whether you can afford to take the high risk of losing your money.
Stratos Europe Ltd (tradu.com ):
CFDs are complex instruments and come with a high risk of losing money rapidly due to leverage. 70% of retail investor accounts lose money when trading CFDs with this provider. You should consider whether you understand how CFDs work and whether you can afford to take the high risk of losing your money.

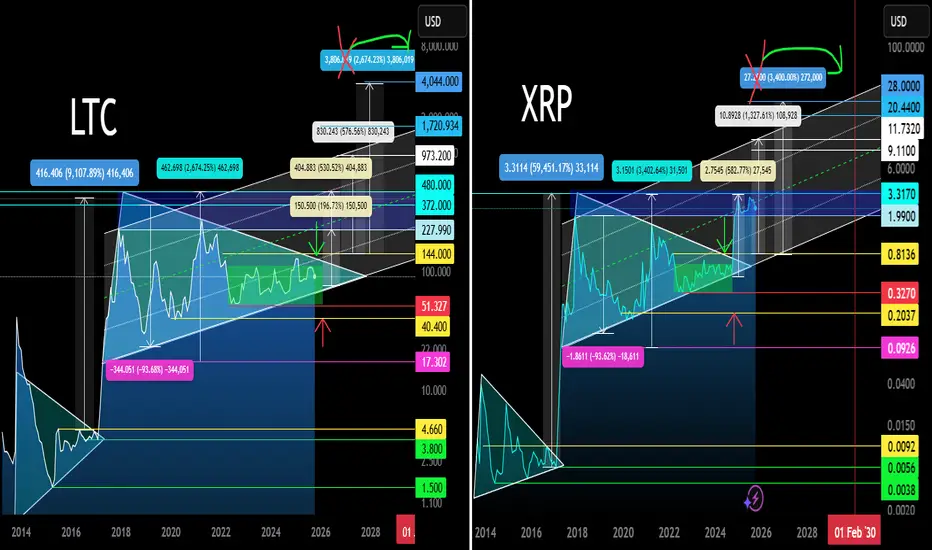
Can LITECOIN copy ZEC's enormous rally?Zcash (ZECUSD) marginally broke its May 10 2021 Cycle Top (orange trend-line) this week, rising by more than +800% in just 2 months.
Throughout its trading history, it has been tightly correlated with Litecoin (LTCUSD). It's not uncommon to see ZEC lead the way and then LTC (purple) follow. As this chart shows, whenever the two diverged, the one always caught up with the other and converged again.
Does this mean that LTC will eventually catch up to this enormous rally? If it does indeed, the Top of the previous Cycle that it 'has to' fill is at $415.
-------------------------------------------------------------------------------
** Please LIKE 👍, FOLLOW ✅, SHARE 🙌 and COMMENT ✍ if you enjoy this idea! Also share your ideas and charts in the comments section below! This is best way to keep it relevant, support us, keep the content here free and allow the idea to reach as many people as possible. **
-------------------------------------------------------------------------------
💸💸💸💸💸💸
👇 👇 👇 👇 👇 👇

Litecoin is primed for a massive price explosionI’m thinking we’ll see a big pump on Litecoin. I love this multi-year accumulation pattern. A lot of people don’t realize how held back this coin has been—when it starts pumping, it will be insane.
As always, stay profitable.
- Dalin Anderson

Litecoin: Rally Stays on TrackLitecoin (LTC) has continued its steady upward climb. Under our primary scenario, the ongoing magenta wave is expected to sustain this momentum and push price above the resistance level at $147.06. However, if price falls below support at $50.22, our alternative scenario will come into play (probability: 40%), signaling the potential for further selling pressure.

LTC’s Bullish Confluence: Fibonacci + Pattern Break = RallyAs observed, the price is currently moving within two bullish patterns on the weekly timeframe, which is a strong signal for potential upward momentum.
The key now is to monitor how the price reacts to technical levels and Fibonacci zones. If either of these bullish patterns breaks to the upside, we could anticipate a potential $70 price increase in the medium term.
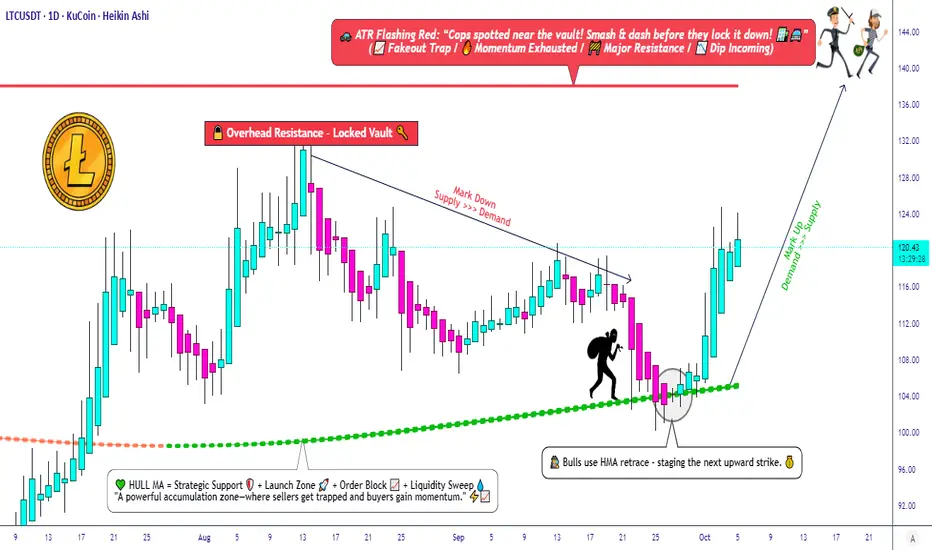
LTC/USDT — Technical Alignment Signals a Fresh Upside Phase!🎭 LTC/USDT: The Market Heist Blueprint | Swing/Day Trade Setup
💰 LITECOIN vs TETHER - Where Opportunity Meets Strategy
📊 THE SETUP
Asset: LTC/USDT (Litecoin/Tether)
Market Approach: Swing/Day Trade Strategy
Trade Style: "Thief Method" - Layered Entry System 🎯
🔍 TECHNICAL CONFIRMATION
✅ Bullish Signal Confirmed:
Hull Moving Average showing bullish retracement pattern
Heiken Ashi printing bullish doji candles (classic reversal signal)
Momentum shifting in favor of bulls
The technical confluence is aligning beautifully here, folks. When the HMA retraces and Heiken Ashi doji appears, we're looking at potential momentum shift territory.
🎯 THE THIEF'S ENTRY PLAN
Method: Layered Limit Orders (The "Thief Strategy")
This isn't your typical "one shot, one kill" approach. We're spreading our risk across multiple entry points:
Suggested Layer Entries:
Layer 1: $112
Layer 2: $114
Layer 3: $116
Layer 4: $118
Layer 5: $120
💡 Pro Tip: You can add more layers based on your risk tolerance and position size. The beauty of layering? You average your entry and reduce timing risk. Feel free to enter at any price level within this range.
🛡️ RISK MANAGEMENT
Stop Loss Zone: $108
⚠️ Important Disclaimer: This is MY stop loss level based on my analysis. You are the captain of your own ship! Set your stop loss based on YOUR risk tolerance. This is your money, your rules, your responsibility.
🎪 TARGET & EXIT STRATEGY
Primary Target: $140
Strategic Exit: $138.00
📍 Key Resistance Alert:
Around the $140 level, we've got the ATR line acting like a police barricade 🚔 - expect strong resistance here. This zone typically sees:
Overbought conditions
Potential bull traps
Heavy profit-taking
Exit Philosophy: When the cops show up (resistance hits), it's time for the thieves to exit with the loot! 💰
⚠️ Another Important Note: This target is based on technical analysis, but YOU decide when to take profits. Your account, your choices, your gains. Manage your risk accordingly!
🔗 RELATED PAIRS TO WATCH
Keep an eye on these correlated assets:
Major Crypto Pairs:
BINANCE:BTCUSDT - Bitcoin often leads altcoin movements; LTC tends to follow BTC trends
BINANCE:ETHUSDT - Ethereum correlation provides broader market sentiment
BINANCE:BCHUSDT - Similar payment-focused crypto, often moves in tandem with LTC
LTC Crosses:
BINANCE:LTCBTC - Shows LTC strength relative to Bitcoin
GEMINI:LTCETH - Alternative correlation metric
Key Correlation: When Bitcoin pumps, Litecoin typically follows with amplified moves. Watch BTC dominance for clues on altcoin season intensity.
🎓 KEY TAKEAWAYS
✨ Hull Moving Average retracement + bullish Heiken Ashi = momentum shift
✨ Layered entries reduce timing risk and improve average entry price
✨ ATR-based resistance at $140 = natural profit-taking zone
✨ Multiple stop loss and take profit levels based on individual risk profiles
✨ Correlation with BTC/ETH movements strengthens the setup
⚖️ LEGAL DISCLAIMER
🎭 This analysis uses the "Thief Style" trading strategy as an educational and entertainment concept. This is NOT financial advice. Trading cryptocurrencies carries substantial risk of loss. All entry prices, stop losses, and targets are for educational purposes only.
You are solely responsible for your trading decisions. Past performance does not guarantee future results. Always do your own research and never risk more than you can afford to lose. This is just one trader's perspective shared for fun and community engagement.
🚀 ENGAGE & SUPPORT
✨ If you find value in my analysis, a 👍 and 🚀 boost is much appreciated — it helps me share more setups with the community!
Happy Trading, Thief OG's! 🎩💎
#LTCUSDT #Litecoin #CryptoTrading #TechnicalAnalysis #SwingTrading #DayTrading #HullMovingAverage #HeikinAshi #LayeredEntry #CryptoStrategy #ThiefMethod #RiskManagement #TradingSetup #Altcoins #CryptoSignals
LTCUSD Next Target for Bulls RevealedLTCUSD 4H Chart
The correction has already ended at 100.25 . We expect a small retracement before the trend continues. Upon closer examination, this correction appears to be subwave C of wave (4). For now, watch the 119 level for a potential bullish breakout.
LTCUSD Targets: 122 , 127 , and 132 .
Wave (4) has already reached the 0.382 Fibonacci retracement level, which may act as support near the upper boundary and serve as a possible reversal point.
Stay tuned!
@Money_Dictators
Thank you :)

Litecoin Long-term Pump! Are you ready for this ?Hey Guys !
Are you ready for the LTC big pump ? It seems to me that we 're about to witness a big volatility in Altcoins very soon... As you know Bitcoin has been pumping for few months now and we haven't really seen any significant change in almost all the allcoins which might be confusing but if you look closely to the Litecoin 3 months chart you can see exactly why.
Whales has been accumulating for the last few months and as soon as the Bitcoin crashes (inevitable) all allcoins should crash even more and we should witness an all time low for most altcoins especially LTC which might reach the ALL TIME LOW line!
Bollinger Bands for the 3 months chart shows that we are getting rejected by mid band for months and its only logical that we fall to the lower band which is around 30$ and this price can be the ultimate entry price for long term investment!
Try to catch the train from the start and hodl untill the big pump news comes out wether its a Walmart announcement or whatever BS they say its gonna pump super hard !
Let me know what do you guys think about this and I'm looking forward for your comments.

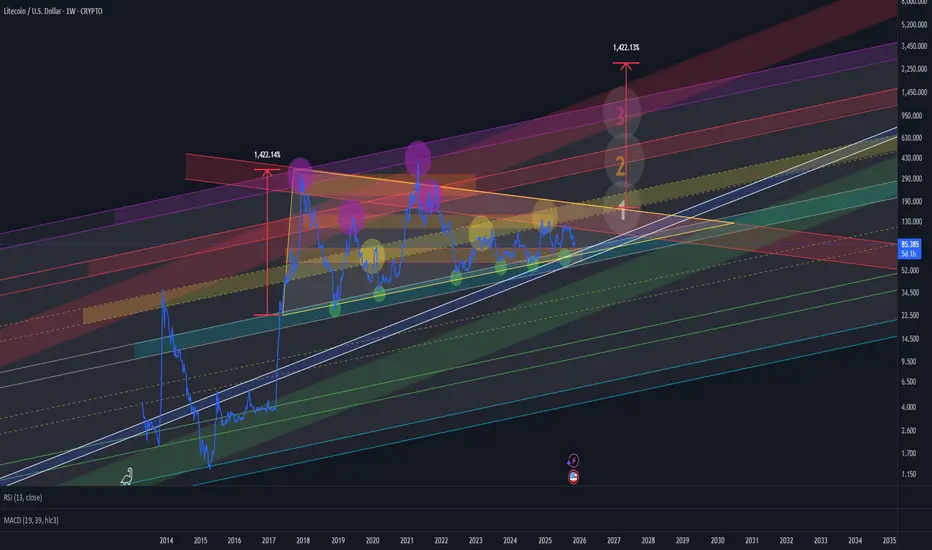
LTC and XRP Fractals. Main Trend. Triangles 10/18/2025Logarithm. 1-month time frame. Larger time frame for comparison and clarity. XRP is ahead of LTC by 1 year, where a breakout of the 7-year formation and the first wave of strong price growth (pump impulse of 500-600%) have already occurred. There will be 3 of them.
🟣⚠️ But, perhaps a retest of the formation's breakout zone, based on a super-fabulous and funny story, will happen very soon from a trend perspective. This is, more accurately, a retest of human intelligence worldwide, the clarity of common sense (perhaps there will be no reaction, and the scenario will fail to capture the public's attention), which could impact speculative markets as a whole.
In general, cryptocurrencies like Litecoin (scam protection) should be of interest to those with common sense but who understand that trading isn't their thing. You buy in increments and forget about it. That is, for investors... Perhaps it would be of interest to positional traders (trades once a year or several months) after a breakout on a pullback, or trigger trades on breakouts of local zones.
An idea for comparison that could impact your trading strategy. Don't be confused by the large percentage pumps in 2017 to initiate the formation of the triangles of these 7–8 years. Cryptocurrency in the "reset waves" has long been redistributed. However, this doesn't negate risk management, not like some silly “book” that says to squeeze your coins out of you in reversal zones, but rather as common sense and math dictate. Also, set reasonable targets, depending on the timeframe of your trading strategy, for liquidity accumulation levels and those willing to sell. Don't set limit orders in round numbers, either sell or buy.
🟡 On Litecoin cryptocurrency, the price is still trapped , ahead of a potential breakout (highly likely). It's possible they'll make a false takeout and accumulate long liquidity under the 7.8-year formation before breaking out of the triangle, but that's not a given.
LTC ETF to be adopted in the US later . But overall, everything will be fine. Currently, with the price clamping down (over the last six months), we've seen high network activity and an increase in the number of addresses (the banking sector is “testing” + a little large capital) without price growth or positive news. Of the top cryptocurrencies, LTC is currently an underdog, which is logical, as positions are being built up in a local trend after a major redistribution (change of hands). This is a good sign.
🟡 Work in the secondary trend I'll publish later, possibly a public idea. However, here I've shown the maximum targets for both an upward breakout (more likely) and a downward breakout (rare, perhaps, perhaps liquidity accumulation).
A chart pattern (trends, figures, fractals, patterns) is formed according to the general market trend (market phase) and the asset's liquidity (money in the project). What is a projection (paragraph below).
The price movement direction is determined by:
1️⃣ real supply/demand for the "commodity."
2️⃣ manipulative supply/demand.
3️⃣ intellectual degradation of market participants and their control and predictability.
4️⃣ intellectual “insight” into how things “should” or “shouldn't” be. This is usually the result of points 2 and 3 (the formation of a dominant opinion), and very rarely a personal opinion that can be used to develop one's own trading tactics and money management.
LTCUSD H4 | Could We See a Bullish Reversal?Litecoin has bounced off the buy entry which is a pullback support and could rise from this level to the upside.
Buy entry is at 97.36, which i a pullback support.
Stop loss is at 90.92, which is an overlap support that aligns with the 127.2% Fibonacci extension.
Take profit is at 111.13, which is a pullback resistance that lines up with the 38.2% Fibonacci retracement.
High Risk Investment Warning
Trading Forex/CFDs on margin carries a high level of risk and may not be suitable for all investors. Leverage can work against you.
Stratos Markets Limited (tradu.com ):
CFDs are complex instruments and come with a high risk of losing money rapidly due to leverage. 65% of retail investor accounts lose money when trading CFDs with this provider. You should consider whether you understand how CFDs work and whether you can afford to take the high risk of losing your money.
Stratos Europe Ltd (tradu.com ):
CFDs are complex instruments and come with a high risk of losing money rapidly due to leverage. 66% of retail investor accounts lose money when trading CFDs with this provider. You should consider whether you understand how CFDs work and whether you can afford to take the high risk of losing your money.
Stratos Global LLC (tradu.com ):
Losses can exceed deposits.
Please be advised that the information presented on TradingView is provided to Tradu (‘Company’, ‘we’) by a third-party provider (‘TFA Global Pte Ltd’). Please be reminded that you are solely responsible for the trading decisions on your account. There is a very high degree of risk involved in trading. Any information and/or content is intended entirely for research, educational and informational purposes only and does not constitute investment or consultation advice or investment strategy. The information is not tailored to the investment needs of any specific person and therefore does not involve a consideration of any of the investment objectives, financial situation or needs of any viewer that may receive it. Kindly also note that past performance is not a reliable indicator of future results. Actual results may differ materially from those anticipated in forward-looking or past performance statements. We assume no liability as to the accuracy or completeness of any of the information and/or content provided herein and the Company cannot be held responsible for any omission, mistake nor for any loss or damage including without limitation to any loss of profit which may arise from reliance on any information supplied by TFA Global Pte Ltd.
The speaker(s) is neither an employee, agent nor representative of Tradu and is therefore acting independently. The opinions given are their own, constitute general market commentary, and do not constitute the opinion or advice of Tradu or any form of personal or investment advice. Tradu neither endorses nor guarantees offerings of third-party speakers, nor is Tradu responsible for the content, veracity or opinions of third-party speakers, presenters or participants.

Litecoin - LTC HUGE Upside Likely MID TERM (6 months)Litecoin has always been one of the giants of crypto, although it's growing slower than before.
This is likely due to all the innovation in the market, newer alts with better offerings etc.
However - LTC can, and will still be traded or many years to come. This is just because whales will trade almost ANY coin. (and if they can trade XRP to a new all time high, they can and will trade LTC ).
Every few odd months, LTC trades up+50% and above. This is every 5-7 months, or at least annually. And after the bullish W Bottom in the WEEKLY - I have high hopes for LTC.
________________
BINANCE:LTCUSDT

LTCUSD IdeaW pattern forming with the right arm current.
This should be a very bullish period for Litecoin.
Price likes to sit above the Gaussian Channel so an extension further above it is likely
Weekly chart

LTCUSD Is Breaking Out3Month Chart on this one
The RSI clearly shows a pivot upwards at this middle line
Price is also within a large triangle which could be considered a bullflag in my mind
I think price will break out of this triangle spectacularly.
Green circles are very similar price formations.
Very Good Long Choice as an altcoin.


Litecoin Ready to Explode After 3 Years of SleepIn recent years, with the flood of new crypto projects, Litecoin has quietly faded into the background.
Since the local low in May 2022, the price action has been rather lethargic, contained within a well-defined range between 60 and 130 USD.
However, since April 2025, something interesting has been happening — Litecoin seems to be waking up, quietly and almost secretly, as if not to attract too much attention.
From that point onward, LTC/USD has been steadily printing higher lows, and if we zoom out to the longer-term chart, the structure looks remarkably clean — almost textbook — for a potential breakout setup.
Even recently, after another touch of the resistance zone, the correction that followed took the form of a bullish flag, and last week’s strong engulfing candle practically erased an entire month of pullback, now pressing once again against the key resistance level.
In my opinion, it’s time for this cryptocurrency to wake up.
A clear break above 130 would be a strong technical confirmation of that view.
While Litecoin might not deliver the “10x hype” potential that newer tokens promise, it has consistently proven to be one of the most stable and resilient assets in the crypto space.
After three years of accumulation, a breakout could easily trigger an explosive move to the upside.
📈 I’m personally buying Litecoin, with a target around 300 USD in the medium term.
Sometimes, the coins everyone forgets about are the ones that surprise the most. 🚀
#LTC/USDT analysis.Give me some energy !!!#LTC
The price is moving within a descending channel on the 1-hour frame, adhering well to it, and is heading for a strong breakout and retest.
We have a bearish trend on the RSI indicator that is about to be broken and retested, supporting the upside.
There is a major support area (marked in green) at 107.50, which represents a strong basis for the upside.
For inquiries, please leave a comment.
We are in a consolidation trend above the 100 moving average.
Entry price: 111.15
First target: 112.80
Second target: 114.70
Third target: 117
Don't forget a simple matter: capital management.
When you reach the first target, save some money and then change your stop-loss order to an entry order.
For inquiries, please leave a comment.
Thank you.

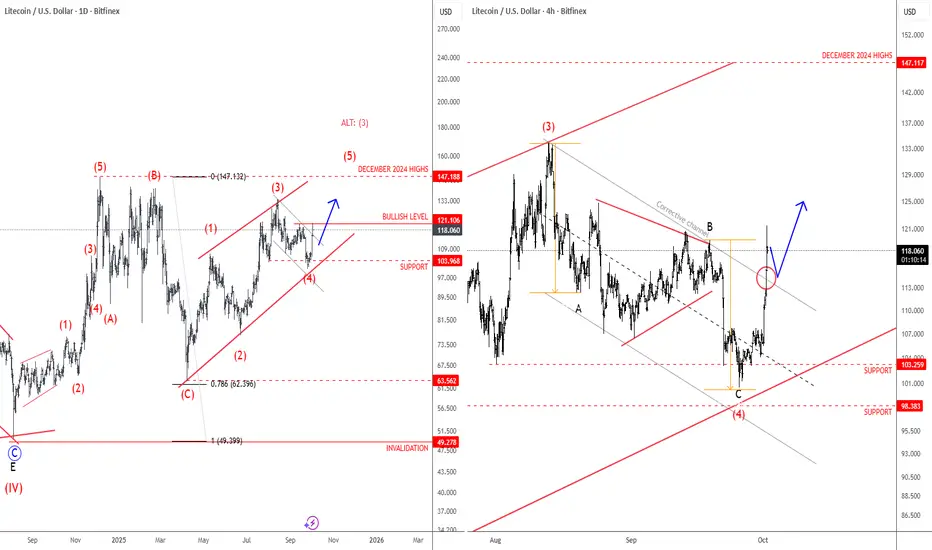
Litecoin Is Still Eyeing December 2024 HighsLitecoin turned lower recently, but we believe this is just another corrective retracement within a broader bullish trend, which has been showing higher swing lows since the rebound from the 78.6% Fibonacci level back in April. We expect that retracement down from the December highs will be fully retraced, meaning there’s room for a push up toward 147 as illustrated on a daily chart. It can be looking for wave (5) of a diagonal pattern, or alternatively, maybe even wave (3) if it extends decisively above upper diagonal line and goes for 200 area. In the 4-hour chart, we got a sharp rebound from projected support and back above channel resistance line after we noticed an ABC correction, so bulls are back, and we may easily see more gains toward December 2024 highs, just watch out for short-term pullbacks.
LTCUSD H4 | Bearish drop offLitecoin (LTC/USD) is reacting off the sell entry which is an overlap resistance that aligns with the 38.2% Fibonacci retracement and could reverse from this levle to he take profit.
Entry is at 107.36, which is an overlap resistance that aligns with the 38.2% Fibonacci retracement.
Stop loss is at 111.31, which is a pullback resistance that is slightly below the 61.8% Fibonacci retracement.
Take profit is at 101.34, which is a multi swing low support.
High Risk Investment Warning
Trading Forex/CFDs on margin carries a high level of risk and may not be suitable for all investors. Leverage can work against you.
Stratos Markets Limited (tradu.com ):
CFDs are complex instruments and come with a high risk of losing money rapidly due to leverage. 65% of retail investor accounts lose money when trading CFDs with this provider. You should consider whether you understand how CFDs work and whether you can afford to take the high risk of losing your money.
Stratos Europe Ltd (tradu.com ):
CFDs are complex instruments and come with a high risk of losing money rapidly due to leverage. 66% of retail investor accounts lose money when trading CFDs with this provider. You should consider whether you understand how CFDs work and whether you can afford to take the high risk of losing your money.
Stratos Global LLC (tradu.com ):
Losses can exceed deposits.
Please be advised that the information presented on TradingView is provided to Tradu (‘Company’, ‘we’) by a third-party provider (‘TFA Global Pte Ltd’). Please be reminded that you are solely responsible for the trading decisions on your account. There is a very high degree of risk involved in trading. Any information and/or content is intended entirely for research, educational and informational purposes only and does not constitute investment or consultation advice or investment strategy. The information is not tailored to the investment needs of any specific person and therefore does not involve a consideration of any of the investment objectives, financial situation or needs of any viewer that may receive it. Kindly also note that past performance is not a reliable indicator of future results. Actual results may differ materially from those anticipated in forward-looking or past performance statements. We assume no liability as to the accuracy or completeness of any of the information and/or content provided herein and the Company cannot be held responsible for any omission, mistake nor for any loss or damage including without limitation to any loss of profit which may arise from reliance on any information supplied by TFA Global Pte Ltd.
The speaker(s) is neither an employee, agent nor representative of Tradu and is therefore acting independently. The opinions given are their own, constitute general market commentary, and do not constitute the opinion or advice of Tradu or any form of personal or investment advice. Tradu neither endorses nor guarantees offerings of third-party speakers, nor is Tradu responsible for the content, veracity or opinions of third-party speakers, presenters or participants.

LTC 4H Analysis - Key Triggers Ahead☃️ Welcome to the cryptos winter , I hope you’ve started your day well.
⏰ We’re analyzing LTC on the 4-Hour timeframe .
👀 After the sharp and deep drop that Litecoin experienced in 3 candles, it moved toward its key support in the $102 area and was well supported from this zone. Then it formed a higher low and higher high compared to its previous low and high, and it is now moving to break its resistance in the $107 area. With a 4-hour confirmation on this zone (the taker-seller and key resistance), it can move upward.
🧮 Two key zones are considered for the RSI oscillator: the 63 level, which is close to the 70 zone—if the volatility crosses this level, Litecoin can move toward overbought. The second zone is the entry threshold into oversold.
🕯 The size and volume of the candles in the recent drop, which can be considered a price correction, are really significant and large. Scattered sell orders are placed above the area we marked, which causes our green candles below this zone to appear a bit smaller. To break the specified taker-seller area, we need a large candle with relatively high volume that fully confirms (stabilizes) on this zone to shape our bullish and high-momentum trend.
💸 BINANCE:LTCBTC is bearish against the Bitcoin pair and has not turned bullish yet, but it is positioned a bit above its support floor. With a breakout of the taker-seller zone in the USDT pair, the Litecoin/Bitcoin pair might also turn bullish, which would increase the movement momentum and the size of the candles.
🧠 For a Litecoin long position, we have to wait until we confirm above this taker-seller area with a strong whale candle and then examine the available scenarios for the breakout.
↗️ Long position scenario: breaking the taker-seller area and key resistance at $107 along with whale candles, and then observing a multi–time frame indecision candle, which will also give us a smaller stop size.
📉 Short position scenario: if the market wants to give a heavy and strong correction, the $102 area can be a good zone for a floor break and a short position on this coin—but the important point for us is that Litecoin is about to start a good bullish trend.
❤️ Disclaimer : This analysis is purely based on my personal opinion and I only trade if the stated triggers are activated .
