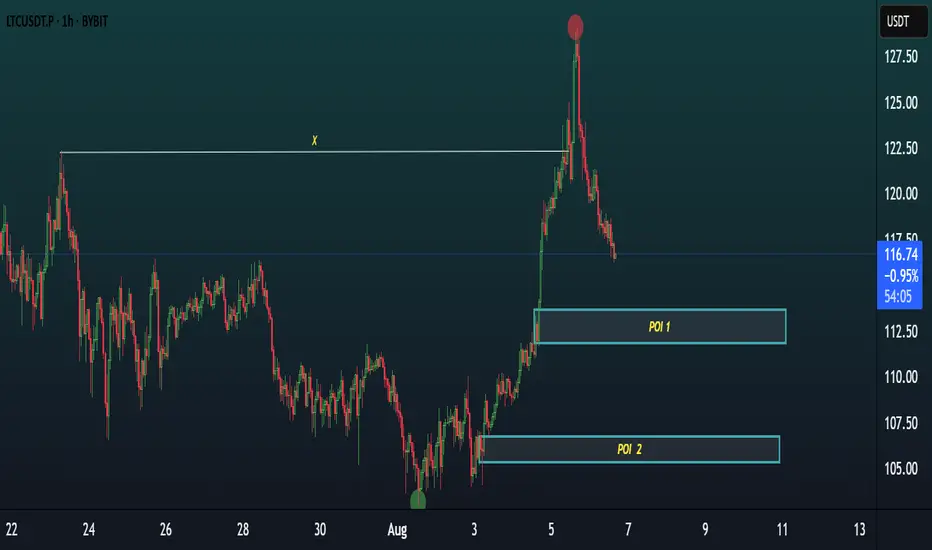
LTC/USDT 1H CHART BREAKDOWN.LTC/USDT 1H Chart Breakdown 🔍
Price swept major liquidity at the top and is now retracing.
We have 2 key POIs (Points of Interest) below:
📍 POI 1: Aggressive entry zone
📍 POI 2: More discounted price for safer long entries
⚡ Watch for bullish confirmation inside these zones for potential reversal to the upside. Smart money may accumulate here.
Scalp & intraday traders — stay sharp!
LTCUSDT
Litecoin Eyes $133 After Breaking $122 – 13% Upside AheadHello✌️
Let’s analyze Litecoin ’s price action both technically and fundamentally 📈.
🔍Fundamental analysis:
Litecoin’s ETF approval looks likely (90% odds!), and if it happens, we could see $400–500M inflows – just like Bitcoin’s ETF boost.
But yeah, SEC delays still shake the price… LTC dropped 2% after the latest holdup. 📉⏳
📊Technical analysis:
BINANCE:LTCUSDT has broken above the key $122 level; holding this as support may lead to a move toward $130–133, offering a potential 13% upside. Traders should watch price action for confirmation near these zones. 📈🪙
✨We put love into every post!
Your support inspires us 💛 Drop a comment we’d love to hear from you! Thanks, Mad Whale

Litecoin Hits a New High · Update · Highest Price in 5 MonthsToday Litecoin hit its highest price in more than five months, since March 2025. Soon Litecoin will break its December 2024 high and produce the highest prices since the last bull market, 2021. We are getting very close now.
A few weeks back the market was in a similar situation, doubt started to creep in and people wondered if the market was set to endure a long-term correction or resume higher. We used Bitcoin Cash which was moving ahead to prove the rest of the market would do the same and it happened as predicted. Before Bitcoin Cash, further back, we used XRP and it worked.
Today we are looking at Litecoin and the action this chart is showing matches additional growth. While some pairs are retracing or consolidating, others continue to move ahead. This only happens in a bull market, and, when Bitcoin retraces while the altcoins continue to grow, this is a sure sign that the bulls are buying and the market expects additional growth.
Additional growth but remember retraces will always be present along the way. The market grows steadily but it takes time. Five steps: three steps forward, two step back. Allow time for variations. Retraces and corrections are an opportunity to rebuy and reload.
Secure profits when prices are up; buy back at support.
Sell when prices are high; sell when the market is green.
Sell when everything feels fine and great.
Buy when prices are low; buy when the market is red.
Buy when everything feels down and depressed.
Go against the market impulse. Make your decisions based on information. The market is growing and set to continue growing long-term. Choose wisely and let the market take care of the rest.
Namaste.
LTC/USDT Trade Plan: Litecoin & Nasdaq CorrelationKeeping a close eye on Litecoin (LTC/USDT) ⚡ — after a bullish breakout from a healthy pullback 📈, I’m eyeing the potential for continued upside momentum 🚀. This perspective remains heavily correlated to the performance of the NASDAQ; if equities continue their bullish trajectory 🟢, I’ll be looking to position myself in line with Litecoin strength.
In the video, we also dive into the Fibonacci extension tool to identify potential targets 🎯 and combine this with historical support and resistance levels 📍. Another key component of my analysis is the anchored volume profile, which I’ve demonstrated throughout the walkthrough 📉.
This is all part of my execution plan 📊 — full details are provided in the video and should not be considered financial advice ⚠️.

Litecoin (LTC) – Re-Entry After 44% RallyLTC rallied over 44% since our last trade setup. Now, we’re looking for a re-entry opportunity as the broader crypto market shows signs of a potential pullback.
🔍 Setup Overview:
Entry Zone: $108 – $103
Take Profits: $125 / $140 / $150
Stop Loss: Daily close below $100
Bias: Bullish continuation (as long as structure holds)
🧠 Trade Idea:
Expecting a possible sweep of the $104 low before upside resumes. Key condition: Daily candle must not close below $100—wicks are fine. If price respects this level, the bullish structure remains intact.
This is a classic liquidity grab scenario. Entering in the $108–103 zone allows favorable risk-to-reward if LTC catches support and reclaims momentum.
⚠️ Invalidation:
If LTC posts a daily close below $100, trade setup becomes invalid. Monitor price action closely around this key support zone.
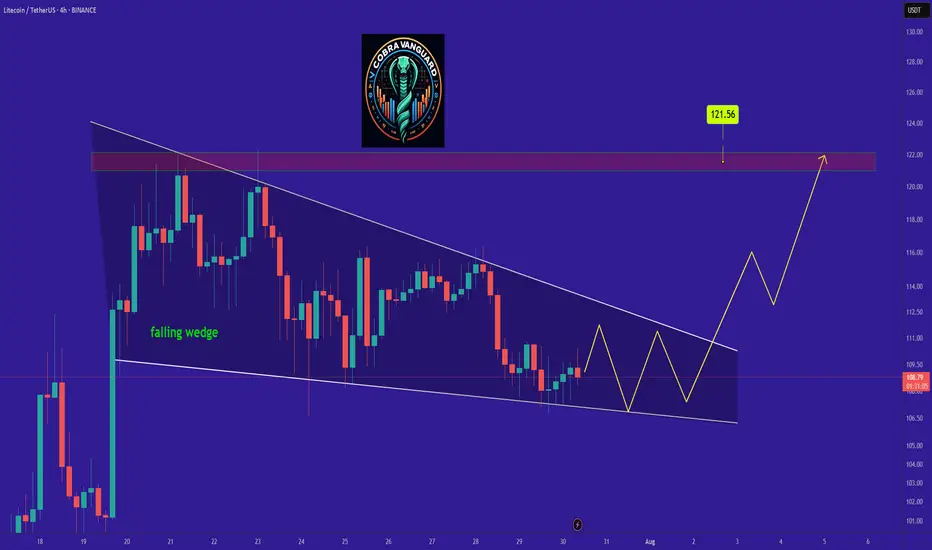
LTC is bullish now and many Traders don't see itSo if you pay attention to the LTC chart you can see that the price has formed a Ascending wedge which means it is expected to price move as equal as the measured price movement.( AB=CD )
NOTE: wait for break of the WEDGE .
Best regards CobraVanguard.💚
LTCUSDT 4H CHART ANALYSIS.Structure: Market is in a bullish trend, forming higher highs and retracing after a strong impulse move.
Liquidity Sweep (SSL): Recent candles show a sweep of sell-side liquidity, targeting the lows near $108, clearing out weak longs.
FVG (Fair Value Gap): Price is approaching a 4H imbalance zone ($104–$108), indicating an inefficiency that may attract buy orders.
POI & OB Zone: A Point of Interest (POI) and a Bullish Order Block (OB) rest just below FVG (around $102–$104), acting as a strong confluence for reversal.
Expectations: If price fills the FVG and reacts from POI/OB with a bullish engulfing or confirmation, we can expect a bounce targeting the previous high around $125+.
Ideal Setup: Look for entry around $102–$106, with SL below OB and TP 1.5–2x above previous high.
This setup aligns with Smart Money Concepts (SMC) – liquidity sweep, FVG fill, and OB reaction. ✅

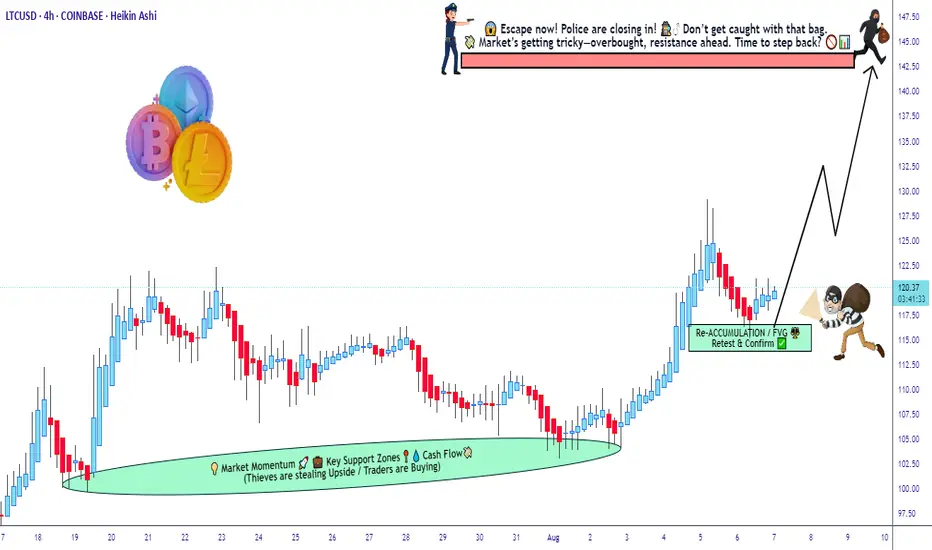
"Is LTC/USD the next target of a stealth bull raid?”🎯 LTC/USD HEIST ALERT: BULLISH LAYER HEIST PLAN! 💎🚁
PLUNDER PLAN: BULLISH
Thief entering the LTC/USD market with calculated stealth—multi-layered buy-limit entries, master-level layering strategy 🌪️💰
👾 ENTRY STRATEGY:
Stack multiple limit orders at staggered price levels (layering like a patient 🐍 thief)
Enter at any price, staying ready to pounce at key zones, using alerts for breakouts
🛑 STOP LOSS:
Fixed SL at 110.00 USD
Keep tight risk control—stop’s your escape hatch!
🏹 TARGET:
Primary profit target: 143.00 USD
Use trailing stop-loss to lock gains early if momentum fades
🧠 THIEF TRADER TACTICS:
Limit orders only—no chasing
Enter the trend, don’t fight it—avoid shorts during bullish bias
For scalpers: swift layered fills
For swing traders: build position patiently
💎 RISK MANAGEMENT:
Every limit order has a stop-loss
Total risk should be controlled—ideal risk‑reward if full strategy plays out
🔍 MARKET CONTEXT:
Bullish outlook supported by confluence of:
macro themes, sentiment swings, on‑chain flows, and intermarket setups
Layered entries optimize risk while capturing upside
⚠️ Avoid trading during high‑volatility news events
Trailing stops = lock profit & evade chaos
📣 CALL TO ACTION:
💥 If you feel the energy, smash that Like and Follow, comment your plan, and join the crew. Let’s rob the market level by level 🔓🎯
Stay sharp, stay sneaky — see you at the target 🔐
— Thief Trader 🐱👤💵🚀
Litecoin LTC price analysisToday we will analyze the third candidate for ETF in the near future is CRYPTOCAP:LTC
An old coin, good fundamentals, 1:1 tokenomics like CRYPTOCAP:BTC but 4 times more coins, untapped potential, and the list goes on...
♎️ The main difference from the previous two candidates is the current market cap of the coins: CRYPTOCAP:XRP - $118 billion, CRYPTOCAP:SOL - $72 billion, #Litecoin only $6 billion
Accordingly, the prospects for growth in the price of OKX:LTCUSDT are many times greater
🔥 Currently, #LTCUSD price is near the potential purchase zone of $71.25-76.25
📈 Growth potential of at least $170-180
🐻Critical level of $67
_____________________
Did you like our analysis? Leave a comment, like, and follow to get more

Litecoin is about to begin a leg upLitecoin is about to begin its first expansion. Alt season seems to be well underway and mid caps like LTC are next on the docket for money flow.
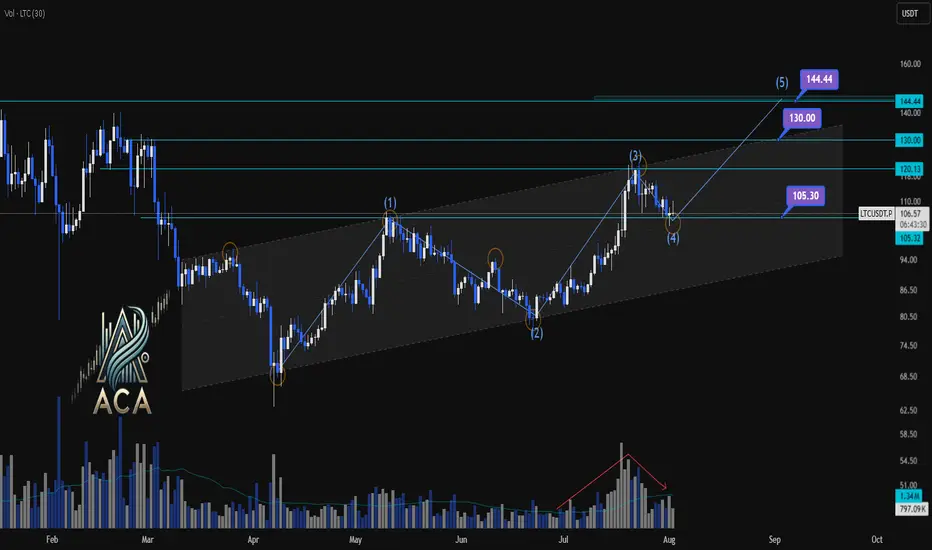
LTCUSDT | Daily Chart Analysis | Bullish Structure UnfoldingLTCUSDT | Daily Chart Analysis | Bullish Structure Unfolding
🔍 Let’s break down LTC/USDT’s technical setup, focusing on volume, Elliot Wave structure, and key target levels for this bullish scenario. If you're following this channel, be sure to react and let us know your thoughts on the roadmap!
⏳ Daily Overview
LTCUSDT is moving within a defined ascending channel, supported by increasing bullish momentum and clear Elliot Wave progression. The recent wave count points to a textbook impulse, setting up the next key move.
🔺 Long Setup:
The market has completed Waves (1) through (4), and we’re now looking at the development of Wave (5) to the upside.
- Wave (5) Target Zones:
- $130.00
- $144.44
These are the next resistance levels based on previous highs and channel dynamics.
- Key support to watch:
- $105.30 — this zone may act as a springboard for the next rally if tested.
📊 Key Highlights:
- Volume has shown a clear bullish divergence as price advances, signaling growing interest and strength heading into Wave (5).
- The bullish channel remains intact, and each dip has been met with higher lows, confirming the ongoing uptrend.
- Elliot Wave structure suggests further upside, with the $130.00 and $144.44 levels as potential targets.
🚨 Conclusion:
LTC bulls should keep an eye on price action as it approaches support at $105.30 — a bounce here could ignite the next leg higher toward our target zones. Reaction from the channel community will be crucial as Wave (5) unfolds. Show your support with a reaction below if you’re riding this wave!
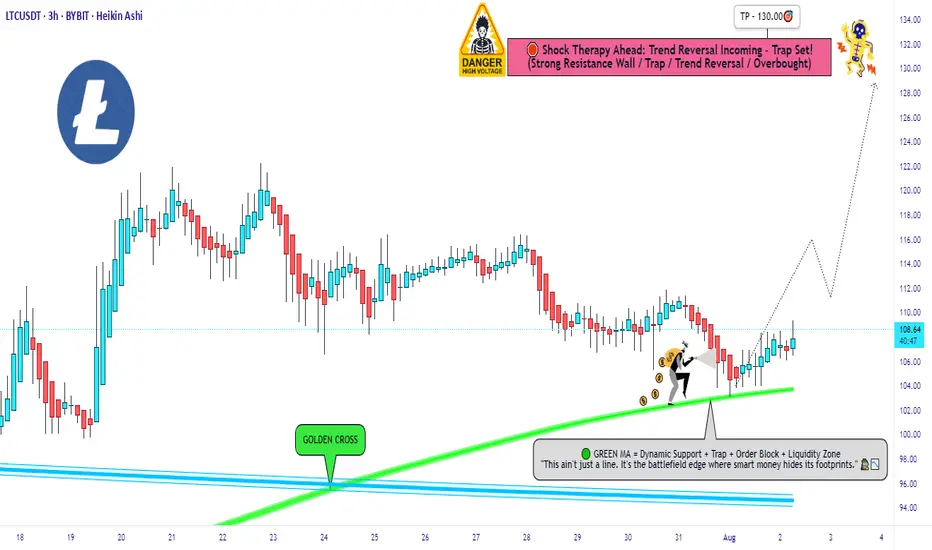
LTC/USDT Robbery Underway | Bullish Setup, Get In Now!🔥💎 LTC/USDT HEIST PLAN: ROB AT ANY PRICE! 💎🔥
🚨 Bullish Move Incoming | Layered Entries | Thief Trader Exclusive 🚨
🌟Hi! Hola! Ola! Bonjour! Hallo! Marhaba!🌟
Dear Money Makers & Market Robbers, 🤑💰💸✈️
The time has come for another high-stakes Thief Trading heist, and this time we're lockin' in on LTC/USDT – aka "Litecoin vs Tether" 💣💸
🎯 Thief’s Mission Plan: BULLISH AT ANY PRICE LEVEL!
We're going full stealth mode with a layering strategy — stacking multiple limit orders like a true pro thief preparing for a clean escape! 🔪📉📈
🚪 ENTRY: "Anywhere, Anytime" 🚪
📈 Buy from any price level — but for optimal entry:
🟢 Use Buy Limit orders near recent lows (15-30 min TF)
🔔 Don’t forget to set alerts for breakout confirmation!
🛑 STOP LOSS: Strategic Defense 🛑
🗣️ "Listen up, team! Stop loss ain’t a maybe — it’s your armor. Place it smart, or prepare for pain." 🔥
📍Recommended SL: 100.00
🔐 Adjust based on your lot size & how deep you stack your orders.
🏁 TARGET: 130.00 🏁
💸 But always Escape Early if the plan gets too hot!
Use a Trailing SL to lock in gains and slip out clean 😎🧨
🧠 PRO TIPS from the THIEF:
🔎 Only Buy. No Shorting!
💣 Scalpers: Jump in with the trend, not against it.
🧲 Swing Traders: Stay patient, and execute the full heist.
🚀 Use Trailing Stops – Let profit ride, but stay protected!
📢 MARKET INSIGHT:
🔥 Bullish Bias backed by:
✅ On-Chain Metrics
✅ Sentiment Shifts
✅ Macro Flows
✅ COT Reports
✅ Intermarket Divergence
⚠️ TRADING ALERT: Stay Sharp!
📰 News Events = Volatility.
💡 Avoid fresh entries during high-impact events.
📉 Use Trailing SL to secure your running trades.
💖 SUPPORT THE CREW 💖
🚀 Smash that Boost Button if you believe in the Thief Style Strategy
👑 Let's rob the market together, one level at a time.
🧠 Stay sharp, stay sneaky – and I’ll see you at the next target 🎯
— Thief Trader 🐱👤💰🚁🌍
LitecoinLtc usdt daily analysis
Time frame hourly
Risk rewards ratio >2.7👈👌
Short position
Target 100.5 $

LTC long turm Accroding to VSFA+ A.o.A All
Accroding to VSFA+ Strategy, LTCusdt long trum dump expected

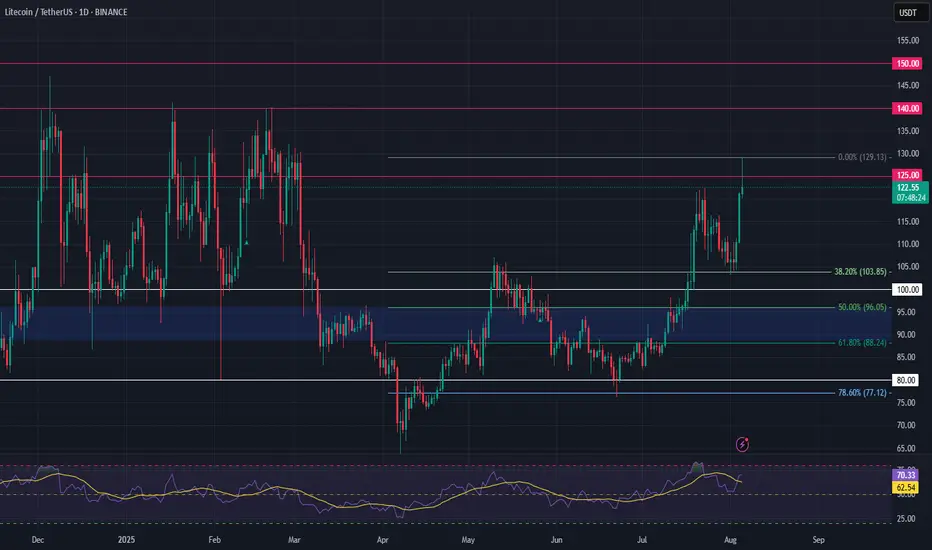
Litecoin Approaches $100 Support, Eyeing 17% Rally to $128Hello✌
Let’s analyze Litecoin’s upcoming price potential 📈.
BINANCE:LTCUSDT is approaching a solid daily support around the key psychological level of $100, which coincides with the 0.5 Fibonacci retracement. Holding this level could open the door for a 17 % upside, targeting $128 near a major daily resistance. Keep an eye on this setup for a potential bounce! 📉🔄
✨We put love into every post!
Your support inspires us 💛 Drop a comment we’d love to hear from you! Thanks , Mad Whale

LTC (the most dangerous chart in crypto)LTC / USDT
8 years of accumulation in this triangle and price is being squeezed around apex.. What is the result of this long accumulation?
It reminds me of XRP chart before the big breakout in last November
Keep an eye of it…

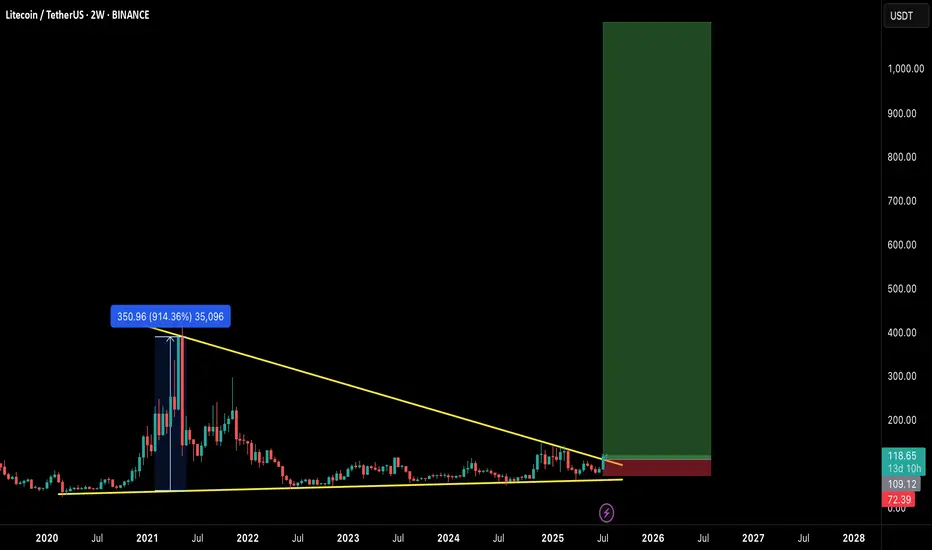
$LTC READY FOR EXPLOSION! THE COMEBACK OF THE OG?Litecoin has quietly formed one of the most massive macro structures in the market — a multi-year falling wedge on the 2-week timeframe, now breaking out with early confirmation.
This could be the start of a generational move, similar to the 2020 breakout. Let's break it down:
🧠 Technical Breakdown:
✅ Falling wedge forming since 2021 — 4 years of compression
✅ Volume and structure support breakout
✅ LTC already gave a 914% rally last time it broke a similar level
📏 Target zone extends above $900–$1000
🛒 Entry Zone:
Current Price: $118
🟢 Buy on breakout or dips near $105–$110 for safer entries
🎯 Target Zones:
TP1: $280
TP2: $400
TP3: $650
TP4: $950+
🛑 Stop-loss:
Breakdown below $72 (last higher low & wedge base)
⚖️ Risk-to-Reward:
High timeframe structure = High conviction play.
Potential R:R > 8x — Rare macro opportunities like this don’t come often.
🧩 Final Thoughts:
LTC may not be the flashiest alt anymore, but this setup is technically undeniable. If BTC enters full bull cycle, LTC could ride the wave explosively.
🔥 This could be a "buy and forget" macro play for 6–12 months.
💬 Let me know your thoughts in the comments & hit that ❤️ if you like macro setups like these!
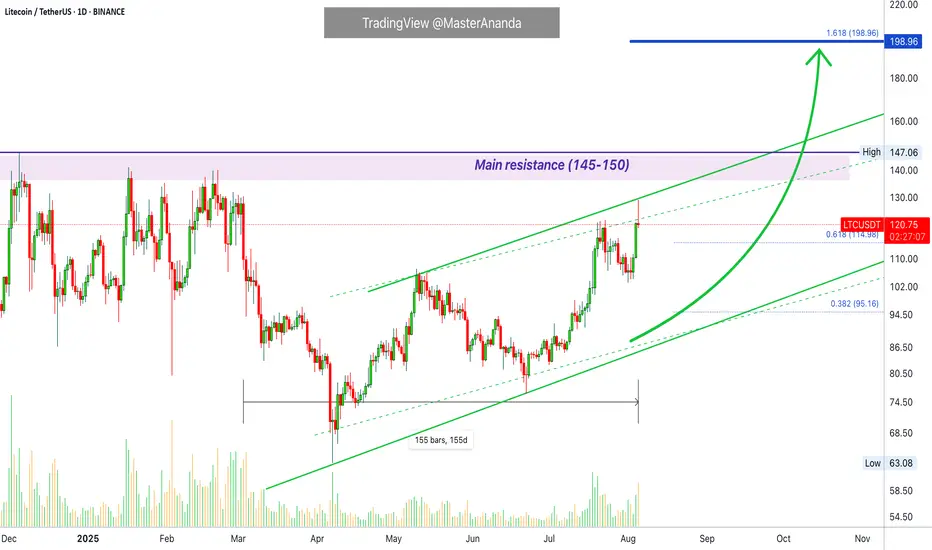
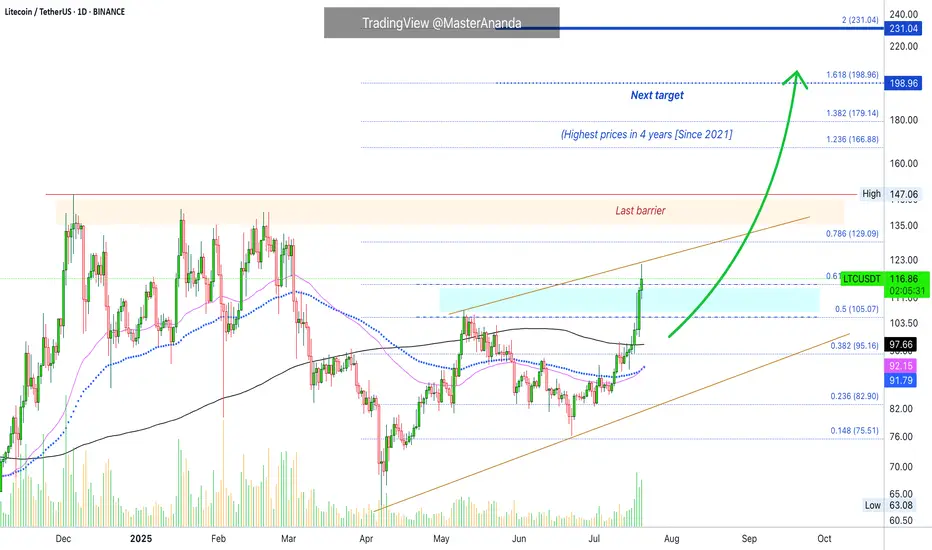
Litecoin's Path Beyond $200 Revealed · Daily TimeframeWe looked at Litecoin on the weekly timeframe which is the long-term picture, but we also need to consider the daily to see what is happening up-close.
As soon as we open this chart we have three signals that stand out:
1) Litecoin is now trading above MA200 safely and rising. This is a very strong bullish development and supports additional growth.
2) Trading volume has been rising significantly being now the highest since February 2025. The difference is that in February we were in distribution, resistance being confirmed with prices set to move lower. In this case, the action is rising from support and volume is rising rather than dropping.
3) May's peak has been broken. Many pairs are still trading below their high in May. Those that broke this level are the ones moving first and this signal exudes strength. Litecoin is now one of the top performers specially in the group with a big market capitalization.
The next barrier is the December 2024 high at $147. Short-term the next target is $129. As soon as the former breaks, we are going to be looking at the highest price since 2021.
Litecoin is fighting resistance today, 0.618 Fib. extension at $115. It is trading above this level but the confirmation only happens at the daily close. If it closes above, bullish confirmed. It if closes below, it means that there will need to be some struggling before higher prices. This struggling can last a few days just as it can extend. Seeing Ethereum and how it is moving straight up, Litecoin is likely to do the same.
Overall, conditions are good for Litecoin on the daily timeframe.
Thank you for reading.
Namaste.
LITCOIN BUY OR SELL !!!Hello friends🙌
🔊According to the price drop, you can see that the price has been below the specified resistance for a while and when it was able to break the resistance, it shows us the power of the buyers. Now, when we return to the previous resistance, which has now become a support, you can see that the buyers are providing good support and the price is expected to move to the specified targets.
Note that the most important rule in trading is capital and risk management So make sure to follow it.
🔥Follow us for more signals🔥
*Trade safely with us*

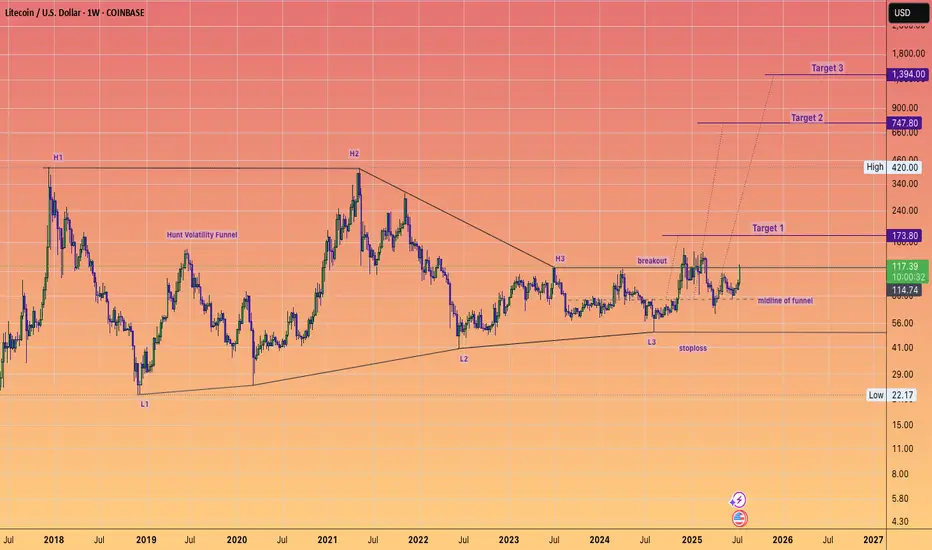
Litecoin has maintained it's HVF and can STILL do a 10X...in the coming years.
This is a massive pattern formed over 7 years and I expect over performance of target 3 ultimately.
The day to week price action really does not matter when you have beautiful setups like this.
Keep stacking at these low prices.
@TheCryptoSniper
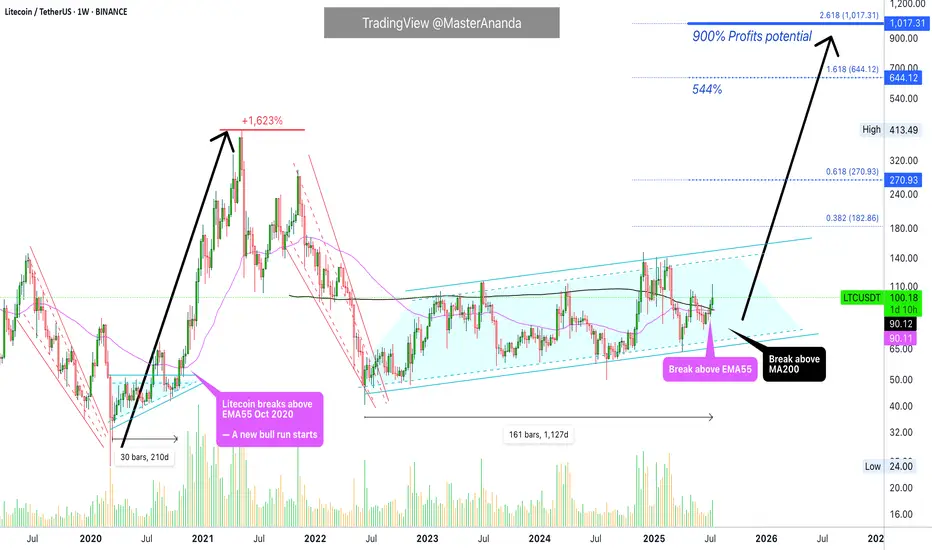
Litecoin $1,000 (900%) ExplainedBack in 2020, just 210 days of consolidation led to a 1,623% strong bull market. How much different market conditions we have now. Since 2022, Litecoin has been consolidating. The length of this consolidation is now 1,127 days. More than five times the previous consolidation and then some.
How much higher can Litecoin go compared to a past period?
How much more growth can a project produce when it has been building strength for so long?
LTCUSDT is now trading weekly above EMA55. When this happened back in 2020, what followed was sustained growth. Straight up, literally, for a period of 203 days. No stops.
Back in 2020, Litecoin moved above EMA55 first in August just to be rejected. The second time was the good one. This year the situation is the exact same. Litecoin broke above EMA55 in May and was rejected. The second time is happening now in July and this is the good one.
Litecoin is also trading above MA200 fully confirmed and there is a golden cross between EMA55 and MA200. We are very close to a major marketwide bull-run.
$644 in this bullish cycle is a high probability target for Litecoin, but prices can go higher, much higher because market conditions continue to improve and institutions will gain access to Litecoin through Exchange-Trade Funds (ETFs). This means that a standard price projection would be a disservice to us. We are aiming for $1,000+ on this bullish cycle but it can end up closing higher of course.
After the new all-time high is hit, it is normal to see a correction or even a bear market. This one should be short and small compared to previous ones. See you at 1K.
Namaste.
#LTCUSDT: On The Way To $200, Get Ready For Swing Buy! Hey there!
Evening Everyone,
The price of this crypto is currently in a bullish formation, and it looks like it’s on the rise, potentially reaching $200. The best thing you can do is wait for the price to break out of the downtrend and then keep going up. You could set a target at $150 and then $200, which would be a swing move.
Good luck and trade safely! 😊
Thanks a bunch for your unwavering support! ❤️🚀
If you’d like to lend a hand, here are a few ways you can contribute:
- Like our ideas
- Comment on our ideas
- Share our ideas
Cheers,
Team Setupsfx_

LTC - Time to buy again! (Update)Finally, this pattern was broken and had a positive impact, leading to significant growth. Now, with a slight price correction, higher price levels can be reached.
PREVIOUS ANALYSIS
Best regards CobraVanguard.💚
