MANA Resistance LevelI believe that in the future MANAUSD price will break through the short-term resistance level and rise to higher prices.
Manausd

Russian Dolls?Is that a thing? MANA, since the parabolic rise, has lost and gained based on C&H and IC&H patterns. One cup leads to another, kinda like those Russian dolls that fit inside each other. These are just ideas, not financial advice. The reason I published this is because the numbers add up based upon the assumption that the bottom is in and $3.52 is the baseline now. Should it drop to test the drop from the other night, I added that these formations are still valid, but will have a different baseline. That's not a bad thing, because with this token in particular, the bigger the drop, the bigger the rise. Should MANA (when) drop(s) below $3.52, I will adjust the cups for your ease of reference...but for now, based on the assumption MANA is going up from here, for now, these are my ideas, and the data does support these levels. I'm not necessarily "long on mana." These short-term trading ideas don't involve an ATH, just a recovery before a potential drop that I will tackle should the market indicate a need.
I see a lot of comments on other analysts' posts that are negative...chill out. Nobody has been rude to me yet, so let's keep it that way...not to mention, if you took my ideas and did your own research, you would've gained 36% when the market tanked 18%. It's not always going to work that way. They are just ideas and not financial advice. We read them for either confirmation of our own ideas, new ideas, or if you have no idea what you're doing. If you have no idea what you are doing, start reading and be careful. It is a very volatile market...and yes, some of the ideas are bat$4!t crazy.

MANA back in the falling wedge after big drop!Here's a quick Look at MANA 4 hr chart. As we can see, the price broke down from the falling wedge , due to the drop in BTC price, but is now back in the same falling wedge! Keep an eye on this falling wedge!
The best entry would be, when the price breaks above 4.25$ with good amount of volume .
-------------------------------------------
The idea is: Buy when the price breaks above 4.25$ and take profits at the levels shown in the chart.
Targets:
1. 4.65$
2. 5.2$
3. 5.9$
-------------------------------------------
What Is a Wedge in the context of trading?:
"A wedge is a price pattern marked by converging trend lines on a price chart. The two trend lines are drawn to connect the respective highs and lows of a price series over the course of 10 to 50 periods. The lines show that the highs and the lows are either rising or falling and differing rates, giving the appearance of a wedge as the lines approach a convergence. Wedge shaped trend lines are considered useful indicators of a potential reversal in price action by technical analysts.
Key Takeaways for Falling wedges:
1. Wedge patterns are usually characterized by converging trend lines over 10 to 50 trading periods.
2. The patterns may be considered rising or falling wedges depending on their direction.
3. These patterns have an unusually good track record for forecasting price reversals."
-------------------------------------------
If you like the content, then make sure to comment and like the post :D
Follow me for daily profitable trading setups
BTC dictates the market. If BTC falls, then Alts will fall as well. Trade safe!

$7 MANA still in playHello all and happy Friday. If you missed my last mana update and the trade setup, make sure you check the post below.
Looking at MANA on the daily chart we see that we are above the 200 EMA and also found support on the 50 EMA. (Both are bullish indicators).
The dump last night only played in our favor as it triggered all buy limits which we set according to the previous mana update.
Currently the stochastic RSI is in the over sold territory (Daily chart) which can push MANA price back inside the descending triangle.
I am looking to have a daily candle close above $4 which will keep us inside the descending pattern, and also above the previous ATH.
Closing around $4.3 or inside the Fib golden pocket at around $4.7- $4.8, will be extremely bullish for MANA, and for the short term we can see $7 price target which sits at 161 fib level. This will be a 100% profit from the current price.
Thanks for reading and stay tuned. Enjoy.

WHAT IS MANA GONNA DO NEXTHey Guy's,
So the metaverse is the new craze in the crypto verse and MANA has been in the lead for a few days now
We seem to be seeing some cool-off right now
but am actually optimistic for the end of year
The question is where do we begin to see a new up trend ?
At point 1 or point 2
What trend line will price respect ?
Only time will tell
Lets discuss in the comments section

MANA is a meta-universe concept cryptocurrency I'm going to add it to my asset analysis group. Follow my ideas if you are interested in this asset.

Decentraland AnalysisDecentraland is on a corrective wave right now. These are our current potential buy levels. Like & Comment your thoughts.
Until Next Time.

MANA build up? This mana Chart is looking very similar to my past bull flag analysis I hade made!
How high do you think we can go this time?

Is MANA about to fall?After checking in multiple time frames black line its the next move ONCE it broke down the support IF dont broke the support we will have a consolidation phase.
The question here is... Once current support has been broken, whats the next step? so for now Im not sure about this analysis, then please dont follow as investment tip.

Decision time!Mana's indecisive candle is working hard to figure out whether to tank or keep fighting.

Mana to $7 or $3 first ?Hello all. Interesting pattern formation for mana both on daily and on the 4hr charts.
We have a descending channel which can play as a bull flag and put us around $7.
On the other hand, we have formed a descending triangle which is a bearish pattern. The measured move for this patter is approximately 35% which will put us at around $3 range. This level corresponds with the 50 EMA on the daily also with the fib gold pocket.
Definitely interesting to watch since we have bearish and bullish sentiment going on. Keep an eye on it.
Super bullish long term and buying more. Top of the ascending channel sits around $7 which we will reach very soon no matter what.
Thanks for reading and stay tuned. Enjoy.

25-28% Drop ahead?Measures towards 28% but I have had 26% on my radar for a couple of days...maybe just depends on where the flat bottom fails? Keep an eye on it. There is very strong support around $4.32, so who knows. These are just ideas and not financial advice. Unfortunately, not a lot of bullish ideas for today, especially since it failed earlier to reach a potential break out, falling short of $4.87 @ $4.82.

MANA USDT analyseIf Mana can hold the 0.236 fib line we could see a retest to 5,2$. As you can see at trying of the yellow line it got rejected. If Mana can't hold the red line, we will try to touch the white line. So currently if you hodl, buying is a good idea, but you could get better entrys, so maybe split buy orders!

MANA: HTF FractalHTF Fractal taken from previous price increase, when stretched so that the beginning of the run fits the beginning this current run, seems to be somewhat predictive so far.
Is this a crazy price target? Yes.
May it be warranted? Possibly...
MANA is now a direct competitor to 'META' (formerly, 'Facebook'). Meta's current market cap is ~880 billion. MANA's is around 8.6 billion.
If MANA had Meta's market cap (so assuming some scenario where MANA becomes THE metaverse, beating out Facebook /Meta and all other competitors), that would put MANA's price at ~$482.
Full disclosure: this isn't so much a serious possibility in my mind, at least not yet, I'm just posting this to see how this theory/ fractal pans out; mostly just curious.


More Cup and Handles!?!?These are just possible scenarios and not financial advice. Two Bullish, One Bearish. Short-term Cup&Handle takes us to $6.11ish...which would have the original monster Cup and Handle's same target! Ascending triangle to $7.50...maybe checking in around $4.62 again before heading there? If she drops to $4.37, making a flat bottom, expect a drop towards $3.27. Unfortunately, the bearish scenario would be confirmed by both the short-term .382Fib AND the target of that nasty H&S we were hoping got stifled the other day...Good luck.

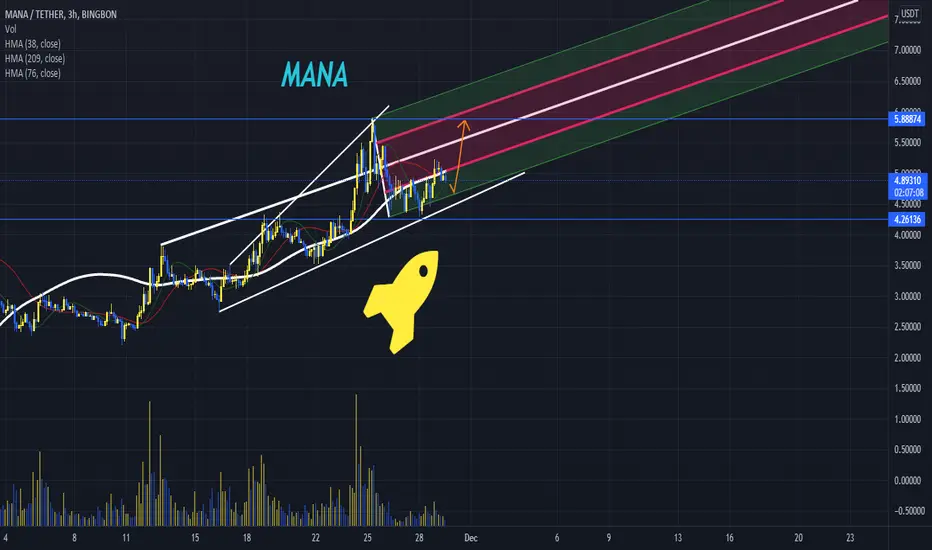
WHAT NEXT MANA BREAK THE PRICE Hello my friends, today I want to talk with you about MANA
As you can see on a chart
Price also have very strong support AT 4.26136
On a chart, I indicate targets is 5.88876
So, at this moment I still think MANA will show us grow soon
This is an article, not financial advice, always do your own research.
If you have any questions, you can write it in comments below, and I will answer them.
And please don't forget to support this idea with your like and comment, thank you.
MANA short term short play opening nowMana has crossed down 50 DEMA and approaching 200 DEMA down. Bearish confirmation almost complete on candles. Opening 3xs @4.91.
MANA3S/USDT 2021-11-29 04:44:59 Buy 0.169 USDT 3381.33 MANA3S 571.44477000 USDT 3381.33 MANA3S 0.169 USDT Filled

MANAUSDT Price UpdateMana after breaking out from the cup & handle pattern still is in an uptrend but I think it lost its momentum to go higher. Right now if the price crosses the 5.89 & 5.13 resistance levels we can say it makes a higher high and the uptrend is valid but if we cross the 4.07 support level this would be bad for MANA and we could see some correction.

MANAUSD BUY IDEADMana has pulled back into the GOLDEN zone areas of 50%-71% fib support levels. If we hold these strong levels of support/floor, we could potentially see our next push up to test previous highs of $5.50 again to the 161.8 fib resistance of $7. Currently price is at $4.90 which is a great buy in price. Targets are set from fib levels resistance zones. First potential target is the 100% fib level, Second potential target is the 127 fib level and finally Target to 161.8 fib level. But I would take profit accordingly as price rise hitting the different profit targets. This is not financial advice and I'm not a financial advisor, please do your own due diligence this is only my opinion.

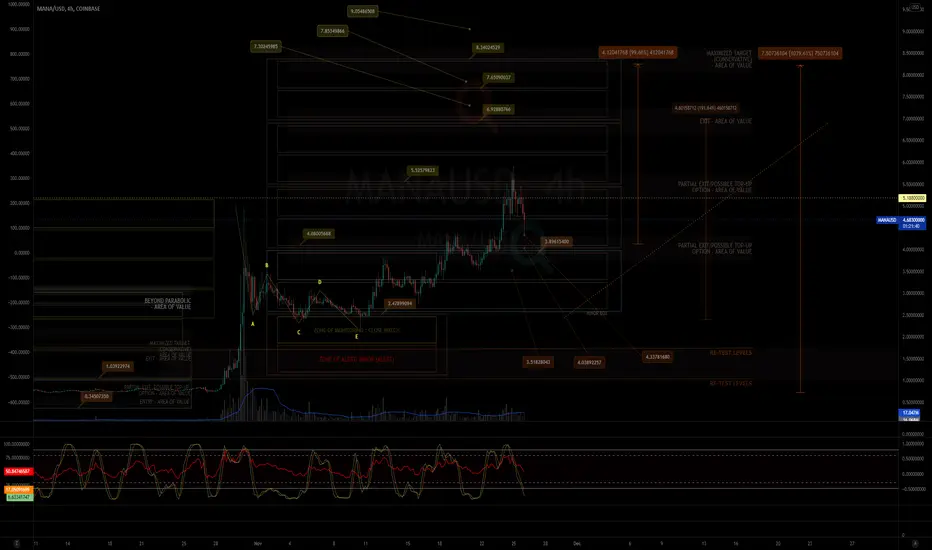
MY MINIMALIST CHART ANALYSIS FOR DECENTRALAND$MANA
11.26.21
1829H +8 SINGAPORE
ALERT:
LOOKING FOR BEST TOP-UP ENTRY BEFORE the end of the SWING CYCLE.
We are now looking at an ENTRY that we can TOP-UP for our Investment FIB 0.618 or LOWER.
A little more till we finish this swing and move to the next swing cycle.
VITAL SIGNS : RSI, STOCH are all looking good. We will just wait for oversold. While the VOLUME shows SUPPLY building up for DEMAND (FUD).
The Market has amazingly moved along the TOPS and BOTTOMS of our BOXES, signifying TURNING POINTS of PRICE ACTION. Volatility for this market is healthy.
and we have gone a long way from the bottom of the SWING.
Happy Trading!
Disclaimer:
The findings of the following analysis are the sole opinions of the publisher of this idea and should not be taken as a piece of investment advice.
INSTRUCTIONS: HOW TO USE THIS MINIMALIST CHART
"FOLLOW THE WHITE RABBIT!"
Just Follow the TOPS and BOTTOMS of the BOXES as a GUIDE where the MARKET will take you.
Created on a MONTHLY, WEEKLY & DAILY Analysis of a MARKET'S CHARACTER.
It is designed for SWING TRADES at the BOTTOM. I do not SHORT, though, you can still use it.
TARGET ZONE IDENTIFICATION
The LARGE BOXES (Tops and Bottoms) are MAJOR turning points that will occur sometime in the future. While the SMALL BOXES (Tops and Bottoms) are MINOR turning points.
These can be entries to a BUY/ SELL POSITION, EXIT/PARTIAL EXIT/TOP-UP AREAS, as well as Support and resistance levels
Also includes MAXIMUM TARGET EXIT AREA OF VALUE - CONSERVATIVE (If price action conditions are right at that given moment.)
At times I include WAY BEYOND PARABOLIC Price TARGETS depending on The Character of the Market (CRYPTOS ONLY).
DYOR for your Volume, Chart Patterns, Candlestick Math, FIB COILS ( ABC ), Price Action, FIB LEVELS, Market Dynamics, especially institutional and retailer trading psychology.
Wishing you all The Best Trades and Thank you all for your Appreciation and Support of My Work.
Much thanks to My 3 Mentors. They are so much of a Blessing that I also wish to Share.
Vive Le Autist!
Vive Le Egalitarianism!
The Show is Far From OverI still think that Mana is just getting started. While this is just a fun idea/sketch of what I think it can look like before its next big breakout, I'd still be cautious with how you trade it right now.
Nonetheless, let me hear your price predictions!
As always, please consider liking and checking out our posts, and if you gained value I urge you to follow us!
Not intended as financial advice blah blah blah. Good Luck!

$MANA will we see $7.00+ by YE 2021?Helllooo WORLD!
$MANA, is channeling along a bullish pennant, will we see $7.00+ before YE and will the most maximized entry be in the low $3's within the next 2 weeks? Feel free to share your thoughts below!
Much Love,
MS ROBOT
COINBASE:MANAUSD

MANA have a chance to became bullish again, here you can buy!MANA Short term Analysis
4.4$ is a super strong support, I think this level will be kept
And if that happens next targets will be 7.3$ and 8$ for MANA.
Mana was so strong when BTC dumped, I'm still bullish on that. Buying Mana in red zone is logical but set stop loss for sure.
