Emotional Patterns: What Your Trades Reveal About YouTrading feels technical on the surface, yet the deeper layer is psychological. Charts highlight opportunities, but the way you behave inside those opportunities shapes the outcome. Each trade reflects how you respond to pressure, uncertainty, and risk. Over time, these reactions create emotional patterns that influence results more than strategy.
One early pattern appears after a loss. A losing trade often triggers frustration, and that frustration pushes traders into fast entries aimed at regaining control. The decision becomes driven by emotion rather than process, and this behaviour can quickly lead to a cycle of overtrading.
Winning streaks create a different pattern. Confidence expands, and many traders begin increasing size, loosening rules, or entering before confirmation because recent success feels reassuring. This overextension usually leads to sharp setbacks when the market shifts.
Another frequent pattern is hesitation. Traders with inconsistent execution tend to freeze at key moments. They wait for additional confirmation, delay entries, or watch clean setups move without them. The pause often comes from the memory of previous mistakes rather than a lack of technical understanding.
Entries reflect trust in the system. Exits reflect trust in personal decision-making. Closing a trade too early often shows discomfort with open profit. Holding a losing trade too long often comes from discomfort with accepting a loss. These behaviours reveal the trader’s relationship with risk far more clearly than any written reflection. The chart becomes a mirror.
Recognising emotional patterns provides clarity. When recurring behaviours appear—chasing, hesitating, forcing trades, avoiding losses—they become easier to interrupt. Once a pattern is visible, it starts losing influence.
Structure then supports the change: rules, checklists, routines, and clear confirmation criteria. These elements stabilise execution and reduce the impact of emotional impulses.
A strategy defines potential entries, but emotional patterns determine whether the trader can execute consistently enough to benefit from it. Awareness strengthens decision-making. When you understand what your trades reveal about your behaviour, you can adjust it and bring execution closer to intention.
This is where consistency begins.
Market

$SPY & $SPX Scenarios — Tuesday, Dec 9, 2025🔮 AMEX:SPY & SP:SPX Scenarios — Tuesday, Dec 9, 2025 🔮
🌍 Market-Moving Headlines
• Small business sentiment + job openings hit Tuesday morning — both matter for labor tightness and inflation interpretation ahead of Wednesday’s FOMC.
• Shutdown-delayed JOLTS data finally drops. Market will react to whether openings continue to cool or stay elevated.
📊 Key Data & Events (ET)
6 00 AM
• NFIB Small Business Optimism (Nov): 98.2
10 00 AM
• Job Openings, JOLTS (Oct, delayed): 7.2 million
⚠️ Disclaimer: For informational use only — not financial advice.
📌 #SPY #SPX #trading #macro #JOLTS #NFIB #markets #investing

$SPY & $SPX Scenarios — Week of Dec 8 to Dec 12, 2025🔮 AMEX:SPY & SP:SPX Scenarios — Week of Dec 8 to Dec 12, 2025 🔮
🌍 Market-Moving Headlines
🏦 FOMC week: Wednesday’s rate decision and Powell press conference are the dominant catalysts. Markets will focus on wording around inflation progress, growth risks, and timing of future cuts.
🧾 Shutdown-delayed data continues: Job openings, Employment Cost Index, and several September reports are still rolling in late, creating uneven visibility for traders.
📉 Labor and inflation signals midweek: ECI, jobless claims, and trade balance provide additional color on wage pressures and global demand.
🧺 Quiet Monday — then the calendar heats up fast.
📊 Key Data & Events (ET)
MONDAY, DEC 8
• None scheduled
TUESDAY, DEC 9
⏰ 6 00 AM
• NFIB Small Business Optimism (Nov): 98.3
⏰ 10 00 AM
• Job Openings (Oct, delayed): 7.2 million
Note: From the shutdown backlog
WEDNESDAY, DEC 10 — FOMC DAY
⏰ 8 30 AM
• Employment Cost Index, ECI (Q3, delayed): 0.9 percent
⏰ 2 00 PM
• FOMC Interest Rate Decision
• Monthly United States Federal Budget (Nov): –139.6 billion
⏰ 2 30 PM
• Fed Chair Powell Press Conference
THURSDAY, DEC 11
⏰ 8 30 AM
• Initial Jobless Claims (Dec 6): 220,000
• United States Trade Deficit (Sept): –61.6 billion
FRIDAY, DEC 12
⏰ 10 00 AM
• Wholesale Inventories (Sept): Not released for this cycle
Note: September report was canceled; August was the last available
⚠️ Disclaimer: For educational and informational use only — not financial advice.
📌 #SPY #SPX #trading #macro #FOMC #Powell #inflation #labor #economy #markets #investing

Nifty Short & Medium Term Support&Resistance_08-Dec to 12-Dec-25Nifty Short & Medium Term Support&Resistance_08-Dec to 12-Dec-25
Nifty 26186 (26202 Last week)
Long call ( Buy) was given on 12-Oct-25 at 24896, Nifty have crossed near to 1300 points.
Quarterly results of companies are released and so far it have mixed to Postive results.
Margins and revenue growth are major concern, Net profit being achieved by savings on employee cost and other savings. To be more cautious on picking the right stock and rebalance the portfolio. The stocks posted Moderate to Good Results have increased and taken the Nifty near to all time high.
Last week, 9.2% GDP growth of Q2 was released and may created a positive sign in the market depsite trade deals issues. Putin's Visit to India, gave a hope for export and import deals other than petroleum imports.
However overall, Tariffs deal will decide the future path till Dec - Jan for the Nifty. Since it is a Volatile situation SIP route or buy in multiple parcel route ( On Dips) with a goal of 3-5 years will workout. US Trade deal, 1st Feb budget and reforms if any will decide Nifty's path. US trade deal not being signed may create a worry for the market.
Some of the stocks to watchout given last week are HDFC AMC, NMDC, Apar, Sharda Crop, VRL Logistics, krishna Phos chem, Cipla, Dr Reddy, Natco ( Buy on Dip as still there is negative trend), Apl Apollo Tubes, Muthoot Finance ( On Dips) , tata Steel ( Contra Stock due to Business Cycle), Bank of Mah, BPCL, CG Power, hero motor, shriram finance and NRB bearings. Shared for Analysis purpose only. Dr Reddy, shriram fin, natco pharma, Hero moto corp,Muthoot Finance have already given more than 10% return in this 1 month. Waaree Energies had an IT raid in its premises in Mid of Nov 2025. Outcome will take the stock forward.
The strategy continued to be long and use the opportunity to buy on dips similar to SIP.
Current Short Term Resistance 26321 ( all time high). It need to break the resistance 26321 decisively to move up to 27000 target in med-long term. As RSI is at 60%, room to go higher will be less in short term.
Nifty Short Term Supports ( Multiple Supports are there between 25000-25500):
26000
25670 (Jun 2025 High)
25360-25420 ( Sep high and trendline support as shown in chart)
25300-25350 (Two Fibonacci resistance shown ) - Major Support
Hence 25300- 25420 acts as major short term support.
25500 ( 25441 Sep 18th 2025 High )
25450 ( 25442 is the Aug 2025 high)
25200 ( 25154 Aug 2025 high)
25000 ( Milestone)
Short Term Resistance
1.26321 ( All time High)
2. 26500
Medium Term Support:
1.24700 (Trend Line as shown)
2. 24000-24170 (Fibonacci Retracements Supports- Two Supports in this zone 24116 & 24171 as shown)
3. 23500-23700 (Fibonacci Retracements Supports- Two Supports in this zone 23608 & 23707 as shown)
2. 23000
Medium Term Resistance:
1.27000 ( Need to decisively break 26269 all time high) This resistance is based on Fibonacci resistance at 27034
Long term resistance:
1.28000 ( Need to decisively break and move up 27000)This resistance is based on Fibonacci resistance at 28106
Long Term Support
1.22700-23000 ( Trend line and Mar 2024 High)
2.Big support at 20000 (Sep 2023 high)

AKT/USDT — Path Toward $7 with 500M +Market Cap Potential AKTis is currently showing early structural strength after a long accumulation phase.
Based on current supply metrics and market behavior, a 500M market cap could push the price
TO NEW ATH with time.
Current base forming near $0.44
Next psychological and technical targets at $0.68 → $1
If momentum continues building, AKT could be entering a stage where new capital inflows drive a high-multiple move, similar to its previous historical run.
💡 Observation: The chart shows similar accumulation and volume buildup patterns seen before large runs — a breakout could mark the start of a new growth cycle.
📈 Outlook: Bullish scenario 7 usd+
🎯 Market Cap Target: 500M+
For this coin Pippin: USDT, we did made the same study, and it did increase in a short time more than 10x

BTC — [2D] WEEK 49 TREND REPORT | 12/05/2025BTC — WEEK 49 TREND REPORT | 12/05/2025
Ticker: BINANCE:BTCUSDT
Timeframe: 2D
This is a reactive structural classification of BTC based on the weekly chart as of this timestamp. Price conditions are evaluated as they stand — nothing here is predictive or forward-assumptive.
⸻
1) Current Trend Condition [ Numbers to Watch ]
Current Price @ 89,200
• Trend Duration @ +98 Days ( Bullish )
• Trend Reversal Level ( Bullish ) @ 103,400
• Trend Reversal Level ( Bullishh Confirmation ) @ 103,400
• Pullback Support @ 100,002
• Correction Support @ 79,436
⸻
2) Structure Health
• Retracement Phase:
Correction (approaching 61.8%)
• Position Status:
Unstable (price below both structural layers)
⸻
3) Temperature :
Cooling Phase
⸻
4) Momentum :
Bearish
⸻
Author’s Note
DOWNWARD STRUCTURAL ALIGNMENT
This mark identifies a moment where the market showed clearer alignment with downside direction. It does not predict future movement, but acknowledges where weakness became more evident within the prevailing structure. Its relevance remains only while price continues to hold beneath key structural boundaries.
⸻
Methodology Overview
This classification framework evaluates directional conditions using internal trend-interpretation logic that references price behavior relative to its structural layers. These relationships are used to identify when price movement aligns with the framework’s criteria for directional phases, transition points, or regime shifts. Visual elements or structural labels reflect these internal interpretations, rather than explicit trading signals or preset indicator crossovers. This framework is observational only and does not imply future outcomes.

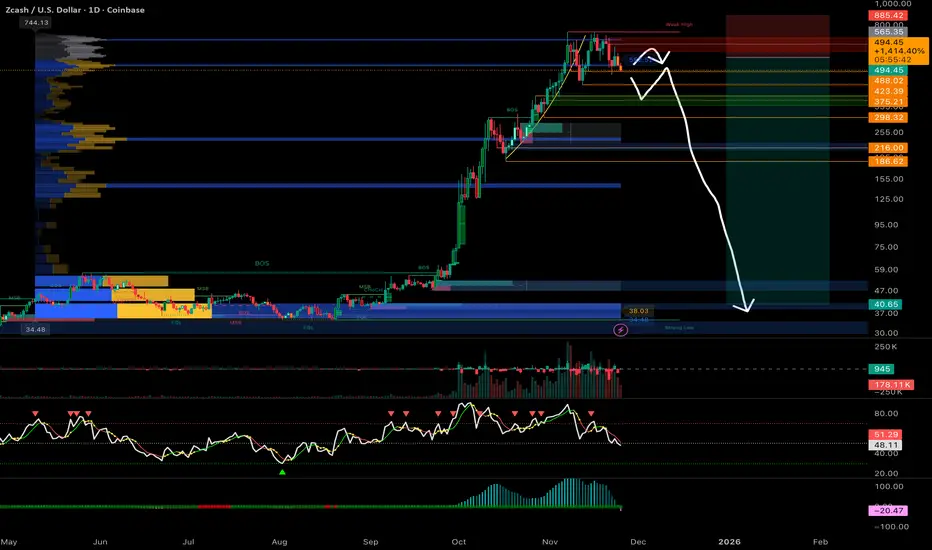
Is ZEC in big trouble ? (part. 2)Update and continuation of my last idea.
A new dawn on that ZEC short im building
we are witnessing the biggest exhaustion since this run and more down should follow
note that, as I did for the last idea, I'll update often the post and my bias can change from bearish to bullish if ZEC give me the opportunity to do so
I opened the first short yesterday at 567 and wanted to wait the next days to post to be sure it was a good one, also was waiting for a last higher high but im not sure it will come. More positions should follow if bears stay presents.
Right now BTC is pumping with no volume (bearish) and ZEC can't follow (even more bearish), it was really tempting to publish that post
For now : if 470 fails we should just go to 380
Cheers
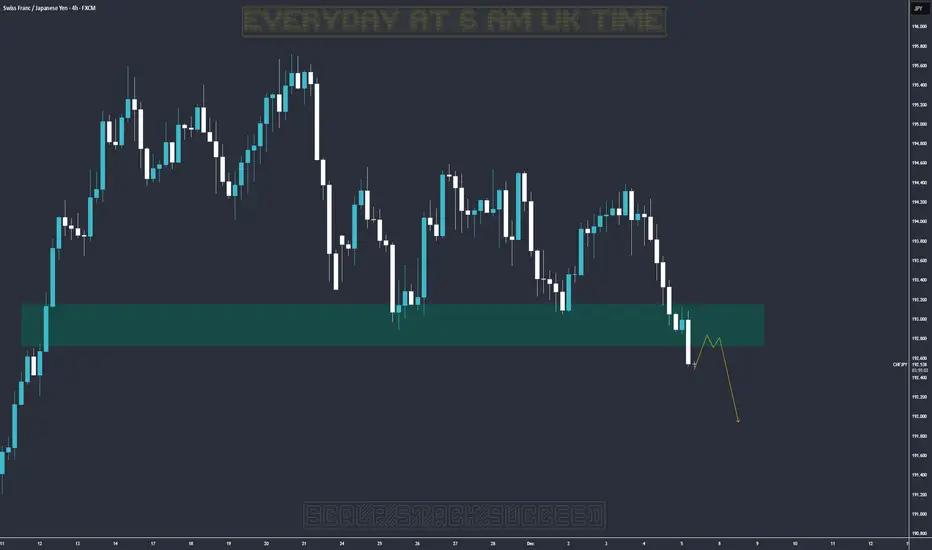
QuickScalp on #CHFJPY📌 Market Insight: {#CHFJPY }
⚠️ Risk Assessment: {High}
🚀 Approach:
Not a Quality Setup ... Need VALID LTF entry Sign first ! ... NO RUSH... Its friday i rather to have NO trade than have a RISKY trade .
#Ash_TheTrader #Forex #GBPJPY #MarketAnalysis #TradingSetup #RiskManagement #GOLD #Scalper #NQ #EURUSD
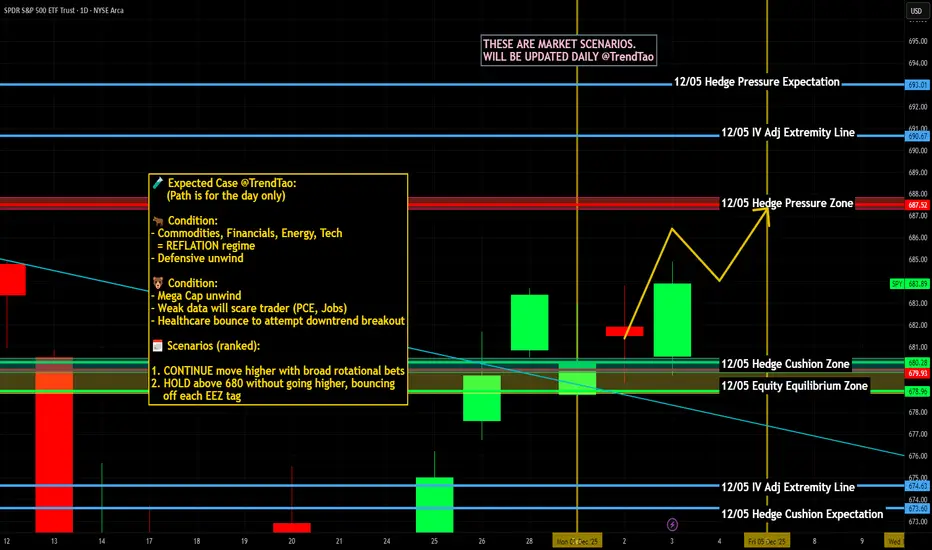
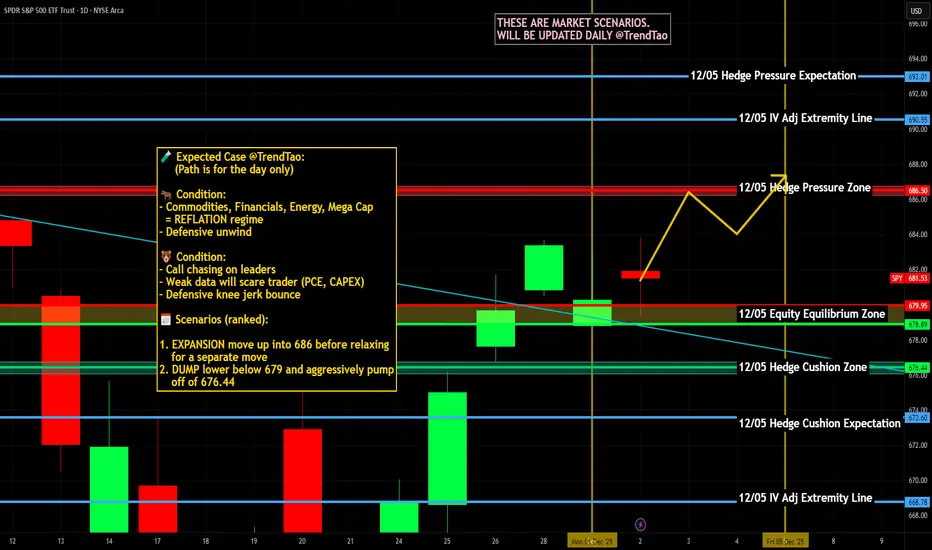
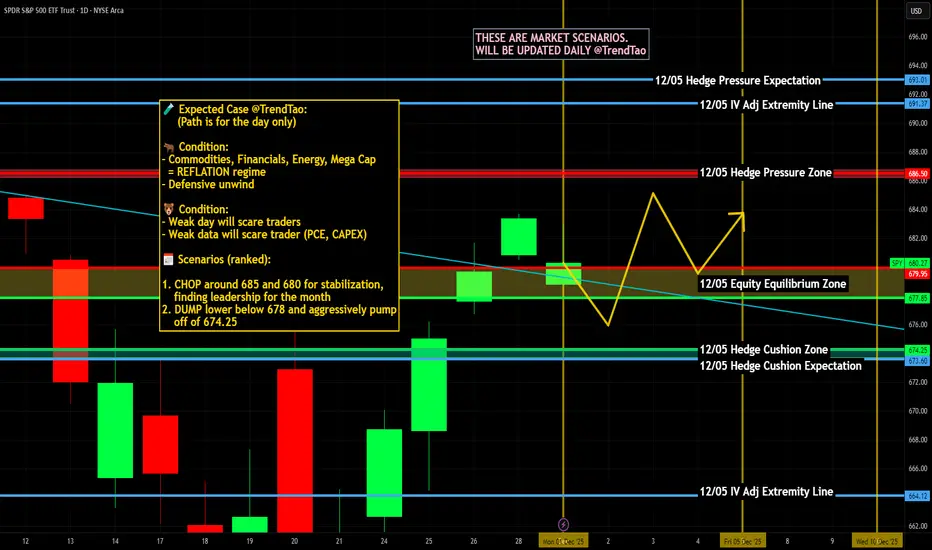
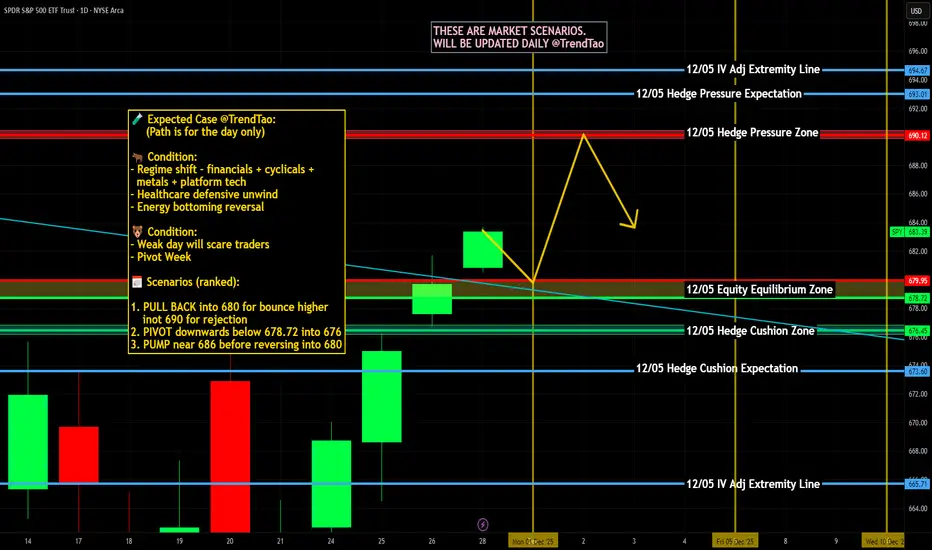
$SPY & $SPX Scenarios — Friday, Dec 5, 2025🔮 AMEX:SPY & SP:SPX Scenarios — Friday, Dec 5, 2025 🔮
🌍 Market-Moving Headlines
🧨 Big inflation catch-up day: A cluster of delayed PCE reports hits at once — this is the Fed’s preferred inflation gauge and will dictate rate-path expectations into year-end.
🧭 Consumer sentiment & credit: Adds read-through on household stress, spending durability, and recession probability.
📊 Key Data and Events (ET)
⏰ 8 30 AM — Heavy Macro Drop
• Personal Income (Sept, delayed): 0.3% vs 0.4%
• Personal Spending (Sept, delayed): 0.4% vs 0.3%
• PCE Index (Sept, delayed): 0.3% vs 0.3%
• PCE YoY: 2.9% vs 2.9%
• Core PCE Index (Sept, delayed): 0.2% vs 0.2%
• Core PCE YoY: 2.8% vs 2.7%
⏰ 10 00 AM
• Consumer Sentiment (prelim, Dec): 52.0 vs 51.0
⏰ 3 00 PM
• Consumer Credit (Oct): $10.5B vs $13.1B
⚠️ Disclaimer: Educational and informational only — not financial advice.
📌 #SPY #SPX #PCE #inflation #macro #fed #consumer #markets #stocks #trading #investing

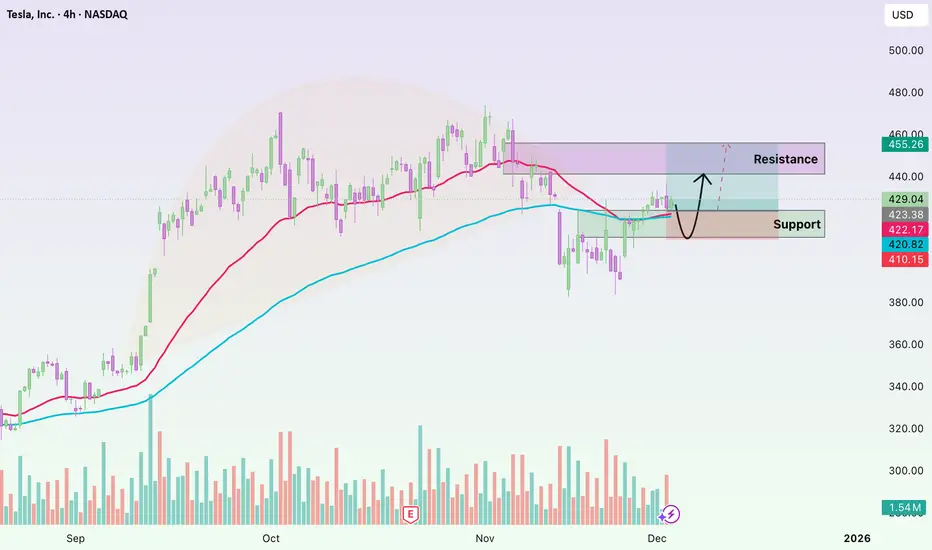
Tesla: Do Converging EMAs Signal a Decisive Moment?Hello everyone, looking at Tesla’s current rebound, my first impression is that the market is entering a rather sensitive “trend-defining zone.” After a strong decline since mid-November, TSLA has finally bounced and climbed above the EMA 34, moving straight into a test of the EMA 89 — where the two moving averages are creating a technically noteworthy confluence area.
In the past few weeks, Tesla consistently stayed below both the EMA 34 and EMA 89 , reflecting a clear and somewhat heavy downtrend. But the current recovery has partially changed the picture: buying momentum has returned strongly enough to push price above the EMA 34 and close in on the EMA 89. This is typically the moment when the market reveals its true intention — either continuing upward to confirm a phase shift, or pausing because buying pressure has not yet matured.
Volume has increased but remains relatively modest, indicating that large capital has not truly stepped in. This makes the 435–440 USD resistance zone a significant challenge: Tesla has been rejected here multiple times, and if buying power lacks depth, price may easily turn downward again.
Wishing everyone effective trading and resilience through every market movement!
PLTR — [2D] WEEK 49 TREND REPORT | 12/04/2025PLTR — WEEK 49 TREND REPORT | 12/04/2025
Ticker: NASDAQ:PLTR
Timeframe: 2D
This is a reactive structural classification of PLTR based on the weekly chart as of this timestamp. Price conditions are evaluated as they stand — nothing here is predictive or forward-assumptive.
⸻
1) Current Trend Condition [ Numbers to Watch ]
Current Price @ 178$
• Trend Duration @ +546 Days ( Bullish )
• Trend Reversal Level ( Bullish ) @ 177.54
• Trend Reversal Level ( Bearish Confirmation ) @ 166.16
• Pullback Support @ 133.47
⸻
2) Structure Health
• Retracement Phase:
Uptrend (operating above 78.6%)
• Position Status:
Healthy (price above both structural layers)
⸻
3) Temperature :
Neutral Phase
⸻
4) Momentum :
Bullish
⸻
Author’s Note
NEUTRAL STRUCTURAL CONDITION
This mark represents a period where directional behavior was unclear. Market movement here reflected compression, chop, or indecision — neither trend direction was dominant. It does not signal continuation or reversal, only that price action was not showing strong alignment in either direction.
⸻
Methodology Overview
This classification framework evaluates directional conditions using internal trend-interpretation logic that references price behavior relative to its structural layers. These relationships are used to identify when price movement aligns with the framework’s criteria for directional phases, transition points, or regime shifts. Visual elements or structural labels reflect these internal interpretations, rather than explicit trading signals or preset indicator crossovers. This framework is observational only and does not imply future outcomes.

AVGO — [2D] WEEK 49 TREND REPORT | 12/04/2025AVGO — WEEK 49 TREND REPORT | 12/04/2025
Ticker: NASDAQ:AVGO
Timeframe: 2D
This is a reactive structural classification of AVGO based on the weekly chart as of this timestamp. Price conditions are evaluated as they stand — nothing here is predictive or forward-assumptive.
⸻
1) Current Trend Condition [ Numbers to Watch ]
Current Price @ 381
• Trend Duration : +228 Days ( Bullish )
• Weekly Trend Reversal Level ( Bearish ) @ 363.53
• Weekly Trend Reversal Level ( Bearish Confirmation ) @ 322
• Pullback Support @ 320
• Correction Support @ 255
⸻
2) Structure Health
• Retracement Phase:
Uptrend (operating above 78.6%)
• Position Status:
Healthy (price above both structural layers)
⸻
3) Temperature :
Warming Phase
⸻
4) Momentum :
Bullish
⸻
Author’s Note
UPWARD STRUCTURAL ALIGNMENT
This mark reflects a point where market behavior supported the continuation of the existing upward direction. It does not imply forecasting or targets — it simply notes where strength became observable within the current trend. Its meaning holds only while price continues to respect the broader structural levels that define the trend.
⸻
Methodology Overview
This classification framework evaluates directional conditions using internal trend-interpretation logic that references price behavior relative to its structural layers. These relationships are used to identify when price movement aligns with the framework’s criteria for directional phases, transition points, or regime shifts. Visual elements or structural labels reflect these internal interpretations, rather than explicit trading signals or preset indicator crossovers. This framework is observational only and does not imply future outcomes.

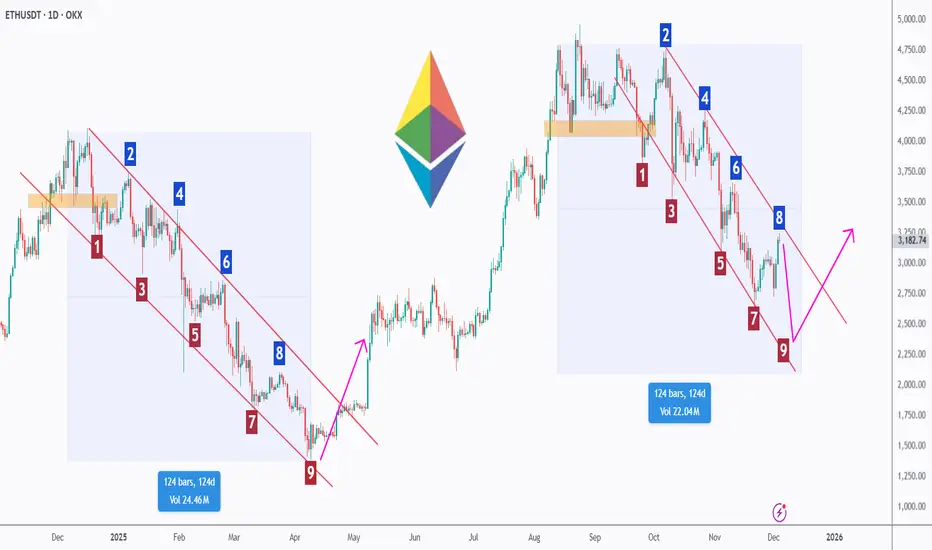
ETH - Same Pattern. Same Timeline. Same Outcome?Ethereum is showing something extremely interesting… and extremely familiar.
When we compare the previous corrective cycle to the current one, both have unfolded almost identically, not just in structure, but also in duration, each measuring around 124 days.
🌊Both cycles followed a clean 1-to-9 wave sequence inside a falling channel before ETH broke out aggressively. And right now, ETH is completing the same exact structure, approaching wave 9 once again.
🔄If history rhymes, and it often does in crypto, ETH may be preparing for a major impulsive phase, similar to what happened after the previous 124-day correction.
From the lower bound of the channel, we will be looking for trend-following longs, anticipating a potential bullish reversal that mirrors the last breakout.
Cycles don’t repeat perfectly…
But they rhyme more often than people think. 📈✨
⚠️ For now, the trend remains bearish, however, ETH would invalidate the entire bearish structure if the upper trendline breaks upward aggressively, signaling that bulls have fully taken over.
Do you believe ETH is about to repeat its previous breakout? Share your view below! 👇🔥
⚠️ Disclaimer: This is not financial advice. Always do your own research and manage risk properly.
📚 Stick to your trading plan regarding entries, risk, and management.
Good luck! 🍀
All Strategies Are Good; If Managed Properly!
~Richard Nasr
$SPY & $SPX Scenarios — Thursday, Dec 4, 2025🔮 AMEX:SPY & SP:SPX Scenarios — Thursday, Dec 4, 2025 🔮
🌍 Market-Moving Headlines
🧱 Labor pulse before the weekend: Weekly claims remain a key gauge of cooling versus resilience in the labor market — especially with jobs data still disrupted from prior shutdown delays.
🎤 Bowman speaks at noon: Moderate-impact event, but tone on regulation, credit conditions, and inflation watch may move yields slightly in a light-data session.
📊 Key Data and Events (ET)
⏰ 8 30 AM
• Initial Jobless Claims (Nov 29): 220,000 vs 216,000
⏰ 12 00 PM
• Fed Vice Chair for Supervision Michelle Bowman — Remarks
⚠️ Disclaimer: Educational and informational only — not financial advice.
📌 #SPY #SPX #macro #labor #joblessclaims #fed #markets #stocks #trading #investing
$SPY & $SPX Scenarios — Wednesday, Dec 3, 2025 🔮 AMEX:SPY & SP:SPX Scenarios — Wednesday, Dec 3, 2025 🔮
🌍 Market-Moving Headlines
💼 Labor + services-heavy morning: ADP, import prices, services PMIs, and ISM all land before 10 AM — a full macro pulse on jobs, inflation pressure, and service-sector strength.
🧾 Shutdown-delayed September reports continue: Import Prices, Industrial Production, and Capacity Utilization still come from the backlog but remain relevant for inflation and growth trend review.
📈 ISM Services is the star: With manufacturing soft, services remain the market’s key gauge of economic momentum into year end.
📊 Key Data and Events (ET)
⏰ 8 15 AM
• ADP Employment (Nov): 40,000 vs 42,000
⏰ 8 30 AM
• Import Price Index (Sept, delayed): 0.1 percent vs 0.3
• Import Prices ex Fuel (Sept, delayed): 0.4 percent
⏰ 9 15 AM
• Industrial Production (Sept, delayed): 0.1 percent
• Capacity Utilization (Sept): 77.3 percent
⏰ 9 45 AM
• S and P Final United States Services PMI (Nov): 55.0
⏰ 10 00 AM
• ISM Services (Nov): 52.5 percent
⚠️ Disclaimer: Educational and informational only — not financial advice.
📌 #SPY #SPX #trading #macro #ADP #services #ISM #inflation #imports #markets #investing
a HighRisk QuickScalp on #USDJPY📌 Market Insight: {#USDJPY }
⚠️ Risk Assessment: {High}
🚀 Approach:
Not a Quality setup right now ... and need a valid LTF entry . without it , should skip this setup ... NO RUSH
#Ash_TheTrader #Forex #GBPJPY #MarketAnalysis #TradingSetup #RiskManagement #GOLD #Scalper #NQ #EURUSD

$SPY & $SPX Scenarios — Tuesday, Dec 2, 2025 🔮 AMEX:SPY & SP:SPX Scenarios — Tuesday, Dec 2, 2025 🔮
🌍 Market-Moving Headlines
🎤 Bowman testimony hits at 10 AM — this is the only fixed macro event of the day, and her tone on regulation and economic conditions can nudge yields.
🚗 Auto Sales (Nov) TBA — release time unclear, but this report can move cyclicals if it prints far from expectations. Previous level was 16.4 million annualized.
📊 Key Data and Events (ET)
10 00 AM
• Fed Vice Chair for Supervision Michelle Bowman — Testimony
TBA
• Auto Sales (Nov)
Previous: 16.4 million
Note: Release time is not announced
⚠️ Disclaimer: For educational use only, not financial advice.
📌 #SPY #SPX #stocks #macro #fed #autosales #markets #trading #investing
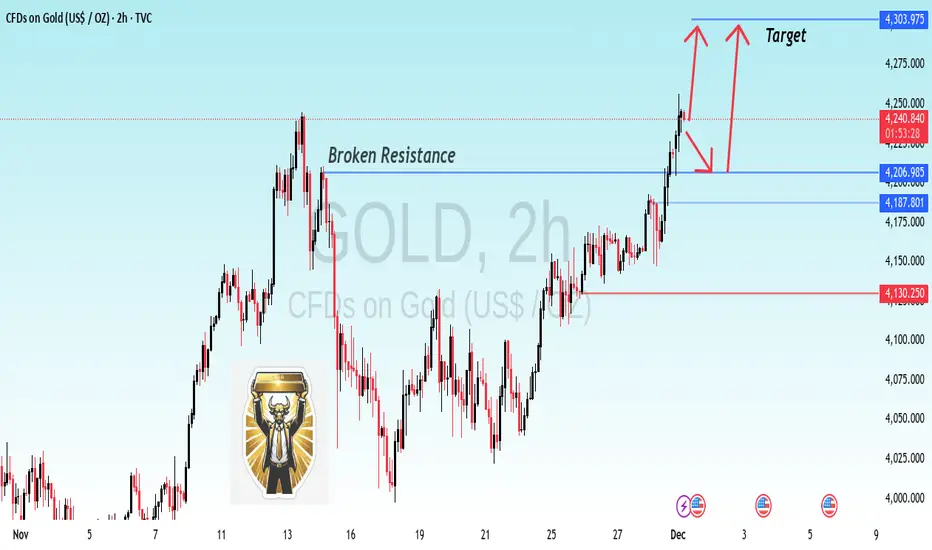
GOLD Breakout Confirmation Bulls trakin ControlUPDATE: Previous GOLD Idea Hit 100% Exactly as Expected! | JT_CHARTsMaster
The last analysis played out perfectly — GOLD followed the exact structure, respected the levels, and completed the move with full accuracy.
Thank you to everyone who supported the previous idea!
---
📌 Current Analysis (2H Timeframe)
Gold has broken the key resistance zone, and price is now retesting the breakout area.
After this clean retest, the market is showing signs of bullish continuation.
Key Points:
✔ Previous resistance now acting as support
✔ Break–retest–continuation structure is active
✔ Market is holding above the breakout zone
✔ Bullish momentum is building toward the next targets
---
📈 Expected Move
As long as gold stays above the breakout level, the probability of a move toward the next targets remains strong.
I’ve highlighted the expected upward move on the chart with arrows for clarity.
---
🙏 Thanks for Your Support
Your boosts, comments, and likes motivate me to share more accurate analyses like this.
👉 If you found this helpful, please Boost the idea and leave a comment — it really helps!
— JT_CHARTsMaster
PIPPIN/USDT — Path Toward $0.50 with 500M Market Cap PotentialPIPPIN/USDT — Path Toward $0.50 with 500M Market Cap Potential 🚀
PIPPIN is currently showing early structural strength after a long accumulation phase.
Based on current supply metrics and market behavior, a 500M market cap could push the price toward the $0.50 zone, representing a major expansion phase from current levels.
📊 Market Structure Overview:
Current base forming near $0.028
Next psychological and technical targets at $0.33 → $0.50
The $0.50 region aligns with ~500M market cap potential
If momentum continues building, PIPPIN could be entering a stage where new capital inflows drive a high-multiple move, similar to its previous historical run.
💡 Observation: The chart shows similar accumulation and volume buildup patterns seen before large runs — a breakout could mark the start of a new growth cycle.
📈 Outlook: Bullish scenario toward $0.50
🎯 Market Cap Target: 500M

$SPY & $SPX Scenarios — Week of Dec 1 to Dec 5, 2025🔮 AMEX:SPY & SP:SPX Scenarios — Week of Dec 1 to Dec 5, 2025 🔮
🌍 Market-Moving Headlines
🏭 PMI and ISM reset the growth story: Monday and Wednesday bring manufacturing and services surveys that will steer the “soft landing versus slowdown” debate into year end.
🎤 Powell in prime time: Monday night remarks from the Fed Chair are the key policy event of the week and can move yields and risk right into the Asia open.
🧾 Backlog inflation and income data: Friday’s delayed September PCE, income, and spending finally land, giving a cleaner read on the Fed’s preferred inflation gauge.
📉 Jobs and ADP midweek: ADP and weekly claims keep traders focused on labor cooling versus resilience ahead of the next full employment report.
📊 Key Data & Events (ET)
MONDAY, DEC 1
⏰ 9 45 AM
• S and P Final United States Manufacturing PMI (Nov) — prior 51.9
⏰ 10 00 AM
• ISM Manufacturing (Nov)
⏰ 8 00 PM
• Fed Chair Jerome Powell speaks
TUESDAY, DEC 2
⏰ 10 00 AM
• Fed Vice Chair for Supervision Michelle Bowman testifies
⏰ TBA
• Auto Sales (Nov) — around 16.4 million expected
WEDNESDAY, DEC 3
⏰ 8 15 AM
• ADP Employment (Nov) — expected around 42,000
⏰ 8 30 AM
• Import Price Index (Sept, delayed)
• Import Price Index excluding fuel (Sept, delayed)
⏰ 9 45 AM
• S and P Final United States Services PMI (Nov)
⏰ 10 00 AM
• ISM Services (Nov)
THURSDAY, DEC 4
⏰ 8 30 AM
• Initial Jobless Claims (week of Nov 29)
• United States Trade Deficit (Oct)
⏰ 12 00 PM
• Fed Vice Chair for Supervision Michelle Bowman speaks
FRIDAY, DEC 5 — PCE Backlog Day
⏰ 8 30 AM
• Personal Income (Sept, delayed report)
• Personal Spending (Sept, delayed report)
• PCE Price Index (Sept, delayed report)
• Core PCE Price Index (Sept, delayed report)
• PCE and Core PCE year over year (Fed’s preferred inflation gauges)
⏰ 10 00 AM
• University of Michigan Consumer Sentiment, preliminary (Dec) — around 51.0
⏰ 3 00 PM
• Consumer Credit (Oct) — prior roughly 13.1 billion
⚠️ Disclaimer: Educational and informational only — not financial advice.
📌 #SPY #SPX #trading #stocks #macro #Powell #PCE #ISM #ADP #inflation #economy #markets #investing
Nifty Short & Medium Term Support&Resistance_01-Dec to 5-Dec-25Nifty Short & Medium Term Support&Resistance_01-Dec to 5-Dec-25
Nifty 26202 (26068- Last week)
Long call ( Buy) was given six weeks before at 24896, Nifty crossed near to 1300 points.
Quarterly results of companies are released and so far it have mixed - Postive results.
Margins and revenue growth are major concern, Net profit being achieved by savings on employee cost and other savings. To be more cautious on picking the right stock and rebalance the portfolio. The stocks posted Moderate to Good Results have increased and taken the Nifty near to all time high.
Last week, 9.2% GDP growth of Q2 was released and may created a positive sign in the market depsite trade deals issues.
However overall, Tariffs deal will decide the future path till Dec - Jan for the Nifty. Since it is a Volatile situation SIP route or buy in multiple parcel route ( On Dips) with a goal of 3-5 years will workout. US Trade deal, 1st Feb budget and reforms if any will decide Nifty's path. US trade deal not being signed may create a worry for the market.
Some of the stocks to watchout given last week are Warree Energies, HDFC AMC, NMDC, Apar, Sharda Crop, VRL Logistics, krishna Phos chem, Cipla, Dr Reddy, Natco ( Buy on Dip as still there is negative trend), Apl Apollo Tubes, Muthoot Finance ( On Dips) , tata Steel ( Contra Stock due to Business Cycle), Bank of Mah, BPCL, CG Power, hero motor, shriram finance. Shared for Analysis purpose only. Dr Reddy, shriram fin, natco pharma, Hero moto corp,Muthoot Finance have already given more than 10% return in this 1 month. Add NRB Bearings to the list.
The strategy continued to be long and use the opportunity to buy on dips similar to SIP.
Current Short Term Resistance 26270 ( all time high). It need to break the resistance 26270 decisively to move up to 27000 target in med-long term. As RSI is up more than 80% for more than two weeks, room to go higher will be less in short term.
Nifty Short Term Supports ( Multiple Supports are there between 25000-25500):
26000
25670 (Jun 2025 High)
25360-25420 ( Sep high and trendline support as shown in chart)
25300-25350 (Two Fibonacci resistance shown ) - Major Support
Hence 25300- 25420 acts as major short term support.
25500 ( 25441 Sep 18th 2025 High )
25450 ( 25442 is the Aug 2025 high)
25200 ( 25154 Aug 2025 high)
25000 ( Milestone)
Short Term Resistance
1.26269 ( All time High)
2. 26500
Medium Term Support:
1.24700 (Trend Line as shown)
2. 24000-24170 (Fibonacci Retracements Supports- Two Supports in this zone 24116 & 24171 as shown)
3. 23500-23700 (Fibonacci Retracements Supports- Two Supports in this zone 23608 & 23707 as shown)
2. 23000
Medium Term Resistance:
1.27000 ( Need to decisively break 26269 all time high) This resistance is based on Fibonacci resistance at 27034
Long term resistance:
1.28000 ( Need to decisively break and move up 27000)This resistance is based on Fibonacci resistance at 28106
Long Term Support
1.22700-23000 ( Trend line and Mar 2024 High)
2.Big support at 20000 (Sep 2023 high)

SOLUSDT /// 30NOVSolana has consistently shown resilience across multiple market cycles, repeatedly demonstrating its ability to establish new price structures and reach fresh targets. Despite this long-term strength, the asset is currently under notable selling pressure. With Bitcoin experiencing a 30% decline, interest from investors and smart money toward Solana has also cooled off.
From a structural perspective, the $149 level remains a significant resistance zone, while the $127 support area appears increasingly vulnerable and may be tested or even broken in the near term.
This brings up a key question for many market participants:
Where could Solana become attractive from an investment standpoint?
In my view, the $100 region is where I would personally begin reassessing Solana for potential long-term positioning—depending, of course, on how price approaches that level and the quality of market momentum at that time.
As always, broader market conditions will play a major role in determining whether Solana can regain strength or continues to consolidate under seller dominance.

DOGEUSDT /// 30NOVThe sharp market decline on Friday, October 10th led to a significant drop of approximately 63% in Dogecoin. Currently, the market is retracing part of that daily candle. Price is trading around $0.15, and selling pressure has notably decreased; however, there is still no clear presence of strong buyers to support a sustained upward move.
For Dogecoin to potentially enter a strong bullish phase, price would need to show a sharp reaction and visible inflow of capital around the $0.11 area. A plausible scenario is that the market may reach this level either through another downward leg or after a short-term move toward the $0.18 zone, where it could face renewed selling pressure and move back down toward $0.11.
Overall, price may continue to range between $0.11 and $0.24 for several months. At the moment, there is no technical evidence on this chart suggesting a sharp rally toward the $1 level.
