GBP/JPY SELL SETUP 250 PIPS1️⃣ Macro Fundamental Analysis (GBP vs. JPY)
🔹 Interest Rate Differentials (Carry Trade Impact)
Bank of England (GBP)
The BoE has kept rates high to fight inflation.
Higher GBP rates → capital inflows into GBP assets.
Bullish for GBP/JPY.
Bank of Japan (JPY)
BoJ is still ultra-dovish, keeping negative/low interest rates.
Japan’s government wants a weak yen to support exports.
Bearish for JPY, Bullish for GBP/JPY (carry trade flows into GBP).
📊 Institutional View:
Hedge funds & large investors prefer long GBP/JPY due to high interest rate spreads.
GBP/JPY remains fundamentally bullish due to carry trade inflows.
🔹 Global Risk Sentiment (Risk-On vs. Risk-Off)
GBP/JPY is a "risk-on" pair → it rises when markets are bullish and falls when investors seek safety.
If stock markets are bullish, GBP/JPY tends to rise.
If there’s a global crisis, investors move into JPY (safe-haven), causing GBP/JPY to fall.
Current Market Sentiment:
Stock markets are uncertain, but no full risk-off move yet.
Watch equity markets & US bond yields for risk sentiment confirmation.
📊 Institutional View:
Mild risk-on bias → GBP/JPY has support, but volatility remains high.
🔹 Institutional Positioning (COT Data & Hedge Fund Flows)
Hedge funds have been buying GBP against JPY due to the rate differential.
Commitment of Traders (COT) Report:
Shows institutional investors are still net long GBP/JPY but reducing positions.
Some profit-taking could lead to short-term downside.
📊 Institutional View:
Long-term institutional bias is bullish, but hedge funds may reduce positions if risk-off sentiment increases.
2️⃣ Technical Analysis (ITPM Style) – Multi-Timeframe Breakdown
🔹 GBP/JPY (Daily Timeframe)
📈 Trend: Still in an uptrend, but approaching resistance.
📌 Key Resistance: 195.00 - 196.00
📌 Key Support: 191.00 - 190.00
🔹 Price is struggling at resistance near 194.00.
🔹 Possible pullback to 191.50 - 192.00 before resuming higher.
🔹 GBP/JPY (H4 Timeframe)
📉 Short-Term Weakness, but Still in an Uptrend Channel
📌 Key Level to Watch: 192.50 - 193.00
🔹 Bearish Rejection at 194.00, but still inside an uptrend structure.
🔹 If price breaks below 192.50, a deeper correction to 191.00 is likely.
🔹 GBP/JPY (H1 Timeframe)
📉 Intraday Weakness, Watch 192.50 for Breakdown
📌 Key Levels:
Resistance: 193.50 - 194.00
Support: 192.50 (short-term support), 191.50 (stronger support)
📊 Institutional View:
Intraday traders may take short positions below 192.50, targeting 191.50 - 191.00.
3️⃣ Institutional Trade Setup (ITPM Style)
🔴 Bearish Scenario (Short-Term Correction)
Entry: Sell below 192.50 (Break of key support).
Target: 191.50 → 190.00 (support zone).
Stop-Loss: Above 193.50.
Rationale: Short-term hedge funds taking profits → minor pullback in bullish trend.
Marketstructure

CADJPY analysis for a Sell!!!!Here’s a sell-side analysis for CAD/JPY on the 2H chart based on your updated screenshot:
⸻
Pair: CAD/JPY
Timeframe: 2H
Current Price: ~104.656
Market Bias: Short-term bearish shift from previous bullish trend
⸻
Sell Analysis Overview:
1. Bearish Structure Forming Below 105.300–105.600
• Price recently broke below a major support zone (~105.300–105.600), which is now turning into a resistance zone.
• This rejection aligns with the concept of structure flipping — previous support now acting as resistance.
• The marked “Sell Structure Forming Below” zone highlights this key area for short positions on pullbacks.
2. Multiple Rejections at 105.866
• There are clear lower highs forming, with repeated rejections around 105.866 (circled).
• Each attempt to push higher has failed, showing strong bearish pressure and exhaustion from buyers.
3. Breakdown of Key Moving Averages
• Price has closed below both the 50 EMA and 100 EMA, which are beginning to curl downward — a common signal of a trend reversal.
• Momentum has shifted, and sellers are currently in control.
4. Liquidity Grab + Breakdown
• After a false breakout to the upside, price grabbed liquidity around 105.866 and quickly reversed.
• This aligns with smart money behavior: sweeping highs before dropping — a classic bearish trap.
5. Short-Term Target Zone
• The current bearish move has a clear downside target in the 103.600–103.800 zone, which is marked as an “Area of Liquidity”.
• If this zone breaks cleanly, extended targets sit around 101.800–101.400, where fresh demand and buy structure are likely to form.
⸻
Sell Plan & Risk Management:
• Entry Idea: Wait for a pullback into the 105.300–105.600 zone to look for bearish confirmation (e.g., bearish engulfing, rejection wick).
• Stop Loss: Above 105.866 (invalidates structure)
• Take Profit Levels:
• TP1: 103.600 (liquidity zone)
• TP2: 101.800 (demand zone)
• TP3: 101.400 (long-term structure support)
⸻
Final Thoughts:
CAD/JPY is now showing early signs of a bearish trend reversal after a clean breakdown of structure and liquidity sweep at highs. As long as the price remains below 105.600, the bias remains bearish. A bounce from 104.500 could temporarily delay the drop, but deeper downside is likely if that level gives way.

Easy & Effective Multi-Timeframe Trading StrategyI show you how to use simple market structure to determine a bias, 18 period moving average to confirm trend on entry timeframe, and how to use the %R to time your entries into the market in alignment with the dominant momentum.

Bitcoin - Please Just Listen To The Charts!Bitcoin ( CRYPTO:BTCUSD ) remains in a bullish market:
Click chart above to see the detailed analysis👆🏻
Despite literally everybody freaking out about cryptos lately, big brother Bitcoin is still creating bullish market structure. During every past cycle we witnessed a correction of at least -20% before we then saw a parabolic rally. So far, Bitcoin is just doing its normal "volatility thing".
Levels to watch: 70.000, $300.000
Keep your long term vision,
Philip (BasicTrading)

AUDUSD 110 buy setup!!The current market structure shows a strong alignment for a potential upward movement, forming a double bottom at a significant support level. This pattern respects both the structural levels and Fibonacci retracement levels. With important news scheduled for release today at 8 PM, particularly positive developments for the dollar could influence market direction. Given the risk-to-reward ratio, it appears favorable to consider positioning for an upward trend.
follow me for more breakdown


Nvidia Update New levels to the downside Longs and shortsIn this video I discuss the market structure shift in Nvidia and highlight new levels to be aware of to the downside . Potential here for longs and shorts .
Tools used Fibs, Gann Square , Speed Fan , Order blocks .
Please Like and comment if you have any questions . Have a great Day and thanks for your support

VOE LONGAs you can clearly see the VOESTALPINE AG stock has found support at a key order block, aligning closely with the 50% Fibonacci retracement — a typical entry point for smart money. Since then, price action has stabilized and is starting to push higher. The declining short interest ratio suggests bearish pressure is easing, while the rising volume delta points to increasing demand. This confluence could signal accumulation and a potential continuation to the upside. Watching for further confirmation and a clean break above recent highs.
#SmartMoney #OrderBlock #VolumeDelta #Fibonacci50 #ShortSqueeze #AccumulationPhase #TradingStrategy #TechnicalAnalysis #MarketStructure #BullishSetup #PriceAction #Orderflow #SwingTrading #TradingViewIdeas

TRADE IDEAS: ES FUTURES (ESM2025) – 3/26/2025 PLAYBOOK# 📊 TRADE IDEAS: ES FUTURES (ESM2025) – 3/26/2025 PLAYBOOK
## 🟢 SCENARIO 1 (BULLISH)
**DIRECTION:** Long
**STRUCTURE BIAS:** Bullish
**ENTRY LEVEL:** 5,795-5,815 (current zone, buying sell-side liquidity raids)
**STOP LEVEL:** 5,785 (invalidate if hourly close below this level)
**TARGET LEVELS:**
- **Target 1:** 5,880-5900 (Weekly Key High Resistance Level)
**R/R RATIO:** ~3:1 (depending on final execution)
### EXECUTION STRATEGY
- **Entry Confirmation:** Look for price to raid previous unhit weekly lows (sell-side liquidity)
- **Long Entries:** Establish long positions as price successfully raids these lows but fails to sustain below them
- **Stop Placement:** Use 5,785 as a hard stop (hourly close below invalidates the trade idea)
- **Target:** Take profits at 5880 - 5,900 (Weekly Key High Resistance)
### KEY POINTS
- Current price action targeting sell-side liquidity in the form of previous unhit weekly lows
- Wednesday typically not a low/high of week formation day, suggesting potential for continued movement
- Tomorrow's High Impact News Event (GDP at 8:30 AM) likely to create volatility and could accelerate the move
- Bullish structure prevails as long as price maintains above liquidity raid zones
---
## 🔴 SCENARIO 2 (BEARISH)
**DIRECTION:** Short
**STRUCTURE BIAS:** Bearish after bullish extension
**ENTRY LEVEL:** 5,880-5910 (Weekly Key High Resistance Level)
**STOP LEVEL:** 5,9550 (invalidate if hourly close above this level)
**TARGET LEVELS:**
- **Target 1:** 5,740 (Weekly Opening Gap upper boundary)
**R/R RATIO:** ~3:1 (depending on final execution)
### EXECUTION STRATEGY
- **No Immediate Short:** Wait for price to extend to Weekly Key High Resistance Level (blue line ~5,900)
- **Rejection Confirmation:** Look for reversal candles and selling pressure at resistance
- **Short Entries:** Establish short positions once price trades below confirmation level after testing resistance
- **Stop Placement:** Use 5,925-5950 as a hard stop (hourly close above invalidates the trade idea)
- **Scaling Out:** Partial profit near 5,800, hold remaining for potential move to 5,745 area
### KEY POINTS
- After liquidity is taken at the Weekly Key High Resistance (blue line), expect manipulation and reversal
- Short opportunity emerges only after bulls exhaust momentum at key resistance
- Weekly Opening Gap (red zone) remains a significant downside target for next move
- Any sustained hourly close above 5,965 **invalidates** this bearish setup
## MARKET BIAS
- **SHORT TERM (Today – 1 Day):**
- **Bullish** bias as price is likely to find support at current levels and move toward the Weekly Key High Resistance
- Current price action suggests accumulation before a move higher
- Tomorrow's GDP numbers (8:30 AM) represent a potential catalyst for accelerated movement
- **LONGER TERM (1–2 Weeks):**
- After testing the Weekly Key High Resistance level (~5,900), expect a reversal and move back toward the Weekly Opening Gap (red zone)
- Market structure suggests a "liquidity hunt" pattern – first to the upside, then reversing to the downside
- Major liquidity draw currently at the blue line, once exhausted, focus will shift back to the Weekly Opening Gap

Cardano - Focus On This One Altcoin!Cardano ( CRYPTO:ADAUSD ) will lead the bullish rally:
Click chart above to see the detailed analysis👆🏻
It really seems to be unbelievable but Cardano is 100% repeating the previous cycle which we saw back in 2018. A double bottom neckline breakout, followed by a significant rally and another break and retest and Cardano is now clearly heading towards the previous all time high.
Levels to watch: $0.6, $2.5
Keep your long term vision,
Philip (BasicTrading)

CAD JPY Trade Setup 1 hour timeframe CAD JPY Trade Setup 1 hour timeframe
Following last week's trade setup CAD JPY is moving in an uptrend making Higher Highs and Higher Lows, so we will keep looking for Buying opportunities.
CAD JPY is forming a bullish break and retest continuation pattern that also align with the 0.618-0.50 Fib Retracement level.
Lets wait for the price to pull back to the retest level then enter base off candlestick confirmation

GBPUSD – Bearish Setup Forming | Fair Value Gap Rejection PlayThe 4H chart on GBP/USD shows a clean bearish market structure, with price currently in a corrective phase after recent downside momentum. A Fair Value Gap (FVG) has been identified between the 1.29700–1.30000 range, which acts as a key supply zone for potential short setups.
📊 Technical Breakdown
1. Fair Value Gap (FVG)
A visible imbalance was left after an aggressive bearish move—marked in the yellow zone.
Price is expected to retrace into this inefficient zone to fill orders before continuing downward.
The anticipated entry for shorts is around 1.29798, near the midpoint of the FVG.
2. Bearish Market Structure
Lower highs and lower lows dominate the current structure.
The bounce is corrective in nature and lacks momentum, indicating a potential bull trap.
Expecting a short-term retracement up to the FVG zone, followed by a continuation to the downside.
3. Target Zone
Target: 1.28042 — this level sits just above a previous demand zone, making it a natural TP1.
This area also overlaps with previous price reactions, giving it high confluence.
🧠 Trade Idea
Entry: ~1.29798 (within the FVG)
Target: 1.28042
Risk Management : A stop loss above 1.30000 or above the upper boundary of the FVG to account for false breaks.
Rationale: Risk-reward is favorable due to tight invalidation zone and strong downside continuation probability.
⚠️ Key Notes
Watch for confirmation at the FVG zone such as bearish engulfing or lower timeframe break of structure.
If price breaks above 1.3000 and holds, the idea will be invalidated.

USDJPY SELL SETUP!!From a technical perspective, examining the USD/JPY chart, we might notice that prices are forming a lower high, which often indicates a potential downtrend. The price respecting Fibonacci retracement levels can also suggest that the market is reacting to key support and resistance levels. When traders see the price approaching these levels and behaving predictably, it can bolster their confidence in the direction of their trades.
Overall, the expectation is for a continuing strength in the yen, especially if the market sentiment remains focused on potential rate hikes from the Fed. This scenario might lead to more bearish moves for the USD/JPY pair, making it important to watch for any significant economic data releases or comments from central bank officials that could signal changes in monetary policy.

BTC ZonesHere are my simplistic zones that price has been respecting and will most likely follow. Do you think Bitcoin will pull down to the support levels below?
I see price making a slight move towards the support levels then contesting resistance for new highs. Based on history, we know how crypto tends to move in these months. COINBASE:BTCUSD

AUDUSD BUY NOW 120 PipsLooking at the monthly charts, it seems like we've hit a key level where the price has bounced back up nicely. This indicates a shift in the overall trend, making it look like there's potential for some upward movement. Since the DXY (which tracks the strength of the dollar) is weakening, we might be able to ride this wave up and take advantage of the positive momentum in the market. It’s all about following the trend and going with the flow!
Risk to reward is very lovely
Follow me for your support
Thank You

USDCHF BUY NOW!!Nice wyckoff distribution, we can see price now heading higher, structure indicate buying pressure is coming in the market!!!
Nice risk to reward!!! see you later

Gold (XAUUSD) - Liquidity Grab & Potential ReversalGold has been showing interesting price action around key levels, forming a potential double top structure. The market tested the 2,930.19 resistance level, rejecting it sharply and showing signs of exhaustion.
Possible Scenario:
- Point A : Price is currently reacting from a key resistance level where liquidity is stacked.
- Point B : A potential sweep of liquidity around 2,874.04 , where price could create a demand zone before reversing.
- Point C : If buyers step in after the liquidity grab at B, we could see a rally back into the resistance zone, targeting a break of 2,930.19 .
However, if the structure breaks lower without a strong buyer reaction, further downside could come into play, possibly targeting 2,820 as the next liquidity zone.
Key Considerations:
- Monitoring fundamental catalysts such as economic data and interest rate decisions. With NFP and Fed updates this week, volatility is expected!
- Watching for confirmation of bullish intent after the liquidity grab.
- Tracking volume to gauge potential momentum.
🚀 Do you think gold will hold above 2,874.04 , or will bears take over? Drop your thoughts below! 🚀
#Tradingview
FOREXCOM:XAUUSD

3 Trades I'm Taking With My Robin Trap Set Up Right NowMe Going Over 3 Trade Ideas That Im Taking Right Now.

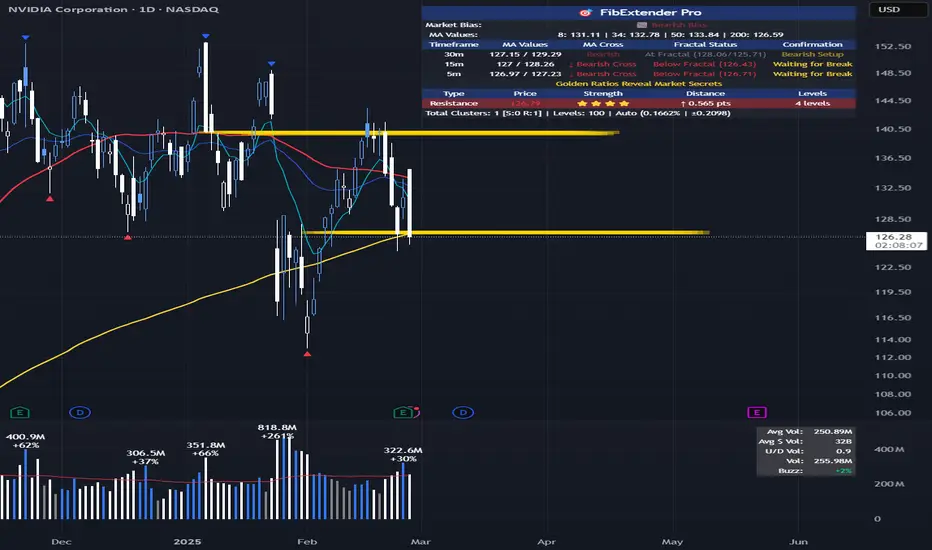
NVDA: Fibonacci cluster support and 200MA at 126.5. NASDAQ:NVDA : Fibonacci Cluster Support at 126.5 Sets Up Potential 10% Rally to 140
Looking at NVIDIA's technical setup, I've identified a critical support zone that could launch NASDAQ:NVDA toward a significant target if it holds.
Technical Analysis
The current price action shows NVIDIA testing a key support zone consisting of:
- Fibonacci cluster at 126.5
- 200 Moving Average support
If this support zone holds, I'm targeting the next Fibonacci cluster at 140, representing approximately a 10.7% upside potential.
Entry Strategy
I'm monitoring two potential entry scenarios:
Aggressive Entry (15-minute chart):
- Wait for 8 EMA to cross above 34 EMA
- Price must break above the most recent swing high
- Entry on confirmation of this break
Conservative Entry (30-minute chart):
- Same criteria as above but on the 30-minute timeframe
- Provides more reliable signals with fewer false breakouts
Risk Management
Stop Loss: Place stops below the 126.5 Fibonacci/200 MA support zone (approximately 124-125)
Profit Target: First target at the 140 Fibonacci cluster
Conflicting Indicators
My analysis shows mixed signals that require caution:
1. My WillVall indicator on the weekly chart shows a potential buy opportunity at current prices, BUT it needs to change direction and move above the 15 level before confirming a long-term entry
2. Multiple timeframe squeeze indicators (Weekly, 4D, 3D, 2D) are currently in squeeze with negative momentum, suggesting downside pressure
3. According to IBD Market School methodology, the market is showing signs of correction and the buy switch is currently OFF, indicating we should avoid new long positions
Trade Plan
Given the current market conditions and mixed signals:
- Wait for confirmation of support at the 126.5 zone
- Look for entry signal confirmation on preferred timeframe
- Use smaller position size due to conflicting indicators
- Set clear stop loss below support (124-125)
- Target the 140 Fibonacci cluster for profit taking
I'll remain patient and wait for clearer market conditions before committing significant capital to this trade. The technical setup is promising, but broader market conditions suggest caution.
Robin Trap strategy 2/27/25 Me Going Over My Funded Accounts And Challenges. And How I Use My Robin Trap Strategy To Grow Them

Tesla - Elon Is Playing The Charts!Tesla ( NASDAQ:TSLA ) is perfectly respecting structure:
Click chart above to see the detailed analysis👆🏻
Two months ago Tesla perfectly retested the previous all time high resistance and closed with a massive rejection wick. This means that a correction - which is currently happening - is expected and after the bullish break and retest, we will then finally see new all time highs.
Levels to watch: $280, $400
Keep your long term vision,
Philip (BasicTrading)

btc"🌟 Welcome to Golden Candle! 🌟
We're a team of 📈 passionate traders 📉 who love sharing our 🔍 technical analysis insights 🔎 with the TradingView community. 🌎
Our goal is to provide 💡 valuable perspectives 💡 on market trends and patterns, but 🚫 please note that our analyses are not intended as buy or sell recommendations. 🚫
Instead, they reflect our own 💭 personal attitudes and thoughts. 💭
Follow along and 📚 learn 📚 from our analyses! 📊💡"

GOLD UPCOMING TREND READ IN CAPTIONThis 4-hour chart of Gold (XAU/USD) shows a recent pullback from the resistance level at 2,920.364, with a key support zone around2,847.153, highlighted as a buy zone. Fibonacci retracement levels are also shown, with the price currently testing the 0.382 level at 2,871.969. The chart suggests a potential retest in the area between2,887.470 and $2,890.000 before a possible bounce toward higher resistance levels. The breakout above the recent high could lead to further gains, but a pullback toward support levels is expected first

AUDUSD Buy zone. After Market structure shift in 4H and Daily shift now price is taking a way down to the point of interest (liquidity zone) in this zone there is 4H liquidity engineer as well as five minute Liquidity Engineer.
The price is predicted to tap into liquidity engeneer and move to the bullish direction.
The trade can be taken directly, or one can wait for change of structure in lower time frame and enter.
I wish you all the best.
