MASK/USDT — Testing Big Support! Big Rebound or Major Breakdown?
🔎 Overall Analysis
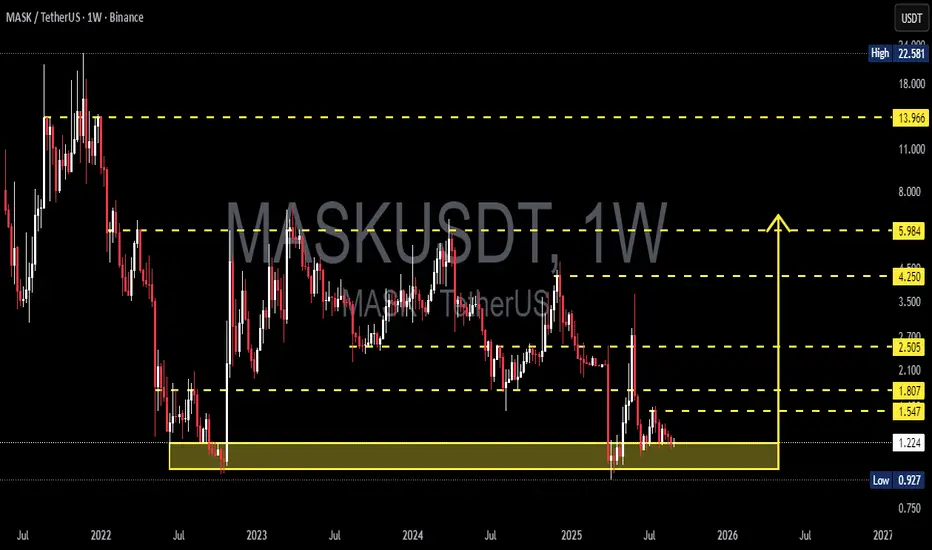
MASK is once again testing the historical support zone at 0.93 – 1.22 USDT (yellow box), an area that has repeatedly acted as a demand zone since 2022. Each time price revisited this region, it sparked strong rebounds.
However, the long-term structure remains bearish with a clear pattern of lower highs. This means that while support is strong, the broader trend is still downward unless we see a confirmed structural shift.
In short, MASK is now at a critical turning point: will this zone serve as a springboard for another rally, or will it finally give way and open the door for deeper downside?
---
📊 Key Technical Levels
Main Support Zone: 0.93 – 1.22 (yellow box).
Nearest Resistances:
1.547
1.807
2.505
4.250
5.984
13.966 (major resistance before ATH).
All-Time High: 22.58
---
🟢 Bullish Scenario
If MASK can hold above 1.22 and confirm a weekly close above 1.55–1.80, upside momentum may return.
Short-term target: 1.807.
Mid-term target: 2.505.
Long-term potential: 4.250 – 5.984 if a strong breakout occurs.
Bullish factors:
1. Historical demand zone (yellow box) has triggered multiple rebounds.
2. Noticeable volume spikes when price tests this support → sign of buyer interest.
3. Possible double bottom / accumulation base formation if price holds the zone.
---
🔴 Bearish Scenario
If MASK closes below 0.93 on the weekly chart, this support zone would break, signaling a strong bearish continuation.
The next downside levels are unclear (no major historical support below), leaving room for a capitulation move.
The bearish trend of lower highs would be further reinforced.
Bearish factors:
1. Larger trend remains down.
2. Every rally so far has ended with sharp rejections.
3. Weak buying momentum during upswings.
---
🧩 Chart Pattern Insights
Current price action shows consolidation within a demand zone — trapped between strong demand (0.93–1.22) and supply (1.55–1.80).
Repeated liquidity grabs / false breakouts (long wicks) suggest whales accumulating liquidity.
A strong base here could mark the beginning of a larger reversal — but without confirmation, it may also be distribution before a breakdown.
---
📌 Conclusion & Strategy
MASK is now at one of its most critical support levels in years.
As long as 0.93–1.22 holds, chances for a rebound remain.
Bullish confirmation requires a strong weekly close above 1.80.
A breakdown below 0.93 would open the door for further downside and potential capitulation.
👉 Best approach: wait for confirmation before committing heavily. Aggressive traders may consider small entries near support with a tight stop below 0.93.
---
#MASKUSDT #MASK #CryptoAnalysis #SupportResistance #WeeklyChart #TechnicalAnalysis #Altcoins #SwingTrading #CryptoCommunity
Maskusdtlong
MASKUSDT 1W AnalysisMASK ~ 1W Analysis
#MASK Buy back gradually from here if you still have confidence in this coin with a short term target of at least 20%+ from this support.

MASKUSDT 1W AnalysisMASK ~ 1W Analysis
#MASK This trade is very high risk Buy from here if you still have a Conviction on this coin with a short -term target of at least 20%+ from here.

MASKUSDT 30-Min Chart - Market Breakdown & Strategy📊 MASKUSDT 30-Min Chart - Market Breakdown & Strategy
Alright bro, let’s break this one down real quick. MASKUSDT is looking spicy right now. Let’s see if this setup is worth the risk or if we need to sit tight.
🔥 Market Overview
Recent Breakout & Pullback
Price pumped hard from demand zone (around 2.15 USDT) to 2.58 USDT
Multiple TPs hit during the rally—solid bullish momentum
EMA Structure
Price is currently testing EMA 20 & 50 for support
EMA 100 acting as a critical demand zone at 2.286 USDT
If it breaks below, we could see a deeper correction
Key Levels to Watch
Resistance Zone: 2.58 - 2.60 USDT (supply zone)
Support Zone: 2.30 - 2.28 USDT (demand zone)
🎯 Trading Strategy
1️⃣ Bullish Scenario (If Support Holds at EMA 100 & Demand Zone)
Entry: 2.30 - 2.28 USDT 📍
Targets (TP):
TP1: 2.38 USDT
TP2: 2.44 USDT
TP3: 2.48+ USDT
SL (Stop-Loss): 2.20 USDT
2️⃣ Bearish Scenario (If MASKUSDT Breaks Below 2.28 USDT)
Short Entry: 2.28 USDT 📉
TP Levels:
TP1: 2.22 USDT
TP2: 2.10 USDT
TP3: 2.04 USDT
SL: 2.32 USDT
⚠️ Risk Factors to Consider
If price holds EMA 100, we could see another breakout attempt—watch price action closely
If BTC dumps, altcoins like MASK will likely follow—set your stop-loss tight
Market looks choppy—trade with caution, don’t FOMO
🚀 Final Thoughts
MASK is currently at a make-or-break zone—if it holds support, we could see another leg up. But if it loses 2.28 USDT, the correction might go deeper. Trade smart, set stop-losses, and don’t overleverage.
What’s your play? You thinking long or short? 🤔

MASKUSDT 1WMASK ~ 1W Analysis
#MASK If you still have a Conviction on this coin,. Buy from here with a minimum target of 20%++

MASKUSDT 1WMASK ~ 1W
#MASK Buy gradually within this support block,. if you still have Conviction on this coin,. with a minimum target of 20%++

MASKUSDT looks weird Not too confident about it because of RR but the Chart looks weird to me and if market holds, a massive pump can happen in this pair.
Entering long DCA below 2.9200
Invalidation clean breaking below 2.8
If holds this can pull up a massive move.
Note: Not a Financial Advise.

MASKUSDT 1WMASK ~ 1W
#MASK Continuing to maintain this support block,. If you still have Conviction on this coin,. Buy gradually within this support block. with a target of at least 20%+ from here.

MASKUSDT 1WMASK ~ 1W
#MASK Continuing to maintain this support block,. If you still have Conviction on this coin,. Buy gradually within this support block. with a target of at least 20%+ from here.

MASKUSDT 1WMASK ~ 1W
#MASK If you still have Conviction on coins, buy gradually from here with a minimum target of 20%+. It is only a matter of time until this resistance line is broken

Alikze »» MASK | Bullish Wave 3 or C Scenario - 1W🔍 Technical analysis: Bullish Wave 3 or C Scenario - 1W
📣 BINANCE:MASKUSDT It is moving in a descending channel on the weekly time frame, which faced selling pressure after a movement cycle in the $7 range and made a zigzag correction to the $1.5 range.
🟢 Currently, due to the upward momentum and movement to the middle area of the channel and the short-term correction, it is again in the supply area with an increase in buyers.
🟢 In the event of a negative reaction in the supply area, it can break the first supply area towards the second supply area with a pullback to the green box area.
💎 Considering the previous movement lag and the second zigzag correction, this movement path can have a 3 or C wave rally up to the marked red box area.
⚠️ In addition, the price should not enter the LVL Invalidation range due to the movement lag. Therefore, any price correction can end up to the 3.12 range, and the consolidation above the area strengthens the bullish scenario .⚠️
»»»«««»»»«««»»»«««
Please support this idea 💡 with a LIKE 👍 and COMMENT 💬 if you find it useful and Click "Follow" on our profile if you'd like these trade ideas delivered straight to your email 📧 in the future.
🙏Thanks for your continued support.
Best Regards,❤️
Alikze.
»»»«««»»»«««»»»«««

MASKUSDT 1WMASK ~ 1W
#MASK This chart is very interesting. If you are interested,. You can start buying on this support block. Buy in stages. with a minimum target of 20%++

#MASK 5 $ EXIT PUMP Loading#MASK 5 $ EXIT PUMP Loading. .And then it may crash badly.
In crypto, always follow the trend. You should invest in new and trending tokens or those tokens that have a real use case. More than 90% of crypto's future is likely to be zero.

Maskusdt High Risk LongAlready in a swing long from lows.
But from here again Leverage longed 3.199
Stoploss 3.175
High Risk High Reward.
Targeting 3.650
Note: Not a Financial Advise.

$MASK 10x opportunity?The structure of the chart leads me to believe that we could see a large drop down to the lower support before the move higher gets started.
If we do get down to the lower support, then I think there's a 10x long opportunity up to the resistance in the $20s.
Let's see how it plays out over the coming weeks.


NASK 15MIN BULLISH AS IT IS AT SUPPORT#MASK rejected from the Trendline on 15min Time frame, now bounced back from the support zone, we expect pump after breakout 🚀
TARGETS 3.80, 4.40, 5.00, 5.40
This analysis invalids below 3.35

Mask USDT Ready for Lift-Off! Hey Guys! 👋
Check out the Mask chart – I'm seeing some serious potential for an upward surge, possibly aiming for $7 (or even more) in the near future.
Given the sway of BTC dominance and its unpredictable moves, there might be a slight dip before the big climb. If that happens, keep an eye on the sweet buy zone between $3.15 and $2.99. Personally, I'm diving in now and ready to buy more if we see a drop.
Consider the upward white trend as an additional target.
Remember the drill: DCA is crucial, and never go all in at once. Patience is key.
📊 Targets are marked on the chart with red lines for your reference. But as always, DYOR (Do Your Own Research) before making moves.
⚠️ Quick reminder: This is not financial advice. Trade wisely, and best of luck on your trading journey! 🌟

MASK/USDT Anticipating a Bullish Break? 👀 🚀Mask Today analysis
💎 Paradisers, let's turn our focus to #MASKUSDT, which is currently demonstrating a compelling pattern. It's making strides to break through a supply level, suggesting a strong possibility of a bullish move following this breakout.
💎 $MASK has consistently shown a pattern of following a descending channel, breaking above it to initiate an upward trajectory. Presently, it is trading within a range and is actively attempting to surpass the supply level of 3.871. Once it successfully breaks this level, there's a substantial chance for a bullish movement. With continued upward momentum, #Mask is setting its sights on reaching higher supply levels, potentially up to $4.881.
💎 For the sagacious Paradisers, timing is key in making the most of this situation. Identifying optimal entry points during this anticipated rise is essential, as well as being cautious not to enter at the peak of the market. Moreover, be prepared for a potential bullish rebound from the support level of $3.02. Nonetheless, a drop below this support level could indicate challenges in maintaining a bullish trend.
💎 In this fluid and evolving market environment, strategic thinking and effective decision-making are crucial. Developing a comprehensive trading strategy, which includes sound money management and a thorough understanding of support and resistance levels, is vital to achieving successful trading results. 🌴💰

MASKUSDT - Buy Opportunity!MASKUSDT (1D Chart) Technical analysis
MASKUSDT (1D Chart) Currently trading at $3
Buy level: Above $2.93
Stop loss: Below $2.42
TP1: $3.4
TP2: $4
TP3: $4.7
TP4: $6
Max Leverage 2x
Always keep Stop loss
Follow Our Tradingview Account for More Technical Analysis Updates, | Like, Share and Comment Your thoughts

MASKUSDTTRADE ALERT! $MASK
Ticker: MASK/USDT
Entry: $3.57-3.68
Take Profit: $4.48
Stop Loss: $3.169 (Daily Close Below this)
Risk to Reward: 1:2
Technical: A robust support is evident around the $3.681 mark. Once the price surpasses this level, there is a potential for a subsequent move to test the range between $4 and $4.48.

MASKUSDHey i have spend lot of time to analyze MASK here is what i noticed that mask is in Long long Distribution Wyckoff period which looks like it is about tp get in phase C

MASK Next Support & ResistanceMASK Next Support & Resistance
1.948005048
2.627900761
2.925311398
3.480395178
4.039449313
5.181228837
