Polygon (MATIC) - October 15Hello?
Welcome, traders.
By "following", you can always get new information quickly.
Please also click "Boost".
Have a good day.
-------------------------------------
(MATICUSDT 1W Chart)
The key is whether it can support and move up in the 0.6104-0.8191 section.
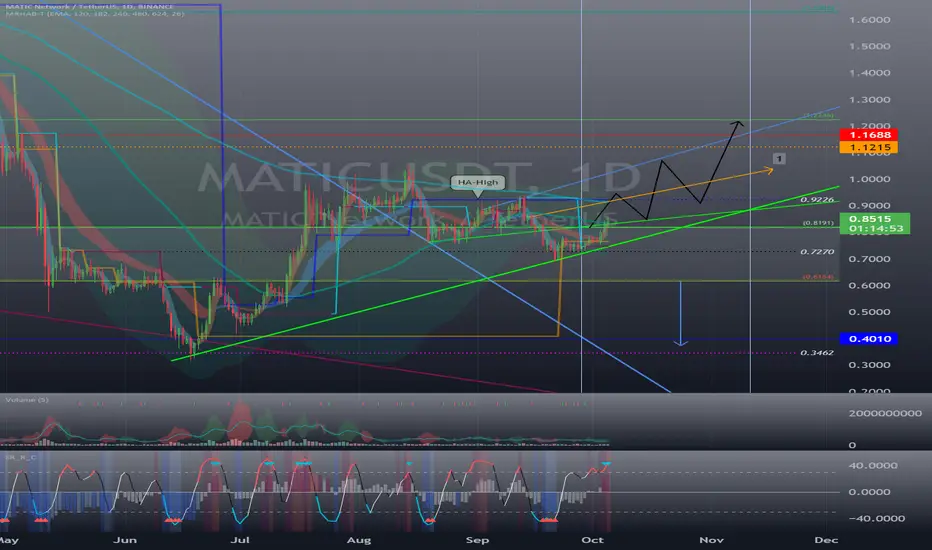
(1D chart)
If we see a drop below the uptrend line (1), we need to see if there is support in the 0.7270-0.7658 range.
Otherwise, it is expected to decline to around 0.6164.
It needs to move above 0.9226 to continue the uptrend.
So, the key is whether we can find support and move higher near 0.8191.
------------------------------------------------------------ -------------------------------------------
** All descriptions are for reference only and do not guarantee a profit or loss in investment.
** If you share this chart, you can use the indicators normally.
** The MRHAB-T indicator contains indicators that indicate support and resistance points.
** HA SRRC indicators are expressed as StochRSI(line), RSI(columns), CCI(bgcolor).
** CCI indicator is expressed as overbought range (CCI > +100) and oversold range (CCI < -100).
(Short-term Stop Loss can be said to be a point where profit and loss can be preserved or additional entry can be made through split trading. It is a short-term investment perspective.)
---------------------------------
Maticusd

🟢 MATICUSDT - 1D (22.09.2022)🟢 MATIC USDT
TF: 1D
Side: Long
Pattern: Falling Wedge
SL: $0.690402 (keep it tight on this one)
TP 1: $0.7762776
TP 2: $0.829401
Nice falling wedge bounce wick forming here.
You can enter tomorrow if the wick remains for confirmation and watch it possibly play out over the weekend and maybe in to Monday.

Polygon MATIC - Bullish flag! A huge breakout is imminent.
Matic is preparing for a huge uptrend if the bulls break the bullish flag. It's a pretty good opportunity, so you don't want to miss it!
The bullish flag on the daily chart is supported by an ABC correction (ZigZag), so it makes the bullish flag much stronger.
Also, we have started this uptrend with a strong impulse wave, which indicates massive buying pressure from the bulls.
The next resistance is at the top of the massive parallel channel on the weekly chart. You can zoom out this chart to see this channel in all its full beauty.
I strongly recommend waiting for a breakout above the flag, because, of course, the bears can step in at the resistance of the downward trendline.
Polygon effectively transforms Ethereum into a full-fledged multi-chain system (aka Internet of Blockchains). This multi-chain system is akin to other ones such as Polkadot, Cosmos, Avalanche etc. with the advantages of Ethereum’s security, vibrant ecosystem and openness.
This is a pretty strong setup for the bulls. Let me know in the comment section what you think about MATIC.
I expect tremendous gains for selected altcoins. You can find them in the related section down below.
For more analysis, hit "Like" and "Follow"!

✅TS ❕ MATICUSD: rebounded strongl✅✅ MATIC rebounded strongly from the resistance level.
The price has reached an important support level.
A rebound is possible, after which we can expect a continuation of the fall.✅
🚀 SELL scenario: short to 0.7.🚀
----------------------------------------------------------------------------
Remember, there is no place for luck in trading - only strategy!
Thanks for the likes and comments.

✅TS ❕ MATICUSD: bounced off✅✅ MATIC bounced off the resistance level for the second time.
A double vertex has formed.
The price is still in a downtrend, I expect the fall to continue.✅
🚀 SELL scenario: short to 0.733.🚀
----------------------------------------------------------------------------
Remember, there is no place for luck in trading - only strategy!
Thanks for the likes and comments.

✅TS ❕ MATICUSD: resistance level✅✅ MATIC bounced off the resistance level.
The price has formed several peaks.
I expect the fall to continue.✅
🚀 SELL scenario: short to 0.733.🚀
----------------------------------------------------------------------------
Remember, there is no place for luck in trading - only strategy!
Thanks for the likes and comments.

Polygon MATIC Strong Support LinePolygon MATIC is now at a strong support line from which i expect a rebound to the following price targets:
MATIC/USDT
Entry Range: $0.80 - 0.85
Take Profit 1: $0.95
Take Profit 2: $1.05
Take Profit 3: $1.17
Stop Loss: $0.69

MATIC - Double BottomA bullflag breakdown into a double bottom is evident in early price evolution
This seems to be happening again with a bullflag being present, all that's needed now is a small breakdown and from there it is lift off as per the bullish double bottom pattern
Daily Chart
Posting some of my previous MATIC analyses

MATIC will fail to breakoutBTC is doing it's thing today bringing waves to the whole market.
personally i dont believe it will last.
the 20150 is well defended for btc.
Matic is over extended here facing a huge resistance.
i will short it here at 0.843 with 50% of the position and i will set another short order at 0.8590 giving me an average price of 0.85
stop loss if 4hour candle closes above 0.862 which is 1.4% (4.2%) risk.
first target is 0.81. about 5% (15% with lever)
i will update for another target if we get to this point
i will dare to use 3x leverage

✅TS ❕ MATICUSD: important resistance✅✅ MATIC has reached an important resistance level and has already bounced down.
The price is directed downwards and has already formed several lows.
I expect the downward movement to continue.✅
🚀 SELL scenario: short to 0.733.🚀
----------------------------------------------------------------------------
Remember, there is no place for luck in trading - only strategy!
Thanks for the likes and comments.

MATIC/USDT Looks Bullish on 4h ChartMATIC/USDT Looks Bullish on 4h Chart
Took out the low and now trying to recover back above the support🧐
Bull if does so📈
Follow me For daily chart analysis :
MATIC/USDT
#MATIC/USDT
#maticusdt
#long
#bull
#bullish
#longpostion

MATIC is READYBeautfully retraced right on 1.272 on 3 waves since the last analysis in august (). Count slightly adjusted.
Ready to get that 4.236/8.236
Hold my beer pls
----
No financial advice, do your own research, don't be stupid

Polygon (MATIC) - October 6Hello?
Welcome, traders.
By "following", you can always get new information quickly.
Please also click "Boost".
Have a good day.
-------------------------------------
(MATICUSDT 1W Chart)
The 0.6164-0.8191 interval is the interval that determines the trend.
Therefore, it is likely that the trend will continue in the direction off the 0.6164-0.8191 range.
Therefore, if the price holds above 0.8191, it is expected to move towards 1.2246.
(1D chart)
In order to continue the upward trend, it must rise above the HA-High indicator.
Therefore, the key is whether it can rise above 0.9226 and find support.
If it falls below 0.8191, we need to see if there is support in the 0.6164-0.7270 range.
------------------------------------------------------------ -------------------------------------------
** All descriptions are for reference only and do not guarantee a profit or loss in investment.
** If you share this chart, you can use the indicators normally.
** The MRHAB-T indicator contains indicators that indicate support and resistance points.
** SR_R_C indicators are displayed as StochRSI(line), RSI(columns), CCI(bgcolor).
** CCI indicator is expressed as overbought range (CCI > +100) and oversold range (CCI < -100).
(Short-term Stop Loss can be said to be a point where profit and loss can be preserved or additional entry can be made through split trading. It is a short-term investment perspective.)
---------------------------------
MATIC is near resistance. What's next?Hello, dear TradingView members.
This is a MATIC idea.
MATIC pumped about 10% since yesterday and then got rejected by the static resistance area.
Two support levels are on the way down to help keep the price up. And two resistance levels on the way up are robust due to our channel's dynamic roof, which also acts as an extreme resistance.
We might see some short-term uptrend for MATIC, but I suggest holding on and not opening long positions because the market can decline when the price nears the dynamic resistance level.
We have two possible scenarios in front of us.
Scenario One:
The price will touch the support level and go back for a retest.
Scenario Two:
The price will continue sideways until it loses strength and falls on our lower support areas.
RSI is neutral, and the price has more room to go down or up.
Now let's see your ideas. Let's have a discussion.
Let me know if you guys have any questions;
I will be more than happy to help.
Good luck, and thank you.

✅TS ❕ MATICUSD: reached the resistance✅✅MATIC has reached the resistance level and even passed it.
It is quite possible to move a little higher, after which I expect a reversal.✅
🚀 SELL scenario: short to 0.733.🚀
----------------------------------------------------------------------------
Remember, there is no place for luck in trading - only strategy!
Thanks for the likes and comments.


Possible MATIC Bear Flag continuation Thoughts on this one? There is heavy resistance at approx the $0.8 area

$0.32 MATIC testing yearly June lows?Will MATIC retest $0.32 which was the 2022 June lows, BTC looking to correct so...

MATIC Descending Scallop 4H Starting with a clean chart...
A look at the weekly shows an extended V bottom, the V bottom is often seen as a recovery formation. Should the price fall below $0.52 I consider the formation eliminated. With the "extended" V bottom, the sideways (extended) consolidation phase serves as a pause and often resembles the shape of a channel or bull flag .
I zoom in on the daily timeframe and also notice there in the tip of the V shape also a Smaller version of this Extended V Bottom Formation. On this timeframe we also find the zones where I expect possible resistance/support. And the Flip zone is an important one. Here the bulls need to claim the zone in order to stomp through.
Also note that the MA50 and MA200 are already approaching each other and if they cross bullish , its gonna be an Golden Cross where the Death cross took place in early March and the previous Golden Cross in early January 2021. Or in other words that moment could be a bullish moment.
On the 4 hours I mark the price by means of a Descending Scallop and in the background I have also drawn the Descending broadening wedge where the resistance line has been tested as a support line. in case of a breakout on the formation and a re-test, the price targets are mentioned. Also be sure to keep the big picture in mind there is still plenty of room towards the $0.23 mark.
Keep calm, Do your own research! trade safe and manage your risk.
(Disclaimer: This is not financial advice)

MATIC Extended V Bottom 1DStarting with a clean chart...
A look at the weekly shows an extended V bottom, the V bottom is often seen as a recovery formation. Should the price fall below $0.52 I consider the formation eliminated. With the "extended" V bottom, the sideways (extended) consolidation phase serves as a pause and often resembles the shape of a channel or bull flag .
I zoom in on the daily timeframe and also notice there in the tip of the V shape also a Smaller version of this Extended V Bottom Formation. On this timeframe we also find the zones where I expect possible resistance/support. And the Flip zone is an important one. Here the bulls need to claim the zone in order to stomp through.
Also note that the MA50 and MA200 are already approaching each other and if they cross bullish , its gonna be an Golden Cross where the Death cross took place in early March and the previous Golden Cross in early January 2021. Or in other words that moment could be a bullish moment.
On the 4 hours I mark the price by means of a Descending Scallop and in the background I have also drawn the Descending broadening wedge where the resistance line has been tested as a support line. in case of a breakout on the formation and a re-test, the price targets are mentioned. Also be sure to keep the big picture in mind there is still plenty of room towards the $0.23 mark.
Keep calm, Do your own research! trade safe and manage your risk.
(Disclaimer: This is not financial advice)

MATIC Extended V Bottom 1WStarting with a clean chart...
A look at the weekly shows an extended V bottom, the V bottom is often seen as a recovery formation. Should the price fall below $0.52 I consider the formation eliminated. With the "extended" V bottom, the sideways (extended) consolidation phase serves as a pause and often resembles the shape of a channel or bull flag.
I zoom in on the daily timeframe and also notice there in the tip of the V shape also a Smaller version of this Extended V Bottom Formation. On this timeframe we also find the zones where I expect possible resistance/support. And the Flip zone is an important one. Here the bulls need to claim the zone in order to stomp through.
Also note that the MA50 and MA200 are already approaching each other and if they cross bullish, its gonna be an Golden Cross where the Death cross took place in early March and the previous Golden Cross in early January 2021. Or in other words that moment could be a bullish moment.
On the 4 hours I mark the price by means of a Descending Scallop and in the background I have also drawn the Descending broadening wedge where the resistance line has been tested as a support line. in case of a breakout on the formation and a re-test, the price targets are mentioned. Also be sure to keep the big picture in mind there is still plenty of room towards the $0.23 mark.
Keep calm, Do your own research! trade safe and manage your risk.
(Disclaimer: This is not financial advice)

✅TS ❕ MATICUSD: strong downtrend✅✅MATIC has formed several minima.
Now the price has reached the support level again, from which a rebound is possible.✅
🚀 BUY scenario: long to 0.811.🚀
----------------------------------------------------------------------------
Remember, there is no place for luck in trading - only strategy!
Thanks for the likes and comments.

MATICUSDT Market Update 28/09/2022MATIC formed inverse head and shoulder and traded near to its neckline. Here we have to keep an eye on a successful breakout of the neckline, which will confirm its bullish move towards the upper marked resistance levels.
If MATIC loses strength and lost its right shoulder path then that would be a sign of another leg down in MATIC. Some further price action will confirm its direction.
