MATIC-USDT / 1H / TECHNICAL ANALYSIS BINANCE:MATICUSDT Resistance at 0.8080, support at 0.7389. My target for wave analysis is 0.7983.
Like and comment if you find value in our analysis.
Feel free to post your ideas and questions at the comments section.
Good luck
Maticusd

Matic with Head & Shoulder patern In the 4h chart it rebounded after broke down the neckline of the H&S pattern
But it broke down the triangle in the 4h and we can set the SL at (0.7379) to get better R/R
TP1: 0.6170
TP2: 0.5755
TP3: 0.5311
TP4: 0.4867
TP5: 0.3428

MATICUSDTI propose to consider the medium-term situation, because in the short term everything looks bad. A symmetrical triangle figure appeared on the chart. The price can go both up and down with a 50/50 chance.
In case of an upward movement and consolidation, it is worth considering the targets indicated by blue lines.
Target 1 - 1.1517
Target 2 - 1.3871
Target 3 - 1.5898
In case of going down and consolidating below, focus on the red lines as support in the area of 0.4007 - 0.2334
Also you can ask for only 1 altcoins analysis and i will try to do my best to cover as much as i can✍️

#MATIC #Polygon #Final #Update 'B' #Wychoff #Distribution #Eddy#MATIC #Polygon #Final #Update 'B' #Wychoff #Distribution #Eddy
We Are Here Guys <3 Enjoy ;-)
This is a new update of final (( MATIC/USDT )) update: check link :

3- entry (MATIC)📊Analysis by AhmadArz:
safe in chart risk by 3-entry.
🔗"Uncover new opportunities in the world of cryptocurrencies with AhmadArz.
💡Join us on TradingView and expand your investment knowledge with our five years of experience in financial markets."
🚀Please boost and💬 comment to share your thoughts with us!

MATICUSDT Buy stopWe observe the third head and shoulders pattern on the Matic H1 chart. If the price breaks the 0.8888 level, the pattern will be confirmed. Risk-reward ratio is 1:2

#MATIC #Polygon #Final #Update #Wychoff #Distribution #Eddy#MATIC #Polygon #Final #Update #Wychoff #Distribution #Eddy
(("All the relevant areas and explanations on the chart are clear and clear, the trading setups need to get confirmation to enter, if you don't know how to get a trigger and confirm entering into transactions, this analysis is not suitable for you, the above analysis is for professionals. and if you are a beginner, my suggestion is that you don't destroy your capital and first learn technical analysis and basic trading along with psychology and risk and capital management from reputable sources and courses, and then enter the financial markets."))
(("The above analysis and setups and points and areas are combined with most of the combined styles such as price action, supply and demand, RTM, ICT and also with the analysis of important indicators such as Dominance Tether and Bitcoin.
If you are familiar with the mentioned styles and know how to get approval to enter the above styles, use the above analysis.
This is not an investment proposal and only my opinion, please act based on your experience and decisions."))
~~~~~~~~~~~~~~~~~~~~~~~~~~~~~~~~~~~~~~~~~~
I also suggest you to view my #Analysis of the Phases of Richard #Wyckoff #Accumulation & #Distribution on #Bitcoin #Currency from the link below :
~~~~~~~~~~~~~~~~~~~~~~~~~~~~~~~~~~~~~~~~~~
Analyses of Trading Ranges By : Dr. #Eddy SunShine 👨🏻💻 1/14/2024 ❤️

maticusdtMatic analysis:
The price has already tested the support area. You can consider taking a small long position there with a tight stop loss. If the price does not close below the support level, we may expect a bounce from there. Our we can buy it with dca strategy at major support area and holding it .
Local Support Area : $0.68-$0.735
Major support area :
$0.49-$0.53
Resistance Area : $0.90-$0.92
Major resistance area ;
$1-$1.1

MATICUSD - Monthly Bullish DivergenceAn example of a bullish divergence in which price prints a higher low while the RSI indicator on this Monthly timeframe prints a lower low. This is a sign that upward movement is to come.

Matic is going to pump around 1000%! just buy it hereSee the video, Everything is explained there. As you can see in the analyze we expect a huge pump for MATIC in the coming month.

MATIC/USDT 4H LONG BULLISH IDEAMATIC has been consolidating near 1.00 range for a week and forming bullish structure. Huge bullish move is incoming in few days.

MATIC - Wyckoff Reaccumulation Schematic#MATIC
This looked like a simple flag initially, which is a great bullish continuation pattern, but since has evolved into a #Wyckoff Reaccumulation Schematic. The latter is actually a healthier option, and one which usually warrants less pullbacks vs the simple flag, that very often comes with sharp retraces.
The Volume is perfect, the OBV is perfect, the pattern is perfect, the timing during Trad Fi market close and end of year standard low volume is perfect...
Have you placed your bets?

MATICUSDT Symmetrical TriangleMATICUSDT is showing a Symmetrical Triangle currently breaking out and has now retested support.
On the other hand we've got MATICBTC on the relative low with an inverse head and shoulders pending bull break. Which further aligns with my MATICUSDT thesis.

Short time frame Falling wedge on #MATICAs you are aware if u follow me
Matic is quite bullish on the big time frames.
& I expect it to exceed it's 2021 All time High
No mean feat for an Alt coin!
So when u spot bullish structures on the lower time frames
Could be a good idea to position yourself for upside
:) NFA

In secend renge (MATIC)❤️❤️Thanks for boosting 🚀 and supporting us!
📈againe test to break-even renge
📊 (Entry) : 0.828
🔴 Stop Loss : 0.811
🎯 Take Profit : 0.846-0.864-0.876
🔗 For more communication with us, In the footnote and send a message in TradingView.
👨🎓 Experience and Education: Our trading team has five years of experience in financial markets, especially cryptocurrencies.

Buy on MATIC, Triangle strategy Buying on a pullback to a flag that has broken the triangle can be a good opportunity to buy
R/R=1.6

MATIC - A Simple Flag#MATIC
This Simple Flag following the breakout with volume is exactly what we want to see.
If one large and full body candle had large volume and a #doji that had more couldn't retrace any distance to speak of, do you think up or down has more pressure pushing it ATM...?

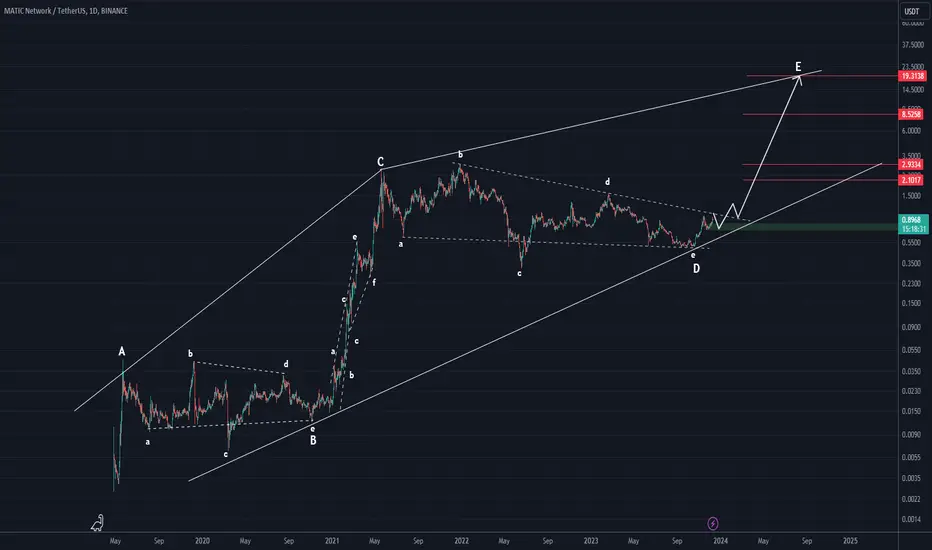
MATIC ROADMAP (1D TF)We seem to be in a large diametric whose wave D is coming to an end. This wave D looks like a triangle. Upon further investigation, we can see that we are now in wave e of d.
This scenario is confirmed by breaking the upper side of the triangle.
Note: This is a long-term vision and we will have many fluctuations along the way.
MATICUSD One more correction left before going parabolic!It has been a little over 2 months since our last analysis on Polygon (MATICUSD), which eventually hit our 0.7000 target (see chart below) and has now broken above the 1W MA100 (green trend-line) for the first time since March 13 2023:
As you can see on this 1W time-frame, we are about to get a Bullish Cross between the 1W MA50 (blue trend-line) and the 1W MA100. That will be the first in MATIC history but we do not expect it to create the conditions for an immediate rally. Based on the same long Accumulation Phase of the previous Cycle, the rally started after the price broke below the 1W MA50 one last time.
Once that happens, we will turn bullish on MATIC again for the long term and target the 2.0 Fibonacci extension at 5.000.
-------------------------------------------------------------------------------
** Please LIKE 👍, FOLLOW ✅, SHARE 🙌 and COMMENT ✍ if you enjoy this idea! Also share your ideas and charts in the comments section below! This is best way to keep it relevant, support us, keep the content here free and allow the idea to reach as many people as possible. **
-------------------------------------------------------------------------------
💸💸💸💸💸💸
👇 👇 👇 👇 👇 👇

Matic - Falling wedge as part of a bigger patternBut for the short term I'm looking for it to pop 10-15c
Which is a healthy 20% move
The bigger breakout is getting past the 98 cents level
Which could see a quick move to a $1.25

The Exit of $MATIC From Symmetrical Triangle is ConfirmedHello guys,
Well, after a long struggle with 100WMA, CRYPTOCAP:MATIC is finally breaking through this resistance to exit the upper side of the Symmetrical Triangle. Based on this, I predict three targets for CRYPTOCAP:MATIC :
🪙 MATIC/USDT
💹 Binance
🧮 Spot
🛒 Entry
🟢 Market Price < 1.0000
💵 Targets
🔴 $1.1525
🔴 $1.4045
🔴 $1.6766
⛔️ SL $0.6903
📅 26/12/2023
As always, this is not a financial advice & please do your own research.
"Boost" & "Follow" if you want to see more of these ideas.
Goodluck

MATIC - Probably Nothing...#MATIC
As noted before, the rocket fuel has now been loaded at the LPS (Last Point of Supply).
Now it's time, Number go up...

$MATIC in Conflict With 100WMA to Start a New Uptrend Hi everyone,
We are in the CRYPTOCAP:MATIC weekly chart and as you can see, CRYPTOCAP:MATIC has fluctuated in a beautiful Symmetrical Triangle since registering a new ATH. Also, during recent weeks, CRYPTOCAP:MATIC has been engaged in consolidation, which has caused it to register some lower highs in this triangle and convince us that it will soon exit from the upper side of this triangle.
In the lower part of the chart, we can see that CRYPTOCAP:MATIC has formed a strong support area in the range of 50 cents. Currently, the 100WMA resistance is considered as the only factor preventing CRYPTOCAP:MATIC from exiting this triangle. If CRYPTOCAP:MATIC can cross the 100WMA barrier, it will simultaneously exit this boring triangle and start a new uptrend.
But if CRYPTOCAP:MATIC cannot cross the 100WMA barrier for any reason, then we will see it fall back to the bottom of the triangle and record some higher lows. Anyway we will wait for the next events of the crypto market and confirmation of the trend.
As always this is not a financial advice & please do your own research.
"Like" & "Follow" if you want to see more of these ideas.
Goodluck
