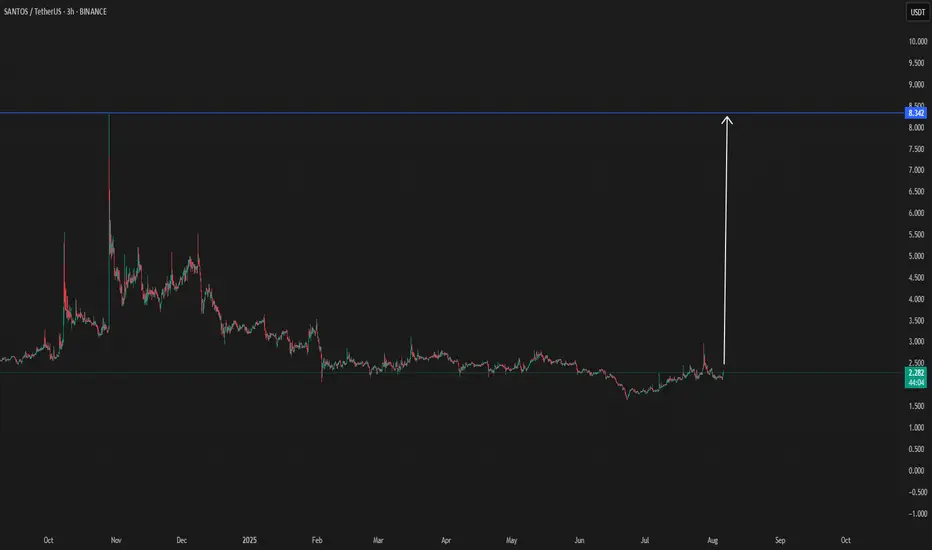
Will Neymar Break Out the Price Action of Santos To the moon.
Neymar did return to Santos, the energy around the club has exploded.
He has: 📸 Instagram: approximately 231.4 million followers
🐦 Twitter (X): approximately 64 million followers
🔥 Fan engagement is surging: Social media growth, merchandise sales, and matchday hype have all increased.
⚽️ On-field performance is matching the hype:
In their last match, Santos won 3–1, with Neymar scoring 2 goals, reminding fans of his legendary form.
📅 Next match this Sunday could further drive visibility and excitement — both for fans and investors.
💰 What’s Driving the Coin's Value?
The Santos fan token isn’t just hype — it has real utility:
🎟️ Buy match tickets using the token.
🛍️ Purchase merchandise directly from the official club store.
🗳️ Participate in fan votes and club decisions.
📈 Outlook: Can We Hit $4.60?
With Neymar back, the spotlight is back on Santos. As attention increases:
⚡️ Demand for the token may spike.
💎 Whales and fans alike are accumulating.
📊 The chart shows strong potential for a break, and $4.60 could be the next big target if momentum holds.
👉 Stay tuned. Santos might just be going to the moon, and next break can be $4.60
Next match is Sunday with Neymar.
MEME

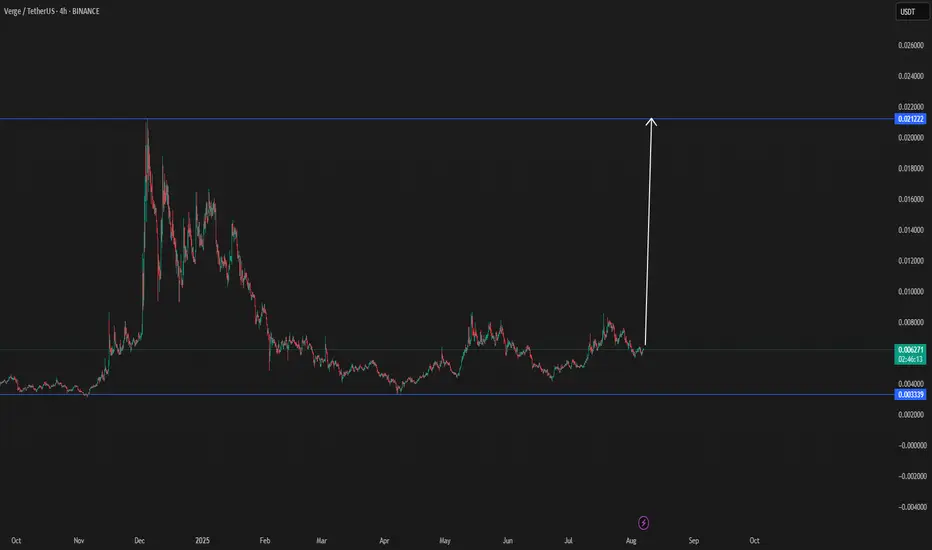
XVG (VERGE) BACK TO OLD TIMES up $0,01There is new data that shows an increase in interest of the verge increase.
This could mean a new return to the up $0,01 price action
I did expect before the floki increase from start to end, and expecting verge to taking the same way.
Last break was able to do in 2 days and 16H
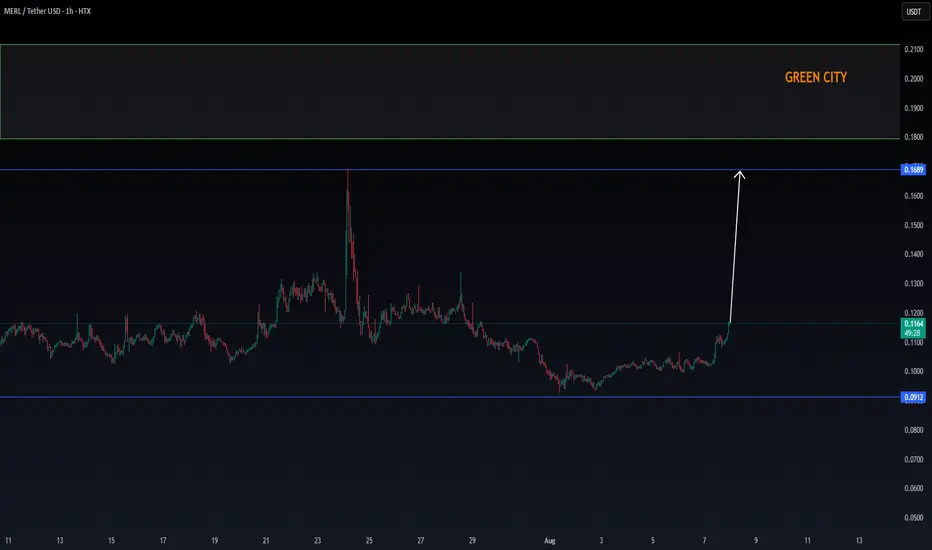
MERL/USDT UPCOMING VOLUME + BREAK effectMERL is coming with a new volume, which can be confirmed in the coming time frames with a break.
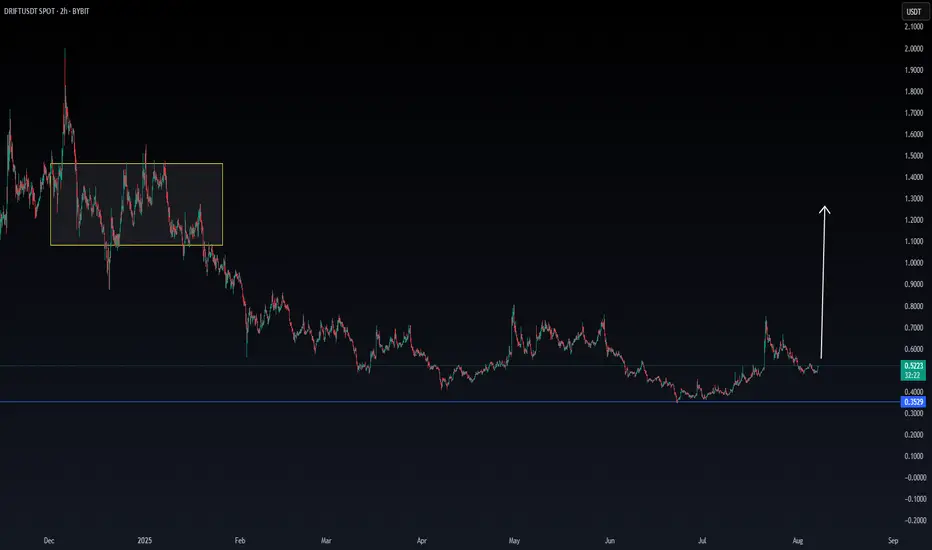
DRIFT/USDT Starting the engine to moonDrift seems to have a new upcoming volume, which can be confirmed in the coming hours.
Will follow Drift for more confirmations.
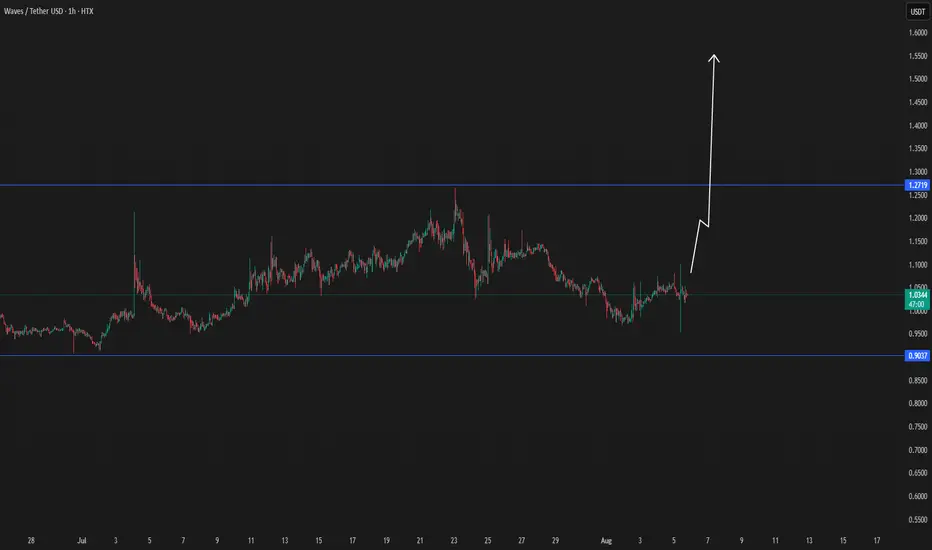
WAVES/USDT BREAK 3.0There is good chance for wave break and focus goes there to check it in the coming time frames.
SOLANA's Situation, A Comprehensive Analysis !!!The price on the 3d timeframe is within an ascending triangle, which can be promising. If the price breaks this pattern with bullish candles, it could easily rise by the distance of AB=CD .
Best regards CobraVanguard.💚

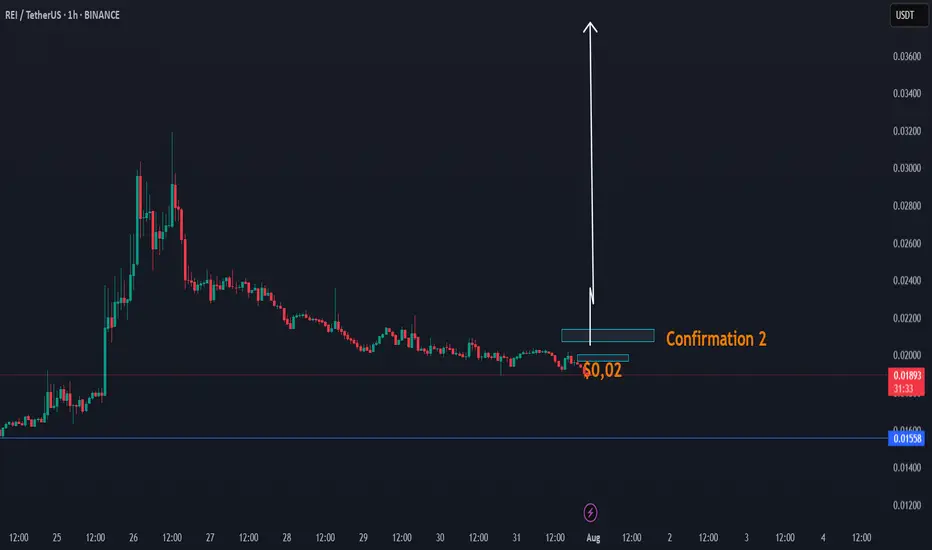
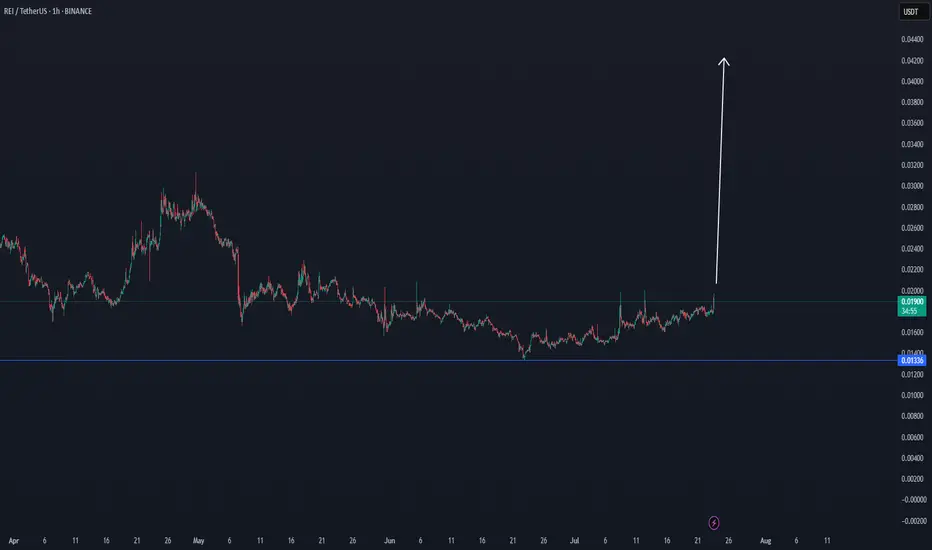
DAY UPDATE REI/USDT THE INCREASE CANDLE OF UP $0,03 - $0,05REI is an interesting coin since the update of Q4
We have seen that this coin was able to increase to $0,031 and until here $0,018 zone, a return to where we are now. There is a high chance that this coin can recover next 24H if this coin is able to confirm the confirmation $0,02 - $0,021
This coin, as before, was targeted at $ 0.02 and had low volume. We expect that if it comes back to $ 0.02, it will be confirmation of the volume, which can take the trend with a candle to up $0,03
REI CONFIRMATIONS ZONE
Higher time frame
When you look normally at this coin, then this coin is in a trend line of breakdown. This can change with the next confirmations. The question is, are we going to see again $0,02 the next 24h? If yes high chance of a break.
We also have a cycle update 2025, check it here, expecting $0,90
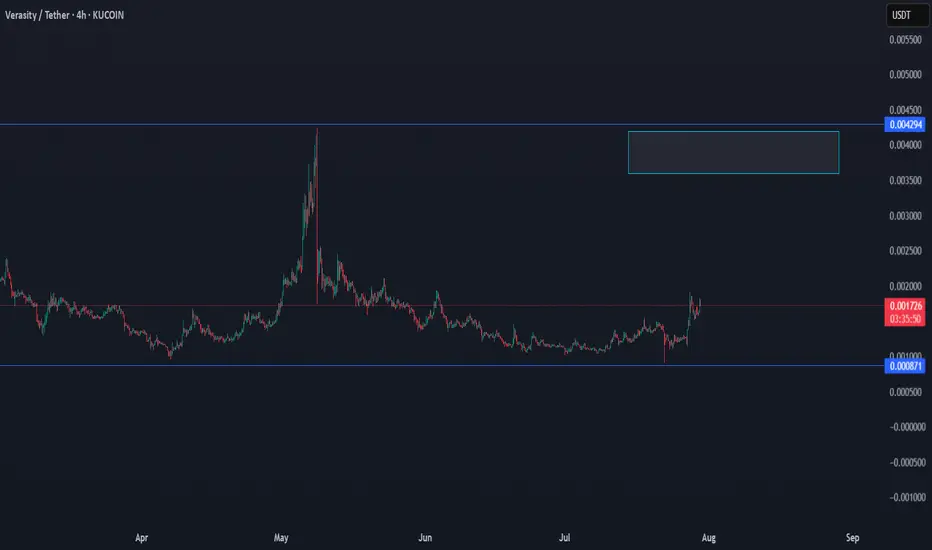
VRA/USDT THE RETURN TO KEY LEVELVra has good chance to return to the key level, since the last data shows a growth in the volume.
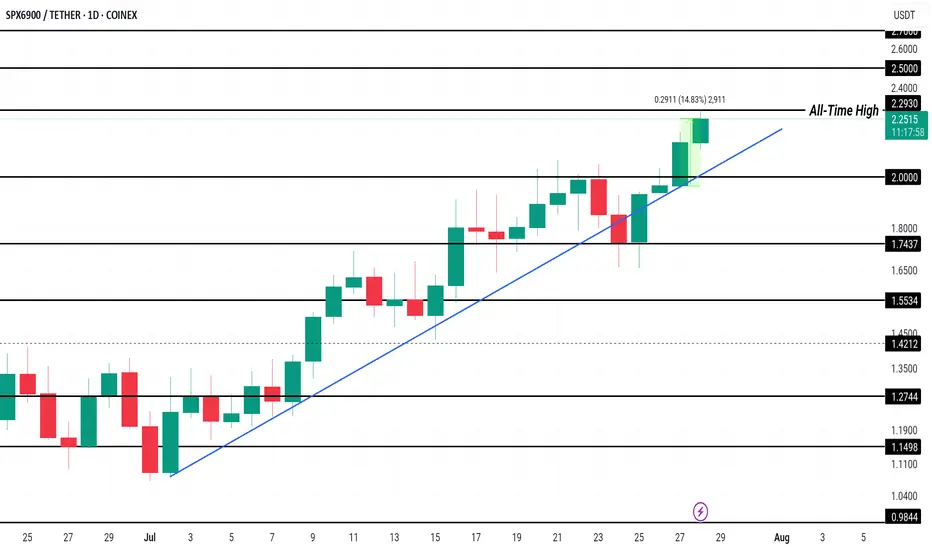
SPX Price Hits New All-Time High, $2.50 Up NextCOINEX:SPXUSDT has been experiencing a consistent uptrend since the beginning of the month, leading to the formation of multiple all-time highs, including one today at $2.27 . This price action reflects strong investor interest, pushing the altcoin to new levels and generating a positive market sentiment.
Currently trading at $2.23, COINEX:SPXUSDT has gained 14% in the past 24 hours . The Ichimoku Cloud, acting as support, signals bullish momentum. This suggests that SPX could rise further, with the potential to reach $2.50 or higher if market conditions remain favorable and investor confidence persists.
However, if selling pressure intensifies, COINEX:SPXUSDT could experience a reversal . A dip below the $2.00 support could push the altcoin toward $1.74 or lower, invalidating the bullish outlook.
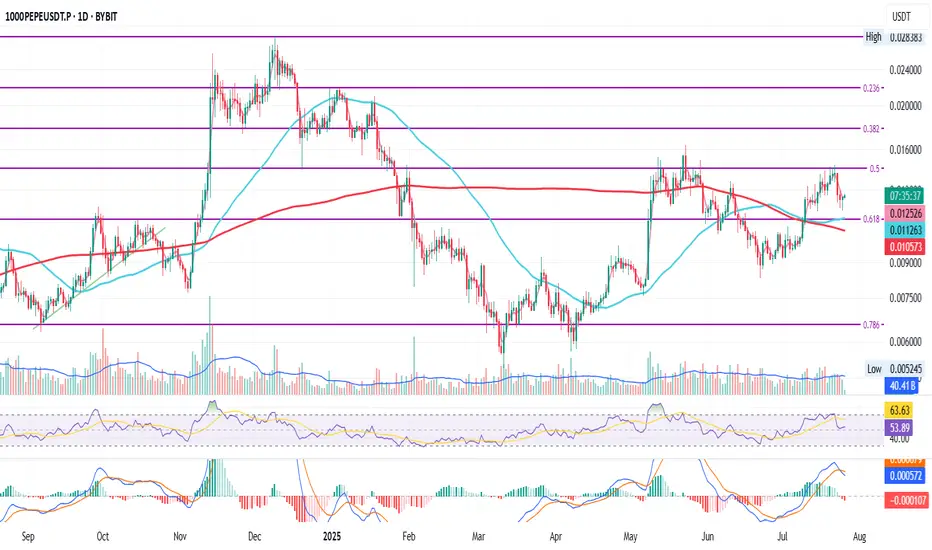
PEPE Daily Setup Holding Strong
This is PEPE on the daily
Price recently crossed above the 50MA which is currently resting on the 200MA after a golden cross
It was rejected at the 0.5 Fib but is now holding above the 0.618 Fib as well as the 50MA and 200MA
RSI is finding support at the mid level while MACD just turned bearish
Chances are we see a pullback first, a search for support, before the next possible move up
We’ll be here to watch it unfold
Always take profits and manage risk.
Interaction is welcome.
PENGUUSDT Daily Chart Analysis | Powerful Uptrend in PlayPENGUUSDT Daily Chart Analysis | Powerful Uptrend in Play
🔍 Let’s dissect the current PENGU/USDT daily chart, highlighting the unmistakable bullish structure and mapping potential targets as this trend matures.
⏳ Daily Overview
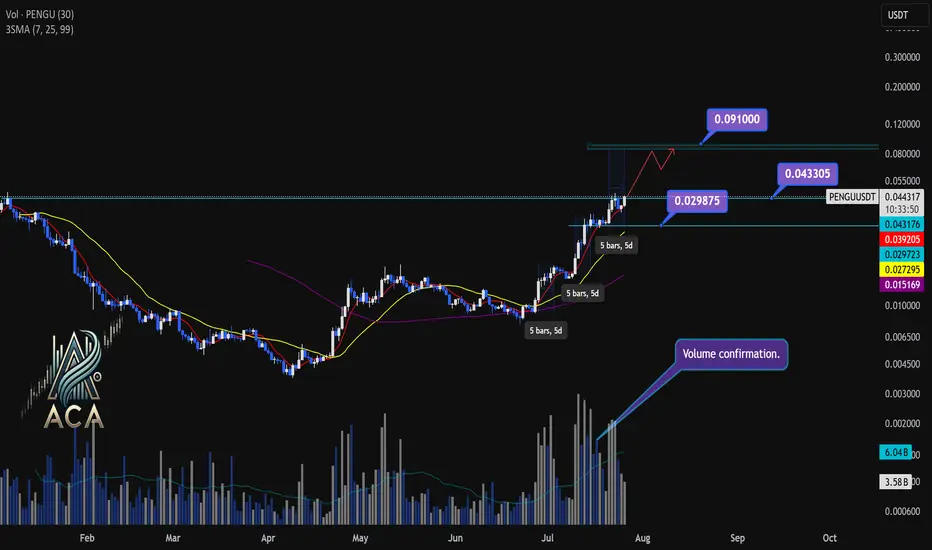
PENGUUSDT is riding a strong upward trend, with all three daily SMAs (7, 25, and 99) lined up in bullish sequence—clear confirmation of momentum. Recent rallies are also supported by textbook volume behavior: volume consistently surges during price climbs and tapers off during minor corrections, reflecting the classic signature of a robust uptrend.
🔺 Bullish Setup and Price Targets:
The next major upside target sits at $0.0910, almost 85% above the current level. For bulls, a daily candle closing above $0.043305 with convincing volume should act as a confirmation for fresh highs—though, as it’s Saturday, even moderate volume could suffice for a valid breakout.
📊 Key Highlights:
- All SMAs (7, 25, 99) confirming the uptrend on daily timeframe.
- Volume spikes on upward moves, fades on corrections—classic bullish confirmation.
- Historical trend velocity: Each time a new high (HH) is set, it’s preceded by around 5 days of advance; first leg was +83%, second +124%, the next (projected) is +160%, aligning with the $0.0910 target.
- Corrections: After each rally, pullbacks have measured about 15% and 20%. Should the first target be reached, expect a correction up to 25%—a healthy reset for further continuation.
🚨 Conclusion:
With all signals aligned—moving averages, volume dynamics, and historic price structure—the path remains bullish. A decisive close above $0.043305, especially with solid volume, could be the catalyst for the next major leg higher. As always, monitor for typical correction ranges post-breakout in line with the prior trend.
REI/USDT CYCLE UPDATE $0,90 by 2025 - Price prediction📈 REI/USDT CYCLE UPDATE – $0.90 by 2025
REI could break above its old ATH, targeting $0.90 in the upcoming cycle. Why?
Upcoming
✅ Ultra-fast blockchain (⏱️ 1.5s block time)
✅ Gas-free or near-zero fees – perfect for DeFi, NFTs & gaming
✅ EVM-compatible – easy migration for Ethereum dApps
✅ Low market cap → high upside potential
✅ Clean tokenomics with staking + resource model
✅ Built for speed, scale & adoption
DATA
Data shows that there is a structural trend going on, where this coin can break soon.
If the altcoin market heats up, REI has the fundamentals & tech edge to explode past previous highs. 🚀
🧠 Watch this one closely.
#REINetwork #Crypto #Altseason #EVM #PricePrediction #Web3
This is not trading advice, but a view from a side of study.

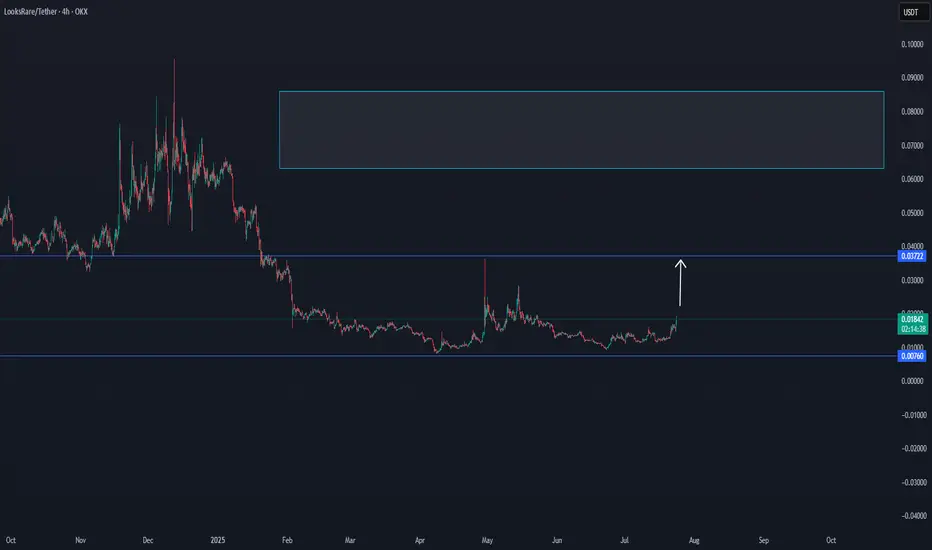
LOOKS CAN ENTER LONG TERM CYCLE AFTER THISLooks seems to make an important trend, which can allow this coin to enter a cycle area.
On the low time frame, it shows breakdown. The main view is that this coin is positive.
$0,035 is an important cycle target, which can be done with time depending on the last confirmations.


REI/USDT THE NEXT WHALE INCREASE COIN $0,04 TargetREI/USDT THE NEXT WHALE INCREASE COIN
This coin seems to have a powerful DCA effect, which can be confirmed in the coming time frames with a break.
When there is interest, and new confirmations, here below the update.
entering this coin only when there are more confirmations
The first confirmation is to get first out of this box
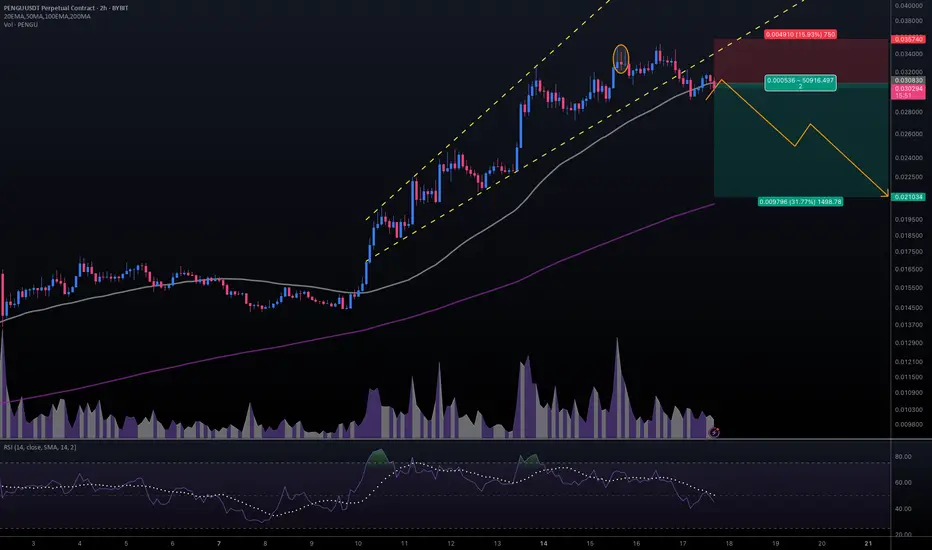
#PENGUUSDT #2h (ByBit) Broadening wedge breakdownPudgy Penguins printed an evening star then lost 50MA, seems to be heading towards 200MA support next.
⚡️⚡️ #PENGU/USDT ⚡️⚡️
Exchanges: ByBit USDT
Signal Type: Regular (Short)
Leverage: Isolated (2.5X)
Amount: 5.0%
Entry Targets:
1) 0.030830
Take-Profit Targets:
1) 0.021034
Stop Targets:
1) 0.035740
Published By: @Zblaba
CSECY:PENGU BYBIT:PENGUUSDT.P #4h #PludgyPenguins #Meme pudgypenguins.com
Risk/Reward= 1:2.0
Expected Profit= +79.4%
Possible Loss= -39.8%

OFFICIAL TRUMP Last Barrier · $30 or $100 Next · MixedThe last barrier is on now. The last barrier as in the last and final resistance level TRUMPUSDT (OFFICIAL TRUMP) needs to conquer before a major rise. Will this rise reach $30 or $100 or higher? Continue reading below.
Make sure to boost this publication and follow to show your support.
Hah! Resistance is confirmed as EMA89, what a drag. This is the blue dotted line on the chart but notice something else. Look at the magenta line, EMA55. TRUMPUSDT is trading above EMA55 but below EMA89. Bullish and bearish. Bearish and bullish. Mixed?
There is nothing mixed.
The main low happened 7-April. A higher low in 22-June. Can you see?
This is not mixed, this is bullish confirmed.
If the market were to move lower, then in 22-June we would have either a test of the 7-April low or a lower low. The fact that the drop stopped higher means that buyers were present. People were actually expecting for prices to drop and once they dropped they bought everything that was being sold. Prices couldn't move any lower because people were buying up. These are smart trader, smart money; experience for sure.
They managed to buy some tokens at a lower price within the "opportunity buy zone." This zone is available no more and now we have the mix of resistance and support; EMA89 and EMA55. What happens next?
Based on the previous signal I just showed you and marketwide action, Bitcoin super strong, we know that TRUMPUSDT will follow and break-up. Yes! Massive growth.
Both targets are good and will hit. Short-term, we will see a challenge of $30 and long-term we will see $100 and beyond.
Thanks a lot for your continued support.
Namaste.
