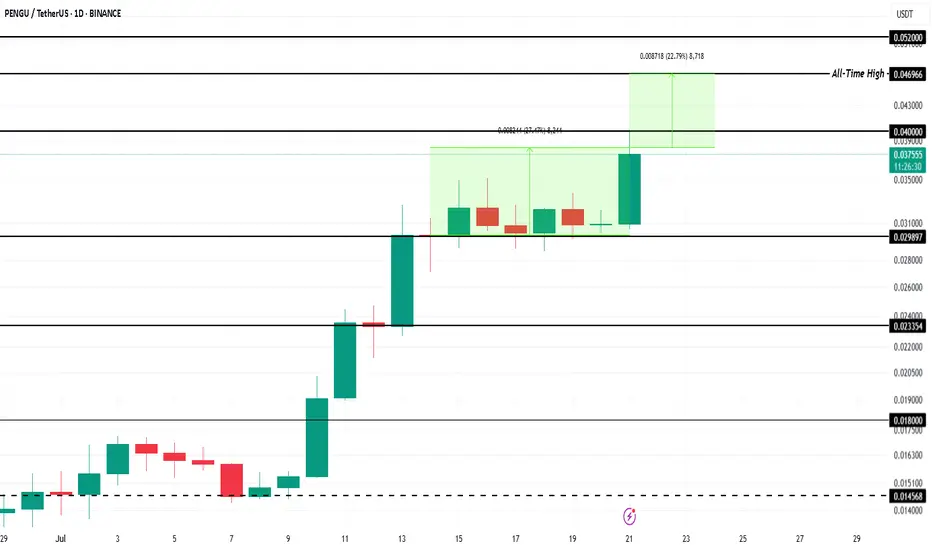
Meme Coin To Watch This Week - Pudgy Penguin (PENGU)BINANCE:PENGUUSDT price has surged 27% in the past week , currently trading at $0.038. The meme coin is inching closer to its all-time high of $0.046 . Strong bullish sentiment and market participation are fueling this rally, signaling that PENGU could soon retest resistance levels if momentum remains intact.
The meme coin is now just 22% away from hitting its record high . A Golden Cross pattern formed last week adds to the bullish outlook. If BINANCE:PENGUUSDT successfully flips $0.040 into a stable support level, the rally could continue, pushing the altcoin higher toward reclaiming its historical peak.
However, downside risks remain. If investors begin booking profits, selling pressure could drag BINANCE:PENGUUSDT lower . The critical support level of $0.029 will come into play. Losing this support could halt the upward trend and invalidate the optimistic price projection in the near term.
Memecoin
BONKUSDT 1D Chart Analysis | Bullish Momentum is coming...BONKUSDT 1D Chart Analysis | Bullish Momentum Builds After 0.236 Fibo Pullback
🔍 Let’s break down the BONK/USDT daily chart, focusing on the latest price action, strategic moving averages, RSI convergence, and volume dynamics for a complete bullish scenario setup.
⏳ Daily Overview
BONK is showing strong upward momentum, printing consecutive higher highs (HH) in both candles and RSI—a clear bullish trend indicator. After an explosive move, price is currently staging a healthy pullback to the key 0.236 Fibonacci retracement level (0.00003142), which commonly acts as a support platform during aggressive uptrends.
📈 Technical Convergence and Trend Structure
- 3SMA Support: The 7, 25, and 99 SMAs are all trending upward and stacked correctly, with price sitting comfortably above them. The 7SMA acts as immediate dynamic support, reflecting trend strength and buyer interest at every dip.
- RSI Dynamics: RSI just bounced from the 69–70 zone, confirming convergence with price action. The indicator made its own higher high in tandem with the candles, and now, as price pulls back, RSI is reentering the overbought territory—which often precedes renewed momentum.
- Volume Confirmation: Notably, volume surged as the trend accelerated, and is now tapering off during this corrective phase. This is a classic bullish volume signature, showing profit-taking by early longs but no major selling pressure, suggesting trend continuation likely after consolidation.
🔺 Bullish Setup & Targets
- First target: 0.00005376 — retest of the last all-time high (ATH).
- Next resistance to watch: 0.00003920, followed by the ATH region.
- Long-term target: 0.00009710 — an upside of 170–180% from current levels, mapped by technical extension and price discovery zones.
📊 Key Highlights
- Price holding the 0.236 Fibo retracement signals a shallow, healthy correction.
- 3SMA alignment confirms long-term bullish bias—actively supporting every dip.
- RSI and price are convergent, reaffirming uptrend strength; RSI’s move back into overbought could ignite the next price surge.
- Volume decreasing on corrections and rising during rallies—bullish confirmation.
🚨 Conclusion
BONK/USDT remains technically poised for further upside. The blend of higher highs, support at the 0.236 Fibonacci retracement, positive 3SMA structure, and RSI convergence all point to bullish continuation. Watch for renewed momentum as RSI reenters overbought territory and volume confirms the next breakout. Next targets: 0.00005376 (ATH), with a long-term projection toward 0.00009710.

FARTCOIN Holding the Trendline Like a ChampFARTCOIN is currently consolidating in a sideways range, forming a clean accumulation zone just above the rising trendline support. This kind of structure often builds energy for the next leg up.
As long as the price respects the rising trendline, the bulls remain in control. A breakout above the sideways zone could trigger a strong move toward the upper resistance levels.
Keep an eye on this one — it’s showing strength and gearing up for a potential breakout.

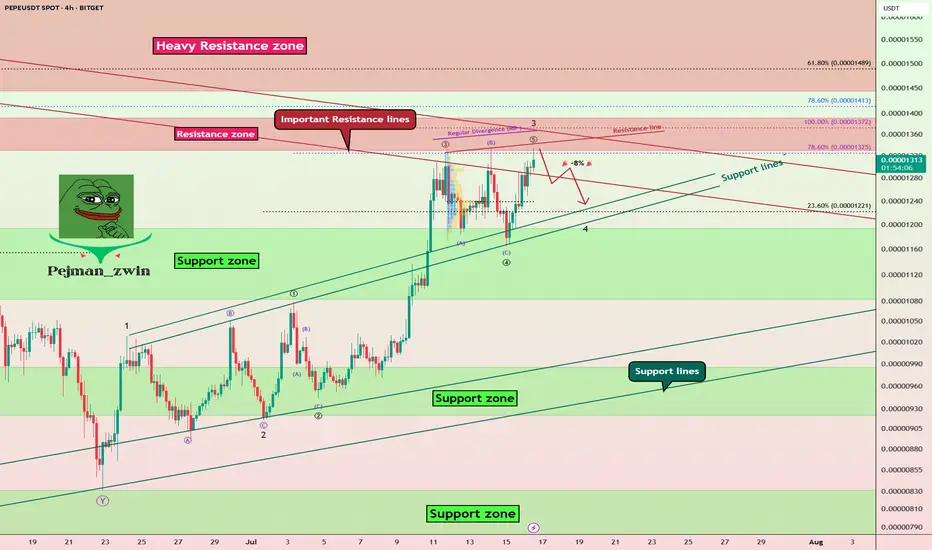
PEPE Faces Key Resistances – Is a -8% Pullback Coming?The PEPE memecoin ( BINANCE:PEPEUSDT ) is currently near the Resistance zone($0.00001392-$0.00001330) and Important Resistance lines . This is the third time that PEPE has attacked the Important Resistance lines .
In terms of Elliott wave theory , it seems that PEPE is completing the microwave 5 of the main wave 3 , so that the main wave 3 is of the extended type .
Also, we can see the Regular Divergence(RD-) between Consecutive Peaks.
I expect a -8% drop for PEPE in the coming hours.
First Target: $0.00001251
Second Target: $0.00001212
Note: Stop Loss(SL)= $0.00001400
Please respect each other's ideas and express them politely if you agree or disagree.
PEPE Analyze (PEPEUSDT), 4-hour time frame.
Be sure to follow the updated ideas.
Do not forget to put a Stop loss for your positions (For every position you want to open).
Please follow your strategy and updates; this is just my Idea, and I will gladly see your ideas in this post.
Please do not forget the ✅' like '✅ button 🙏😊 & Share it with your friends; thanks, and Trade safe.
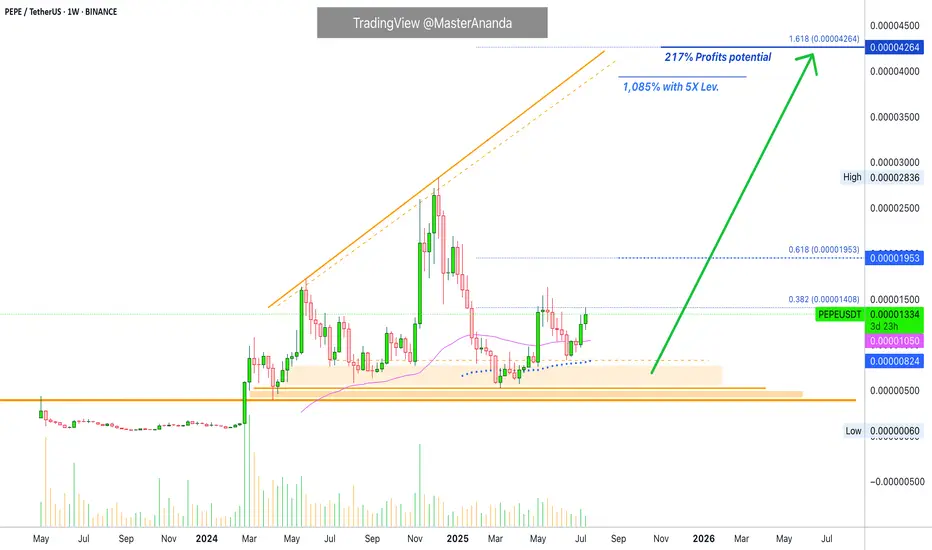
Pepe's Bullish Bias Intensifies · 217% PP = 1085% 5X Lev.The bullish bias for PEPEUSDT is starting to intensify, still early of course. It is still early on this one because the action is still lower than the 19-May high. There are many projects that are already trading above their last high. So it is good news to find a pair that is moving below because we know that soon it will be moving above. In the coming days.
While the 19-May wick high reached 0.00001632, the weekly close happened at 0.00001361. As you can see from the chart, the current price is already higher than the highest weekly close and this gives us a strong bullish signal.
Notice again how the action moved above EMA89 back in mid-April. When the retrace happened, May-June, the recovery happened above this level. A signal of strength.
PEPEUSDT moved briefly below EMA55 only two recover and this is the second week above this level. Trading weekly above EMA55 & EMA89 means that the bullish bias is fully confirmed. A fully confirmed bullish bias means we are set to witness a higher high, and a higher high means prices moving above 0.00001953, short-term. In a matter of days.
The main target for this move is 0.00004264 giving us a nice 217%. With 5X leverage, relatively low risk, that would be beyond 11X (1,085%).
In a matter of days, the entire altcoins market will be bullish and moving higher. Make sure you are fully invested by the time everybody is rushing to buy. That is, you should be all-in now. It is not too late.
Thank you for reading and for your continued support, it is truly appreciated.
Namaste.
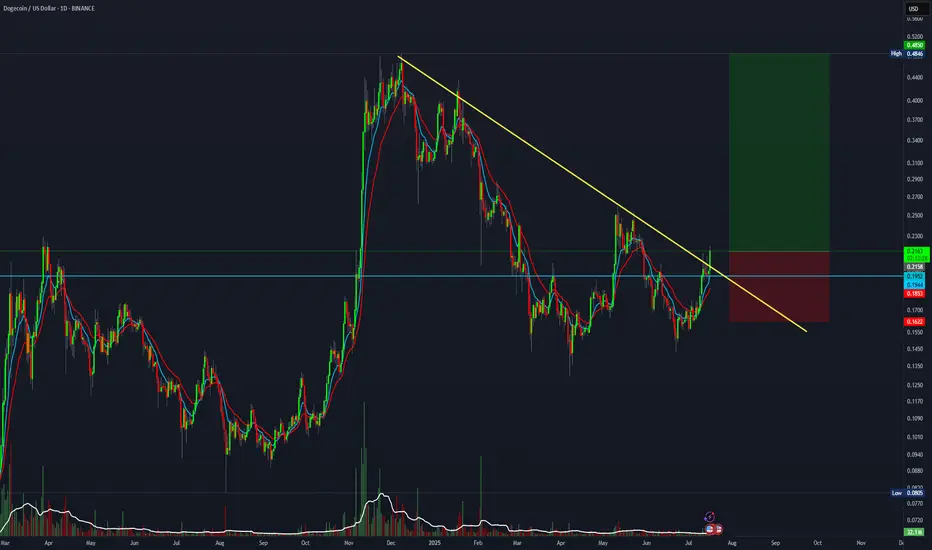
5:1 R:R for Dogecoin.DOGE is breaking out from the trendline. This setup offers a 5:1 R:R
Entry: 0.216
Stop Loss: 0.162
Target: 0.48
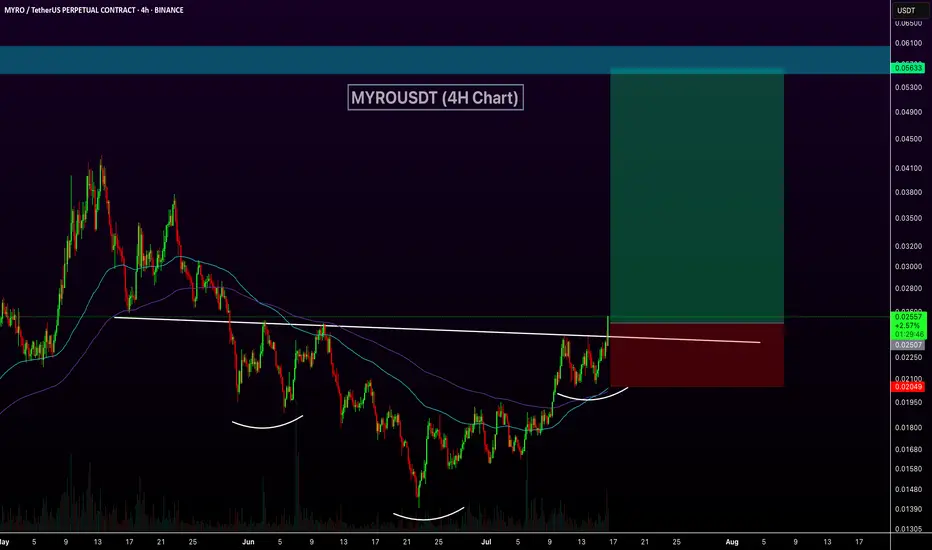
MYROUSDT Breaks Out of Inverse Head and Shoulders BYBIT:MYROUSDT has a clear breakout from an Inverse Head and Shoulders pattern, signaling a potential bullish trend reversal. Price has decisively broken above the neckline around the $0.025 level, supported by increased volume. Additionally, MYRO price is trading above both the 100 EMA and 200 EMA, reinforcing the bullish momentum.
[UPD] BTC / ETH / XRP / SOL / HYPE and other alt and mem-coins A new video update with insights on the intermediate trend structure with key support and resistance zones to keep on radar in the coming sessions
Coins discussed in the video: CRYPTOCAP:BTC / CRYPTOCAP:ETH / CRYPTOCAP:XRP / GETTEX:HYPE / CRYPTOCAP:SOL / CRYPTOCAP:LINK / CRYPTOCAP:SUI / $BRETT / SEED_DONKEYDAN_MARKET_CAP:FLOKI and others
Hope this is helpful in guiding you through the crypto market. Thank you for your attention and I wish you successful trading decisions!
If you’d like to hear my take on any other coin you’re tracking - feel free to ask in the comments (just don’t forget to boost the idea first 😉).

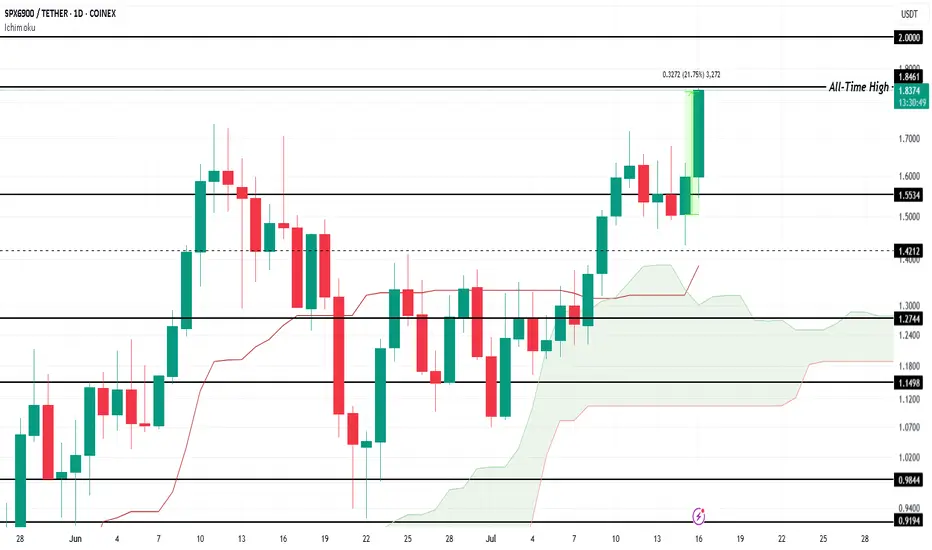
SPX Forms New All-Time High, Price Nears $2.00COINEX:SPXUSDT price has surged by 21.75% over the last 24 hours , reaching a new all-time high (ATH) of $1.84 . At the time of writing, SPX is trading at $1.83, showing promising signs of further upward movement. The altcoin's strong performance reflects growing investor interest and market optimism.
The Ichimoku Cloud, which lies beneath the candlesticks, signals that bullish momentum is currently prevailing for $COINEX:SPXUSDT. This technical indicator suggests that the altcoin could continue its ascent, potentially breaching the $2.00 level in the near future . If the trend persists, SPX could set new price milestones.
However, if COINEX:SPXUSDT experiences significant selling pressure from investors, the altcoin could face a correction. A drop below $1.55 would indicate a shift in momentum and potentially erase some of the recent gains. A failure to maintain key support levels could lead to further downside risks.
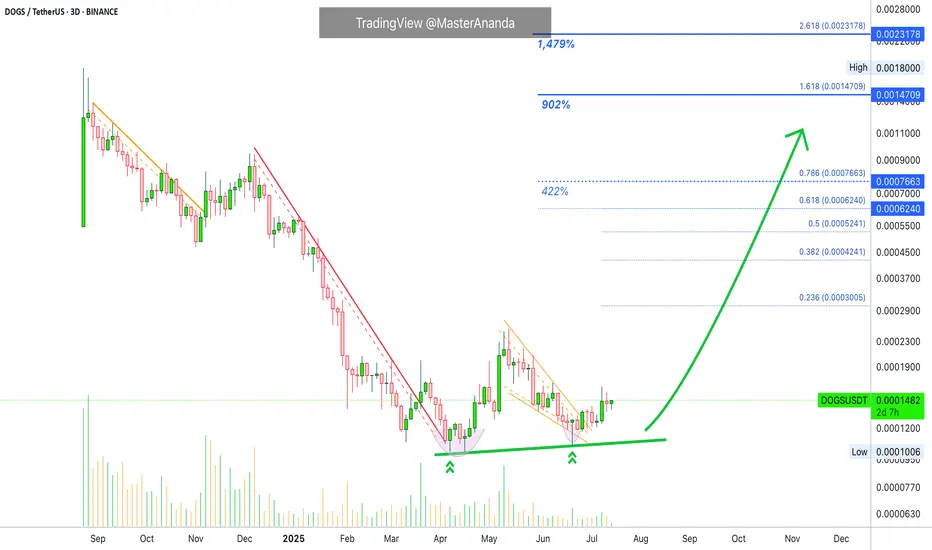
Dogs Update · 1,479% Easy Profits Potential TargetThe first target will be an easy target of 422%. We already talked about creating a position with leverage on this trade. This position is now live and secure, safe and effective, highly profitable with 8X.
Now we are looking at it again because there is still time to have a good entry before a major run. Time is running out though, we have only a few days left. After just a few days, prices will be 100% to 200% up, and then we will see more, more and more. Sustained long-term growth. Additional growth. Higher prices, higher highs, higher heights, forever more.
The bottom and reversal pattern here started in March and the bottom range was activated in February, which means the market is now 162 days sideways at bottom prices. This much consolidation at a market low will result in a massive wave of growth. This consolidation is already over, we just need to see the effect on the market, price and chart.
In a matter of days, one single candle with 3 digits green will change everything and this will happen to hundreds of pairs at the same time. Low prices will be gone but it will be the start of the market euphoria, major excitement and bullish growth.
This is a friendly reminder just to let you know that it isn't too late, but we are running out of time. You will do great. I promise. You have what it takes. It is simple when you know what to expect. Expect growth. Knowing this, you already won.
Namaste.
Bonk In A Good Situation, Breaking Resistance & HigherThe market bottom happened 7-April, it was a double-bottom compared to 11-March 2025. The end of a downtrend signals the start of an uptrend, and BONKUSDT started rising next. Resistance was found mid-May, on the twelve. This led to a correction and the correction ended 22-June as a higher low.
Now, between the first low in March and present day we have more than four months. The entire downtrend on the chart lasted 111 days, less than four months. This means that the bullish bias is already bigger in duration compared to the previous bearish wave, and, prices are set to continue higher because BONKUSDT just produced a higher high compared to May. Resistance has been compromised and this is good because it means we can soon experience additional growth.
The path is clear for rising prices. As resistance gets challenged in becomes weaker, as resistance weakens more buy-orders continue to pile up. The more buyers the better the market and then comes a new major high. The advance that is developing now will continue for months and months and months.
Are you ready for huge profits? I hope you are. Crypto is going up!
Namaste.

Peanut the Squirrel 1315% Profits Potential · Technical AnalysisI noticed that most of the memecoins have a strong growth potential. Here we have PNUTUSDT and the potential goes easily beyond 1,300%. An easy target is set to 467% so you can imagine. The chart looks strong and you know we focus only on TA.
Good evening my fellow Cryptocurrency trader, I hope you are having a wonderful day.
Peanut the Squirrel. Who am I to judge? RWA, Layer 1, POW, Gaming, DeFi, Infrastructure, NFT, AI... The choice is yours.
Here we have the classic and more than classic higher low. The bottom low and the bullish breakout ending its retrace higher is as easy and simple as it goes. The beauty of TA. You can know where the market is headed based on how the candles behave.
And then, we are back to the EMAs. Notice the blue one because it is the main one I'll be using on the daily timeframe. The huge big candle happens to break above this level. Once this level is conquered as resistance we know the bulls are on. Now the market can rest but it can also move ahead. We have a higher low, PNUTUSDT, and the action happening above EMA89, EMA55 and EMA13; in short, the bulls win.
The next higher high and first target is $1.03. This is followed by $1.59, 467% potential for growth and then the market can continue higher, easily, because we are entering the strongest ever Cryptocurrency bull market.
Namaste.

15% for MEME soonMEME is showing strength as market is bullish, I am expecting continuation with 15% minimum gain tomorrow.
NOT A FINANCIAL ADVICE
MANAGE YOUR RISK AND ALWAYS USE STOPLOSS

The best-looking HTF meme chart, hands down is $PENGUThe team behind the crypto mascot accomplished a lot over the last couple of weeks, and the TA is showing;
- CBOE filing for PENGU ETF
- Appeared at @Nasdaq
- Listed on @eToro
- Listed on @RevolutApp
- Listed on @Official_Upbit
- Listed on @WebullGlobal Pay
- @NASCAR Partnership
- PEZ x Pudgy Penguins Partnership
- Miles & More Partnership
- @PenguClash reached 2M+ on waitlist
- 1B views per day
All this and much more!
@pudgypenguins are doing it the right way 🐧

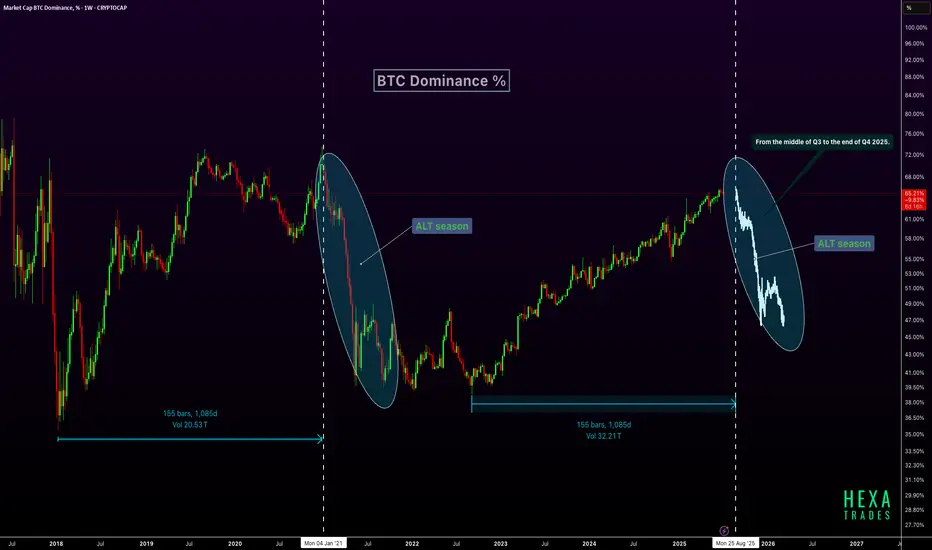
Altseason Ahead? BTC Dominance Cycle RepeatsBTC dominance is forming a pattern similar to the 2021 cycle, where dominance peaked after a long uptrend and then sharply declined, triggering a major altseason. Interestingly, that drop occurred after a 1,085-day rise, a time span we are once again approaching in 2025, projected to end around late August. If history repeats, BTC dominance could start declining from mid-Q3 2025, leading into a strong altcoin rally that may last through the end of Q4. This setup aligns with typical post-halving behavior, suggesting the final phase of the cycle could heavily favor altcoins.
CRYPTOCAP:BTC CRYPTOCAP:ETH CRYPTOCAP:XRP
GOGLZ - Sonic main meme coin, longGOGLZ - a risky memecoin for degens or a big opportunity for smart investors?
Every chain should have one king of memecoins. I think GOGLZ is Sonics chosen one.
Airdrop will soon land on Sonic users - the Sonic momentum will follow?
GOGLZ thin 4 million dollar market cap could be a lot more soon.
When GOGLZ pops its gonna run fast. I think it could be the right time to take a small before the opportunity is gone!
No financial advice - risky meme coin...and I'm a Sonic bull!
First target is a 70% move

MEW Main Trend. Memcoin. 2025 07 02Logarithm. Time frame 3 days.
Cat in a dogs world (MEW)
X -133 thousand subscribers (this is not enough).
Reduction from the maximum -87%. For such assets, this is not enough.
I imposed a descending channel on the chart (current descending trend of the main trend), and a horizontal one, if by some miracle this local Ross hook is broken upwards (not forming a local head and shoulders), not only to the resistance of the secondary trend (red line), but to break through it. Percentages to key zones of support/resistance levels are shown for clarity.
After the downward trend is broken, such "psychological-fundamental" assets are usually pumped up by +800-1000% from the minimums or more. Low liquidity, and the contingent of people who subscribe to these projects, allows this to be done easily at the right time: "the hamster is not scared". After pumping — a slow death, with pumps an order of magnitude smaller. Therefore, do not forget to sell in the alt season.
When working with such cryptocurrencies by liquidity, observe money management, use partial entry or on a breakout. Do not use margin leverage, as there may be snot in any direction for a large percentage, which will lead to liquidation "out of the blue".

Trend Reversal Confirmed? MEME/USDT Bulls Take ControlThe MEME/USDT chart is showing a highly compelling technical setup. Here are the key points of the analysis:
1. Breakout from Long-Term Downtrend:
Price has successfully broken above a descending trendline that has been in place since November 2024. This breakout marks a potential end to the prolonged bearish phase and opens the door for a new bullish trend.
2. Strong Accumulation Zone:
A clear accumulation zone is visible between $0.00130 – $0.00160, lasting from May through late June 2025. This zone now serves as a strong support area.
3. Formation of Higher Lows:
After the breakout, price action has begun to form higher lows — a bullish signal indicating that buyers are stepping in.
4. Potential Upside Targets (Key Resistance Levels):
The chart outlines several key resistance levels that may serve as short- to mid-term targets:
$0.001996
$0.002608
$0.003074
$0.003987
$0.004764
$0.007136
$0.010259
$0.017863
$0.018690 (previous high)
5. Bullish Scenario:
If bullish momentum continues with strong volume, price could follow the projected upward zigzag pattern and move through these resistance levels progressively.
6. Risk Management Note:
A breakdown below the accumulation zone ($0.00130) would invalidate the bullish scenario and should be watched closely.
✅ Conclusion:
MEME/USDT is displaying strong reversal signals after breaking out of a long-term downtrend and consolidating in a solid accumulation range. If buyer momentum continues, we could see significant upward moves toward key resistance zones.
#MEME #MEMEUSDT #CryptoBreakout #AltcoinAnalysis #BullishReversal #TrendlineBreakout #CryptoTrading #TechnicalAnalysis #AltcoinSeason #ChartPattern #CryptoSignals

OFFICIAL TRUMP 1,244% Target Revealed & Map UpdateI have several questions for you:
1) Did the market break your patience? Are you still holding?
2) How much are you going to take? Will you go for 278% or maybe 1,244%?
TRUMPUSDT has been really uneventful lately and this is good, it means that consolidation is still happening and consolidation is a form of exercise for a trading pair; TRUMPUSDT is building strength.
From a technical analysis perspective, the chart is great, still bullish continues bullish; looks good. Because the action continues to happen as a higher low compared to 7-April. 7-April is the market bottom, as long as this level is not challenged or broken we are now in the bullish zone.
The move that peaked in late April is the initial bullish breakout. The higher low 22-June marks the point where the retrace from the initial bullish breakout ends. 22-June can also signal the start of the next upthrust. From here on we will see growth.
Higher lows lead to higher highs. We have a very clear, strong and ecologically sustainable higher low. This means that a higher high comes next.
Here is the tricky, not so tricky part: TRUMPUSDT will grow to $50, $62, beyond $100 and so on, but, not all growth happens in a single wave. Just as TRUMPUSDT moved from $7 to $16 and then stopped, it can move from $9 to $34 and then make another stop, this one short. Then another rise toward $50 and so on. The market never moves straight down but neither straight up. And this gets us to my point. Will you sell when resistance is hit to later buy back lower, or, will you continue waiting until the market top, higher targets?
That's the question you need to answer to maximize profits when the action goes green. If you decide you want to sell the wave, then make sure to prepare to sell when the market is green. What happens is that if you don't sell when green but wanted to take some profits then you will do so when the market is red. In this case you will not be taking out the maximum possible...
Anyway, we have to leave something for another day. TRUMPUSDT will grow, for certain, but it takes time. Patience is key.
Thank you for reading.
Namaste.

MOONPIG - Solana Meme Coin Ready to Rocket in the Next Bull RunTechnical Analysis: Bullish Signals Flashing Bright:
The MOONPIG/USDT chart is painting a bullish picture. After a sharp retracement from its all-time high near a $125M market cap, the token has found solid support around $0.0045 and is now trading at $0.0052, showing signs of a reversal. Here’s what the charts tell us:
Breakout Momentum: On the 6-hour chart, $MOONPIG recently broke above a key downtrend line, signaling a shift from bearish to bullish momentum. A potential double bottom pattern suggests a continuation toward $0.008 or higher.
Support and Resistance: The $0.0045 level has held as strong support, with resistance looming near $0.0075 (a recent high). A clean break above $0.0075 could open the door to $0.01 or beyond, aligning with the 1.618 Fibonacci extension from the recent swing low.
With Bitcoin rallying and altcoins showing signs of life, $MOONPIG’s technical setup screams opportunity for traders eyeing a breakout.
Fundamentals:
Community Power: With over 18,000 holders as of early June 2025, $MOONPIG boasts a fiercely loyal community. Unlike many meme coins reliant on paid shills, its growth is organic, driven by retail investors who love its “normie-friendly” branding. Posts on X highlight strong morale, with users like JamesWynnReal calling it a “raging bull flag” poised for a $50M–$100M market cap.
Exchange Listings: Recent listings on HTX Global, MEXC, and LBank have boosted liquidity and visibility, with more exchanges reportedly in talks. These listings are a catalyst for retail FOMO, as seen in the $7M+ on-chain trading volume.
Solana’s Hot Streak: Solana’s fast, low-cost blockchain is the perfect home for meme coins like $MOONPIG. With Solana’s ecosystem thriving and retail interest in tokens like $POPCAT and SEED_WANDERIN_JIMZIP900:WIF soaring, $MOONPIG is well-positioned to ride the wave of altseason capital inflows.
Market Timing: As Bitcoin nears new highs and market sentiment turns bullish, low-cap meme coins historically see explosive gains.

MUBARAK Analysis (12H)Note: This is a risky and highly volatile meme coin.
It appears that the bullish X wave has ended at the point where we placed the red arrow on the chart, and the price has now entered a corrective phase once again. This correction seems to be forming a diagonal pattern, and we are currently in wave F of this structure.
If the price reaches the green zone, we can look for potential buy/long positions.
Targets are marked on the chart, with the main target being the flip zone.
A daily candle closing below the invalidation level would invalidate this view.
For risk management, please don't forget stop loss and capital management
Comment if you have any questions
Thank You

Mubarak Falling Wedge & Reversal Candle, Simple TradingAnother good chart setup, trade-opportunity, fully based on TA: MUBARAKUSDT.
The classic falling wedge is present on the chart, a perfect one.
The last candle that closed resulted in a reversal signal with increasing volume, also a higher low compared to April and May. Perfect market conditions. There is first a bottom pattern that leads to a bullish wave. The bullish wave gets corrected into a higher low and a clear reversal pattern develops. This higher low will lead to a new bullish wave where we are expected to sell at the top.
After this new bullish wave runs its course, we get a new correction. We know the end of this new correction because some form of signal will show up. We don't have to worry about the next correction nor about the long-term. Here, we can simply focus on the next target; buy now, wait and the market takes care of the rest.
Buy now when prices are low and hold. Set your sell (limit) order on target; the market takes care of the rest. Once your target hits, you will see a new balance in your account containing your initial layout plus profits. Very easy. Then rinse and repeat.
Next chart, next opportunity, next altcoin, next project, next pair, next trade.
Buy when prices are low; hold.
Sell when prices are high.
You can thank me now.
Namaste.

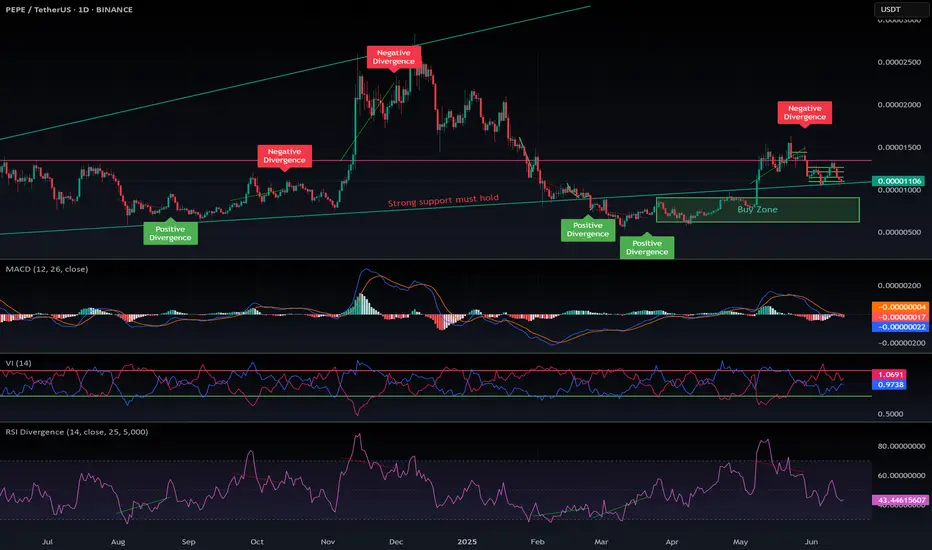
$PEPE follow up for June 2025Follow-up on my previous CRYPTOCAP:PEPE analysis — it played out exactly as expected.
CRYPTOCAP:PEPE remains my top meme coin, backed by some of the strongest tokenomics in the space. When altseason hits — if it hits — this one is primed to pump hard.
Like most altcoins right now, CRYPTOCAP:PEPE is in a short-term corrective pattern. That opens up another great opportunity to enter low and potentially ride a 2x or 3x move on the next leg up.
I’ve marked my usual buy zone. It may seem optimistic for now, but history shows how fast meme coins can dump… and then recover just as quickly. A drop into that green zone is entirely possible.
📲 Follow me for alerts — I’m monitoring CRYPTOCAP:PEPE daily. It’s one of my top picks.
DYOR.
Here was the previous analysis:
#PEPE #MemeCoin #Altseason #CryptoGems #BuyTheDip #Altcoins #CryptoTrading #Tokenomics #DYOR #CryptoAlerts