GOLD → Consolidation before continued growth FX:XAUUSD is undergoing a correction amid revised unemployment data, but this has not disrupted the overall technical situation. The market is still anticipating an aggressive reduction in interest rates...
The price resumed its growth on Wednesday amid escalating geopolitical tensions and a weakening dollar ahead of the release of US inflation data (PPI). The price is correcting after a record high of $3675, but retains the potential for further growth.
The escalation of the situation in Eastern Europe and the Middle East is increasing demand for safe assets. Expectations of Fed policy easing and a revision of employment data are weighing on the USD.
PPI inflation data: Today's release may temporarily support the USD if the figures exceed forecasts, but the overall trend remains bearish for the dollar.
PPI data is ahead, which may cause short-term volatility, but the long-term bullish trend remains intact.
Support levels: 3640, 3628
Resistance levels: 3657, 3675
Technically, I expect to see a correction from local resistance to the 3645-3640 area, from which growth may continue. A breakout of 3657 could trigger a continuation of the momentum.
Best regards, R. Linda!
Metals

BTC - Are the bulls looking for a liquidity grab?Market Context
Bitcoin is holding strong after bouncing from a higher support zone and is now pressing into an area packed with liquidity. The recent bullish price action has carved out multiple fair value gaps on the way up, each serving as confirmation of demand and strengthening the bullish structure. Above current price lies a major cluster of buy-side liquidity — a magnet for price.
Fair Value Gaps & Confirmations
On the way up, price created several bullish fair value gaps that have each been respected as support. The first, second, and now third retests into these imbalances show that demand continues to step in, absorbing supply and building pressure upward. Adding to that, a bullish inversion fair value gap (IFVG) has formed, giving extra confirmation that buyers are in control.
Liquidity Target Above
The most obvious draw for price is the heavy buy-side liquidity resting above recent highs. With so many stops positioned there, the market is incentivized to push higher and sweep that zone. The path toward it could involve another retest into one of the fair value gaps below before expansion takes place, or a direct continuation straight into the liquidity pocket.
Final Thoughts
This structure is showing textbook bullish strength: stacked fair value gaps, IFVG confirmation, and a clear liquidity pool overhead. Unless the market breaks back below the deeper support zone, the expectation remains a run into buy-side liquidity.
If this breakdown sharpened your view, a like is appreciated — and I’d love to hear from you: do you expect a retest first, or do we shoot straight into liquidity?

XAU/USD | Gold Faces Rejection Zone $3654–$3675 – Pullback AheadBy analyzing the gold chart on the 12-hour timeframe, we can see that the price has continued its rally since our last analysis, setting new highs one after another, with the latest peak at $3,675. Currently, gold is trading around $3,644, and we still don’t see any clear change in market structure to suggest a strong reversal.
However, the $3,654–$3,675 zone is considered a rejection block. If the price manages to close below this zone within the next 12 hours, I expect a price correction. The possible downside targets for this pullback are $3,635, $3,625, and $3,616.
Please support me with your likes and comments to motivate me to share more analysis with you and share your opinion about the possible trend of this chart with me !
Best Regards , Arman Shaban

Gold Promises New Highs👋Hello everyone, what are your thoughts on OANDA:XAUUSD ?
Today, gold continues to hold a strong bullish trend, currently trading around 3,630 USD with a short-term pullback serving as momentum for the next move.
The key support zone is located around 3,600 – 3,580 USD. If this level holds, the upside remains open with the first psychological target at 3,700 USD. Two major indicators to watch are PPI (Sept 10) and CPI (Sept 11), which could act as the next catalysts for XAUUSD. Keep a close eye to catch trading opportunities.
Scalping Strategy – Optimal Profit Management
✔️ TP1 or 30 Pips: Close bad entry and move SL to entry
✔️ TP2 or 50–70 Pips: Close half of remaining profit, move SL to TP1
✔️ TP3: Close all
From my personal perspective, the main trend remains bullish. Pullbacks only serve as opportunities for safer long entries. And you—what do you think about gold’s trend?

Gold 30Min Engaged ( Buy And sell Entry Detected )Time Frame: 30-Minute Warfare
Entry Protocol: Only after volume-verified breakout
🩸Bearish After Break : 3635
🩸Bullish Reversal : 3595
➗ Hanzo Protocol: Volume-Tiered Entry Authority
➕ Zone Activated: Dynamic market pressure detected.
The level isn’t just price — it’s a memory of where they moved size.
Volume is rising beneath the surface — not noise, but preparation.
🔥 Tactical Note:
We wait for the energy signature — when volume betrays intention.
The trap gets set. The weak follow. We execute.

XAU/USD (Gold) - Trendline Breakout (US - CPI Data) (11.09.2025)The XAU/USD Pair on the M30 timeframe presents a Potential Selling Opportunity due to a recent Formation of a Trendline Breakout Pattern.
This suggests a shift in momentum towards the downside in the coming hours.
Possible Short Trade:
Entry: Consider Entering A Short Position around Trendline Of The Pattern.
Target Levels:
1st Support – 3583
2nd Support – 3546
🎁 Please hit the like button and
🎁 Leave a comment to support for My Post !
Your likes and comments are incredibly motivating and will encourage me to share more analysis with you.

GOLD → Retest 3620 - 3600 (imbalance zones) on the uptrendFX:XAUUSD is consolidating ahead of important news. The market is currently testing support, but the bullish pattern remains intact despite the intraday correction.
Gold is trading near $3650 in anticipation of US inflation data (CPI), which will determine the further trend. So far, the metal is consolidating below a record high of $3675.
High CPI data: will strengthen the dollar and weaken gold (bets on Fed easing will decline).
Low data: will push gold to new highs (the likelihood of aggressive rate cuts will be confirmed).
At the moment, the probability of a rate cut on September 17 is 92% (25 bps), with an 8% chance of 50 bps.
Technically, the chart is forming a consolidation against the backdrop of a bullish trend, the market is testing support, and if the bulls hold their ground in the key zone, traders may return to buying.
Resistance levels: 3638, 3649, 3657
Support levels: 3620, 3607, 3600
There is a battle for the 3620 zone. Consolidation above this zone will confirm bullish strength; otherwise, we can expect a deeper correction to the 3607-3600 zone to retest the imbalance area before further growth.
Best regards, R. Linda!

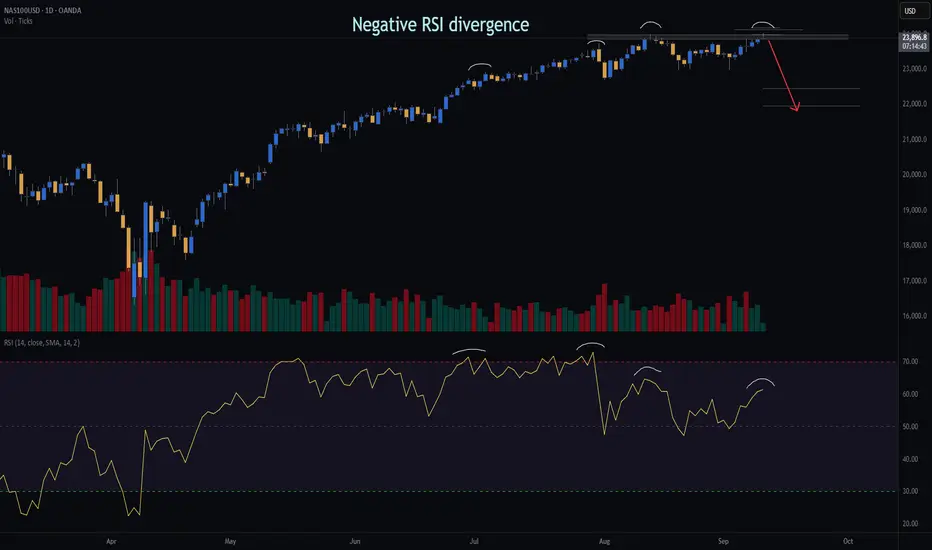
NASDAQ | Daily Double Top | GTradingMethodHello Traders 👋
🧐 Market Overview:
I’ve opened a short on the NASDAQ based on a clear double top setup that formed yesterday. Several of my key variables aligned, giving this trade a high-probability edge:
Negative RSI divergence → showing weakening buying momentum
Lower volume on the second top → indicating exhaustion
Daily candle closure within threshold → confirming structure validity
📊 Trade Plan:
RR: 9.1
Entry: 23 931
Stop Loss: 23 178
Take Profit 1 (50%): 22 453
Take Profit 2 (50%): 21 969
💡 GTradingMethod Tip:
When trading reversal patterns like double tops, I always wait for confirmation across multiple variables (momentum, volume, candle structure). This increases probability and reduces false entries.
🙏 Thanks for checking out my post!
Follow me for more setups and let me know — do you see this double top holding, or is there more upside left in the NASDAQ?
📌 Disclaimer:
This is not financial advice. This content is to track my trading journey and for educational purposes only.
XAUUSD Bears Hold the Line at 3650 zone – Next Stop 3570?In yesterday’s analysis, I mentioned that in my view, OANDA:XAUUSD ’s correction is not yet complete and that we could be inside an unfolding ABC-type structure. I also suggested that the 3650 zone should be the main focus for bears.
Indeed, price rallied into that zone, consolidated in a small distribution phase, and then started to roll back down again.
At the time of writing, gold is trading at 3632, after retesting the 3623 recent low, which now acts as short-term support.
Looking forward, my idea remains unchanged: I expect another leg down, with 3570 as the next major target. For now, the 3650–3660 area acts as a strong ceiling, and if we look closely, one could even argue a potential double top is forming—if we discount the 3674 spike that marked the ATH.
On the other hand, a stabilization above 3660 would invalidate this bearish scenario and open the door for a new ATH. 🚀

Gold Faces 3700 USD Resistance – Reversal or Breakout?👋Hello everyone, what do you think about the trend of OANDA:XAUUSD ?
Currently, gold is trading around 3645 USD in a price box, almost unchanged compared to the same session yesterday. Alternating rises and pullbacks indicate accumulation. Investors are now eagerly waiting for the upcoming CPI and Unemployment Claims data. If results come out weaker for the USD, gold may find an opportunity to challenge the key 3700 USD level.
Let’s wait for the results and see how gold will move!
Good luck!

XAUUSD Long: Upward Rully Will ContinueHello, traders! The price auction for XAUUSD has been in a clear bullish phase, with the market structure defined by a well-established ascending channel. This pattern originated from a pivot point low near the DEMAND ZONE 2 and has since guided the price higher through a series of impulsive and corrective waves, confirming that buyers have maintained the initiative.
Currently, following a test of the channel's upper boundary, the price has entered a corrective phase. This pullback is guiding the auction towards a significant confluence of support located around the 3620 DEMAND level. This DEMAND ZONE is critical as it represents the intersection of a horizontal support area and the dynamic support line of the ascending channel.
The primary scenario anticipates a successful defense of this support confluence. A confirmed bounce from the channel's demand line would validate the integrity of the uptrend and signal that the corrective phase is over. This is expected to trigger the next impulsive wave higher within the channel's structure. The take-profit is therefore set at 3705 points, targeting a new structural high just below the channel's upper resistance line. Manage your risk!

GOLD WEEKLY CHART MID/LONG TERM ROUTE MAPWeekly Chart Update
Please see update on our weekly chart idea.
Sunday we stated that we had the weekly body close above the channel top at 3576 and now opened the door to the larger 3659 long-term gap target.
- this target is now complete
We will now look for a close above 3659 for a continuation or failure to lock will follow with a rejection into lower levels for support.
🔹 Range Support Levels
3576 and 3482 now act as layered support levels to keep the bullish case intact within this range.
Updated Levels to Watch
📉 Support – 3482 & 3576
Key supports for this new range. Holding above 3576 strengthens the case for continuation toward 3659. A failure back below 3576 puts 3482 into play as the next defensive level.
📈 Resistance – 3732
This becomes the next upside objective if structure holds above 3659.
Thanks as always for your support,
Mr Gold
GoldViewFX

EUR/USD | Euro Rejected, Eyeing 1.168 & 1.166 (READ THE CAPTION)By analyzing the EUR/USD chart on the 4-hour timeframe, we can see that the price started to drop as expected, correcting down to 1.168. After that move, demand stepped in, and now the pair is trading around 1.1716.
If the price manages to stay below 1.174, we could see another bearish move. The possible downside targets are 1.168 and 1.166. Key supply zones are 1.174–1.178 and 1.179–1.1810.
Please support me with your likes and comments to motivate me to share more analysis with you and share your opinion about the possible trend of this chart with me !
Best Regards , Arman Shaban

GOLD 4H CHART ROUTE MAP UPDATEHey Everyone,
This is a follow up update on our 4H chart idea that we shared Sunday stating that we still had the final gap in the range left.
EMA5 cross and cross and lock above 3561 left 3615 open.
- This target was hit this week now completing our 4H chart idea.
Keep an eye out for our NEW 4H chart idea with updated levels and route map.
BULLISH TARGET
3424 - DONE
EMA5 CROSS AND LOCK ABOVE 3424 WILL OPEN THE FOLLOWING BULLISH TARGETS
3499 - DONE
EMA5 CROSS AND LOCK ABOVE 3499 WILL OPEN THE FOLLOWING BULLISH TARGET
3561 - DONE
EMA5 CROSS AND LOCK ABOVE 3561 WILL OPEN THE FOLLOWING BULLISH TARGET
3615 - DONE
As always, we will keep you all updated with regular updates throughout the week and how we manage the active ideas and setups. Thank you all for your likes, comments and follows, we really appreciate it!
Mr Gold
GoldViewFX

Gold Holds Steady, $3,700 in FocusOANDA:XAUUSD The price is still holding firm around $3,637/oz after the U.S. inflation report came in softer than expected. Despite a slight pullback, bullish momentum remains strong, and the falling wedge pattern is signaling a potential breakout.
From my personal perspective, the $3,700 level will be the key decision point. If it is broken with strong momentum, gold could extend its rally toward $3,725/oz or even higher. However, upcoming U.S. economic data such as PPI and jobless claims should be closely monitored as they may directly influence short-term volatility.
This is my outlook shared with the trading community. What do you think? Let’s discuss in the comments!

DeGRAM | GOLD rebounded from the support area📊 Technical Analysis
● XAU/USD staged a bullish takeover at 3,636 support, reclaiming the mid-range and establishing a higher low.
● Price is now pressing 3,650, with projections showing a push toward 3,654 before testing the 3,668–3,672 resistance area.
💡 Fundamental Analysis
● Gold demand is underpinned by cautious sentiment ahead of US CPI, while weaker dollar flows and ongoing geopolitical tensions enhance safe-haven appeal.
✨ Summary
Bullish above 3,646; targets 3,654 → 3,668. Invalidation on a close below 3,636.
-------------------
Share your opinion in the comments and support the idea with a like. Thanks for your support!

A Healthy Market Breathes. Gold Hasn’t Exhaled Yet.I remain bullish on Gold overall — that’s not in question.
On 24 August, I even shared a complete cross-market outlook arguing that acceleration to the upside could be the next big move. And indeed, we got it.
But here’s the paradox of markets: sometimes, the stronger the rally, the more fragile it becomes.
________________________________________
Why I Warned About a Steep Correction
• Yesterday, I flagged the risk of a sharp pullback. My stop loss was triggered, yes, but my conviction hasn’t changed. If anything, the higher Gold pushes, the more probable and violent the correction could be.
• The daily chart says it all: since the local bottom around 3300, Gold has moved almost vertically higher.
• From 26 August onward, with the sole exception of the 4 September red candle, every single day closed green — and not just small gains, but +1% or more.
This type of move is powerful, but also unsustainable.
________________________________________
Market Psychology at Work
Markets move in cycles of fear and greed, tension and release. A one-sided move — especially a vertical one — compresses tension like a coiled spring. Traders get trapped:
• Late buyers rush in from FOMO, convinced “it will never stop going up.”
• Sellers get squeezed, forced to cover, adding fuel to the fire.
• But eventually, when there’s no one left to buy at higher prices, even a small wave of selling can cascade into a steep correction.
This is why not even Bitcoin, in its glory days, could sustain vertical rises for long. The pattern was always the same: euphoric rise → brutal drop . Gold is no different.
________________________________________
Where We Stand Now
• At the time of writing, Gold trades at 3647, after touching 3660 and marking a new ATH.
• Is this the local top? Hard to say with certainty. But in my book, until we see a strong correction, there is no valid buy trade here.
________________________________________
My Trading Plan
Today, I will look to sell again. Not because I doubt the long-term bullish trend, but because the short-term imbalance is glaring.
A healthy market breathes, and Gold hasn’t exhaled yet.
🚀 Long term: bullish.
⚠️ Short term: vulnerable.
🎯 Until a correction resets the board, my play is on the short side.

Technical Analysis: Is Gold Targeting 4000 USD?👋Hello everyone, what do you think about the trend of OANDA:XAUUSD ?
Here’s my medium to long-term view:
In recent weeks, U.S. economic data has shown a weakening labor market, with the latest NFP coming in below expectations. This increases the likelihood that the Fed will cut interest rates, driving more safe-haven flows into gold. As a result, gold has made new history, currently trading around 3650 USD.
From a technical perspective, the trend is moving in line with Dow Theory. On the D1 chart, the bullish structure remains intact. Price has completed wave 1 and its correction, and is now in the process of forming the next impulsive wave to extend the uptrend.
According to Elliott Wave, gold has already formed waves (1) and (2). Wave (3) is developing and could soon move into a mild wave (4) correction before advancing to wave (5). My target is the psychological level of 3700 USD, with potential extension toward the 4xxx zone.
In the short term, the 3,545–3,560 USD range is the nearest support. If it breaks, price could retreat to the 3,450 USD area, which would act as a medium-term accumulation zone.
Given the current trend, the strategy is to buy on pullbacks, with scalping also a reasonable option. Always manage risk carefully with proper TP and SL .
⭐️This is just my personal view based on technical analysis. Gold is also influenced by news, so this is not investment advice, only a perspective on the precious metal. If you have any thoughts or interesting ideas, feel free to share them in the comments!
Good luck!

Silver Near PRZ – Bearish Reversal Incoming?Today I want to share with you an analysis of SILVER ( OANDA:XAGUSD ). In my opinion, in terms of technical analysis , Silver has a more regular chart than Gold( OANDA:XAUUSD ) these days.
Silver is currently trading near the Resistance line , Important Resistance lines , Yearly Resistance(2) and Potential Reversal Zone(PRZ) .
In terms of Elliott wave theory , it seems that Silver has managed to complete microwave 3 of the main wave 5 , and after the support lines are broken, we can expect a decline and completion of microwave 4 . The end of microwave 4 could follow Fibonacci levels .
Also, we can see the Regular Divergence(RD-) between Consecutive Peaks .
I expect Silver to fall to at least $40.51(First Target) AFTER breaking the support lines .
Second Target: $39.81
Stop Loss(SL): $42.18
Note: Today's US data release could cause a shock to Silver, but ultimately, Silver will continue its downward trend (at least to the first target).
Please respect each other's ideas and express them politely if you agree or disagree.
Silver/ U.S. Dollar Analyze (XAGUSD), 4-hour time frame.
Be sure to follow the updated ideas.
Do not forget to put a Stop loss for your positions (For every position you want to open).
Please follow your strategy and updates; this is just my Idea, and I will gladly see your ideas in this post.
Please do not forget the ✅' like '✅ button 🙏😊 & Share it with your friends; thanks, and Trade safe.

Gold may move up a little and then start to declineHello traders, I want share with you my opinion about Gold. The market for Gold has transitioned from a prolonged balancing phase into a strong directional trend, following a decisive breakout from its prior multi-week big range. This breakout, originating from the support area near the 3445 level, shifted market control firmly to buyers and initiated a new impulsive phase. The price action for XAU since then has been characterized by a steep, high-momentum rally, which is being guided by an ascending mirror line. Currently, the asset is at a new high, continuing to push upwards along this aggressive trendline. However, such accelerated trends are often unsustainable and can signal that the market is becoming overextended and due for a correction. I expect that after a potential final push higher, the price will stage a sharp reversal, with enough selling pressure to cause a breakdown below the steep mirror line. A break of this dynamic support would be the first confirmation that a corrective phase has begun. Therefore, the TP for this corrective scenario is logically placed at 3520 points. Please share this idea with your friends and click Boost 🚀

XAUUSD – PPI Ahead: Key Liquidity Levels & Trading Plan🚀 MMFLOW TRADING
Market View:
After yesterday’s sharp drop where sellers dominated the liquidity zone, gold (XAUUSD) is now recovering from 362x → 364x during the Asian session. In the short term, price may range between 362x–365x in Asia/Europe before going sideways to await the PPI release in the US session.
Today’s PPI is expected at 0.3% vs 0.9% previous, signalling cooling inflation. However, actual data could surprise higher – often creating a “news trap”. From a technical view, gold may need to revisit 360x liquidity before resuming its uptrend ahead of CPI & the upcoming FED meeting.
👉 In short: Structure remains bullish, but short-term liquidity sweeps are likely before any continuation move.
Key Levels:
Resistance: 3647 – 3654 – 3665 – 3674 – 3704
Support: 3635 – 3613 – 3600 – 3586
Trading Plan:
🔵 BUY Zone: 3600 – 3598
SL: 3592 (or tighter at 3580)
TP: 3605 → 3610 → 3615 → 3620 → 3630 → 3640 → 3650+
🔴 SELL Zone: 3703 – 3705
SL: 3710
TP: 3698 → 3694 → 3690 → 3680 → 3670 → 3660+
Summary:
✅ Gold remains in an uptrend, but may retest 360x liquidity before heading higher.
✅ PPI today & CPI tomorrow could act as a “news trap” – caution is required.
👉 Watch the key levels and follow MMFLOW TRADING for real-time updates & BIGWIN setups!

Focus on CPI, beware of unexpected surprisesThe market focuses on CPI data, which is unlikely to fluctuate significantly in the short term. Although it has fallen below the recent support of 3620, buying below is still strong, so don't chase the short position. From the news and other recent data, it can be seen that the weak US employment data has suppressed the economy, forcing the Federal Reserve to cut interest rates. The current market basically assumes that 25 basis points has become a reality, so the possibility of positive CPI data is relatively high.
If the CPI data is positive for gold, it will first test the resistance level of 3640-3660. If the data triggers a strong rally, gold could potentially reach new highs, aiming for 3690-3700.
However, the previous NFP data was also crucial, but the result was a surprise. Therefore, we cannot rule out the possibility of a similar surprise with the CPI data. If the CPI data is bearish for gold, it will first test 3600 below. Once it falls below 3600, it will go to 3580.
The above content is just an analysis of the possible trend of gold, which you can refer to. If the European session retreats again to 3620-3610 without breaking, you can try to go long with a light position, and the ideal target is 3640-3660. If it falls below 3600, SL will be adjusted in time.

US100 - New Highs are coming!Market Context
The US100 is trading within a strong bullish structure after bouncing from a well-defined support zone. Price has been respecting key levels on the way up, forming fair value gaps (FVGs) that act as stepping stones for continuation. The overall picture points to a market that is building momentum for a potential liquidity grab higher.
Support Zone & Initial Rally
The chart shows a strong support zone at the lows, which provided the foundation for the current bullish impulse. Once price tapped into this area, buyers stepped in aggressively, leaving behind multiple bullish imbalances on the way up. This confirms that institutional interest is present at these levels.
Fair Value Gaps & Structural Strength
On the rally, price created overlapping FVGs, including a bullish fair value gap and an inversion fair value gap (IFVG). Importantly, candles never closed below the primary FVG — reinforcing its validity as strong demand. This means that even if price retraces, these areas will be closely watched for re-entries.
Liquidity Grab & Next Move
Above current price action lies a clear buy-side liquidity (BSL) level. The market is likely to target this zone, either directly from current levels or after a retest into the stacked FVGs. A liquidity sweep above the highs would be the natural continuation of the bullish structure, unlocking the potential for new short-term highs.
Final Thoughts
The US100 is showing a textbook bullish setup: strong support, healthy retracements, and unmitigated FVGs acting as demand. As long as the lower support holds, the expectation remains for a run into the BSL above.
If this analysis brought value, drop a like — and let me know: are you waiting for the retest, or do you think the market runs the highs straight away?
