BTC - Perfect Bullish SetupPrice Action Breakdown
After running the lows with a clear Sell Side Liquidity Sweep, BTC quickly reversed and printed a Market Structure Shift (MSS). This marked the first real sign that the market might be ready to transition from weakness into strength.
Retracement Zone
Price is now retracing into a very interesting area — the overlap of a Bullish Fair Value Gap, an IFVG, and the Golden Pocket. When multiple imbalances and Fibonacci levels line up like this, it often builds a high-probability zone where institutions look to re-accumulate positions before the next move higher.
Upside Target
If this area holds and buyers step in, the next logical draw on liquidity sits above Buy Side Liquidity. That pool of stops acts like a magnet, and with the prior lows already cleaned, the path of least resistance could be higher.
Invalidation
On the other hand, a failure to hold inside the Golden Pocket would weaken this bullish narrative. A clean break below the sweep low would suggest that this rebound was only temporary relief before further downside.
Final Thoughts
This setup is all about how price reacts inside the retracement zone. If we see strength here, the run toward Buy Side Liquidity is very much in play. If not, patience will pay, as deeper levels will likely come into focus.
What’s your take — do you see this zone holding, or are you expecting another flush?
Metals

XAUUSD: Trading Plan for September 2Gold Support and Resistance Levels:
4-Hour Chart Resistance: 3535, Support: 3450
1-Hour Chart Resistance: 3520, Support: 3470
30-Minute Chart Resistance: 3510, Support: 3480
Gold bulls continue to gain momentum, breaking new highs. With the Fed's rate cuts, there's still significant room for growth. As always, trading with the trend makes everything easier. Pullbacks provide buying opportunities. Don't speculate on the top, as selling is a high-risk trade.
Use today's low of 3470 as a stop-loss and try to buy on dips.
Buying plan: 3475-3480.

Gold | 15min Head and Shoulders | GTradingMethodHello Traders.
Welcome to today's trade idea by GTradingMethod.
🧐 Market Overview:
There’s a potential head and shoulders pattern forming on the 15-minute chart. Gold broke to a new high yesterday, and a healthy breakout often comes with a retest before continuing higher.
This 15-minute head and shoulders could signal that retest — or potentially lead to a deeper correction.
One of the variables I will be looking for is lower volume on the right shoulder.
📊 Trade Plan:
Risk/reward = 3.3
Entry price = 3 536.3
Stop loss price = 3 543.5
Take profit level 1 (50%) = 3 516.8
Take profit level 2 (50%) = 3 506
💡 GTradingMethod Tip:
Patterns can provide an edge, but waiting for confirmation helps you avoid false signals and emotional decisions.
🙏 Thanks for checking out my post!
Make sure to follow me to catch the next idea and please share your thoughts - I would like to hear them.
📌 Please note:
This is not financial advice. This content is to track my trading journey and for educational purposes only.

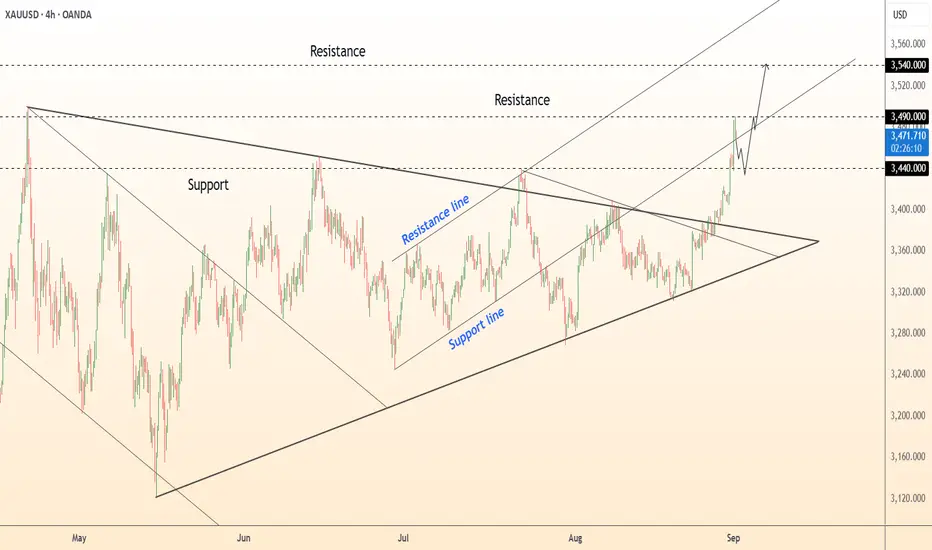
DeGRAM | GOLD exited from the triangle📊 Technical Analysis
● XAU/USD broke out of a prolonged consolidation wedge, surging above 3,440 and validating a bullish continuation setup.
● Price is targeting the 3,490 resistance; a breakout would open the path toward 3,540, with 3,440 now acting as a strong support floor.
💡 Fundamental Analysis
● Softer US inflation metrics and a pullback in yields are pressuring the dollar, while heightened geopolitical risks continue to fuel safe-haven demand for gold.
✨ Summary
Bullish above 3,440; targets 3,490 → 3,540. Invalidation on a close below 3,440.
-------------------
Share your opinion in the comments and support the idea with a like. Thanks for your support!
XAUUSD (GOLD) BREAKDOWN OR BOUNCE FROM 3469Hi trader's
Gold has recently broken above its resistance and is now retesting the same levels from below. At the same time, the market structure is hinting at the formation of a possible Head & Shoulders pattern – a well-known reversal setup.
Currently, Gold is holding near important levels:
Support 1: 3469 – This is the immediate level to watch.
Support 2: 3452 – 3448 zone, a deeper demand area where buyers may step in.
Supply Zone: 3510 – The next upside level if bullish momentum returns.
⚠️ If Gold breaks below 3469, it could confirm weakness and extend the move toward the second support area (3452–3448).
✅ On the other hand, if 3469 holds as support, the market may reject lower prices and continue bullish momentum toward the supply zone at 3510.
This setup highlights the importance of the 3469 level — it is acting as a decisive point between bearish continuation and bullish retracement
👉 Follow for more safe updates 🔔
❓ What’s your view on Gold at these levels?

Silver = to the moon??? September 03, 2025Who’s Loading Up:
A top dog at Pan American Silver Corp., a heavyweight in North American silver digs, just scooped up a hefty chunk of shares.
Deal Size: This exec grabbed 50,000 shares at $22.50 a pop on August 28, 2025, dropping $1.125 million—talk about putting skin in the game!
Company Lowdown
Pan American Silver Corp. runs 10 mines across the Americas, packing 468 million ounces of silver and 6.7 million ounces of gold. Based out of Vancouver, they’ve got cash flowing like a river, fueling big bets like La Colorada Skarn and Escobal.
Sector Vibes:
• The Silver Institute’s calling for a fifth straight supply crunch in 2025, with photovoltaics and AI tech demand hitting all-time highs.
• Tariff threats, green energy boom, and a possible Fed rate cut in September 2025 could send silver soaring.
Big Funds Jumping In
Last quarter (June–August 2025), heavy hitters like Sprott Asset Management (+8% in Pan American), BlackRock Inc. (+5% in iShares Silver Trust), and Invesco Ltd. (+6% in VanEck Silver Miners ETF) piled into silver.
Buzz on X says Saudi Central Bank’s dipping its toes into silver via iShares Silver Trust (SLV), ditching its gold-only playbook.
London Vaults Drying Up
The LBMA’s silver stash is under siege from a supply deficit. With 150 million ounces short in 2024, the Silver Institute hints reserves might shrink 5–10% yearly if demand keeps raging, setting the stage for a price explosion.
1979 Boom & 2025–2026 Wild Cards
1979 Flashback: The Hunt Brothers’ silver grab, plus inflation and oil chaos, rocketed silver from $6 to $50/oz (+700%). Gold jumped from $300 to $850/oz on similar vibes.
2025–2026 Triggers:
Inflation’s sticky above 3%, the USD’s wobbling from tariffs, and a Fed cut looms in September 2025. Watch for U.S.-China trade wars, Middle East flare-ups, or a BRICS metals exchange—any could ignite a 1979-style silver rocket if deficits worsen.
Price Targets:
Short-Term (3 months): $60.00 (+46.9%)
Mid-Term (6–12 months): $120.00 (+193.7%)
Long-Term (18–24 months): $240.00 (+487.5%)
🤔🤔🤔🤔🤔🤔🤔🤔

Gold’s $200 Surge Defies the DollarOver the past week, gold prices exploded by more than $200 per ounce, shattering the $3,500/oz threshold to new all-time highs . Silver joined the surge, breaching $40/oz for the first time since 2011 . This explosive precious metals rally is striking not only for its magnitude, but because it occurred in tandem with a strengthening U.S. dollar – a sharp break from the usual inverse correlation between gold and the greenback. Typically, “gold’s appeal reflects an inverse relationship with the dollar’s value”, as one analyst noted , and gold soars when the dollar slumps. Yet this time, the U.S. Dollar Index held firm (even rising against some currencies), so gold’s ascent “alongside the value of the US dollar” appears anomalous .
This disconnect has confounded the simplistic media narrative that tried to pin gold’s move on U.S. political drama – namely turmoil surrounding Donald Trump pressuring the Federal Reserve. Indeed, mainstream headlines have leaned on that explanation: “Gold surges after Trump’s Fed pressure,” blared the Financial Times, after President Trump’s attempted (and unprecedented) firing of Fed Governor Lisa Cook raised alarms about Fed independence . Bloomberg News similarly attributed gold’s spike to “rate-cut bets” spurred by Trump’s actions . There is some truth here – investors clearly sought safety amid U.S. political uncertainty, with the largest gold ETF (SPDR Gold Shares, ticker GLD) hauling in over $2.3 billion of inflows last week to top all ETFs, “as gold prices flirted with record highs near $3,500” following Trump’s attempt to oust a Fed official . Concerns over Fed independence and Washington turmoil did fuel safe-haven demand . But a closer investigation of market data and cross-asset flows reveals a more complex story than “Trump made gold jump.” In particular, the simultaneous rise of gold and the dollar hints at other forces at play – potentially global capital rotations and eurozone undercurrents – that the simplistic narrative overlooks.
Order Flow: U.S. Buying vs. Asian Selling
One immediate clue lies in where the strongest gold buying originated. Market internals and order flow patterns suggest that North American investors led this rally, while Asian and European participants were net sellers or laggards. Gold’s intraday price action repeatedly showed dips during Asia and London trading hours, followed by robust gains during U.S. market hours – indicating steady accumulation out of New York overcoming profit-taking elsewhere. This aligns with recent flow trends: “Gold ETF buying has flipped from Asia to Western investment markets”, notes BullionVault, as China and India saw outflows while U.S. and European gold funds began expanding together . In the past fortnight, Asian-listed gold ETFs shrank by over 5 tonnes – the heaviest 2-week outflow since the Ukraine invasion – even as Western funds saw their strongest stretch of inflows in over two years .
Physical gold selling in Asia corroborated this trend. As prices hit fresh highs above $3,000 and $3,500, Asian jewelry holders rushed to “cash in”. In India’s bazaars and Middle Eastern souks, retailers report a surge of people selling old jewelry and coins to lock in gains . “Customers raced to cash in their old gold,” Reuters noted, with scrap sales booming across India and the Middle East . This flood of recycled gold effectively made Asia a net supplier to the market during the rally, potentially “tempering gold’s rally” in those regions if it continues . In contrast, U.S. investors were voracious buyers: not only did American ETFs see big inflows, but U.S. futures markets showed relentless bids during New York trading sessions, driving price strength into each day’s close.
In sum, Western demand carried gold higher even as Eastern markets took profits. This East-to-West flow reversal suggests the price surge was not simply a global panic “bid” for gold, but rather a targeted rotation of capital – with U.S. and European buyers eagerly absorbing the supply coming out of Asia. Such a dynamic is important because it hints that new money (likely institutional and speculative) in the West was a key driver, rather than traditional physical demand from Asia (which actually softened amid the high prices).
Gold in USD vs. Gold in EUR: A Currency Disconnect
Another intriguing aspect of this rally is how differently it played out in U.S. dollars versus other currencies – particularly the euro. Gold’s price in USD hit record highs, but gold priced in euros (XAU/EUR) did not. In fact, at gold’s peak this week the euro-priced ounce “held beneath spring highs” even as the USD-priced ounce broke out . Gold in British pounds and Japanese yen did notch new records alongside USD gold , but the euro-denominated price lagged.
This discrepancy between XAU/USD and XAU/EUR is telling. Had the rally been driven purely by U.S.-centric fears (Trump/Fed turmoil) causing a weak dollar, we would expect the opposite – gold might jump in USD but soar even more in euros as the dollar falls. Instead, the dollar strengthened against the euro, and gold’s rise in USD terms outpaced its rise in EUR terms. One interpretation is that some of the buying came from investors shifting capital out of euro assets and into dollar-based gold, effectively boosting both gold and the dollar simultaneously. In other words, capital flight from euro-based holdings could be an underlying factor. If European investors (or global investors with euro exposure) moved funds into U.S. dollars or dollar-priced gold, that would drive the dollar higher at the same time as gold – precisely what we saw.
It’s notable that earlier in the year, gold in euros had spiked to record levels (during a bout of euro weakness and regional banking worries), whereas U.S. gold lagged at that time. Now the roles reversed: “the dollar price topped its previous high, but the euro price of gold stayed below its spring peak” . This reversal suggests the latest rally was U.S.-led, not euro-led. Rather than a panic specifically within Europe, this feels like a more subtle rotation away from the euro toward “safe” currencies and assets. The euro’s exchange rate was relatively firm during this gold spike (indeed, gold’s jump was despite a firm dollar, not because of a weak one), implying the move wasn’t about a collapsing euro – it was about proactive reallocation. In essence, global investors may be quietly diversifying out of euros into gold (and dollars) as insurance against potential eurozone troubles down the line.
Speculators Pile In: CFTC Data Shows Growing Longs
Fueling gold’s ascent has been a wave of speculative positioning in the futures market. The Commodity Futures Trading Commission (CFTC) Commitments of Traders (COT) report reveals that hedge funds and money managers have been steadily adding to bullish gold bets. In fact, bullish bets are at their highest levels in years. As one market analysis noted, “the net long position of Managed Money traders rising… back to 4-year high… reaching 155% of long-term average” . This means speculators hold vastly more long contracts than usual, a clear sign of momentum-chasing and confidence in further upside.
Recent data confirms the build-up: speculators’ net-long gold positions jumped to around 237,000 contracts in mid-August (versus ~178,000 in early 2024) and remain elevated . For context, that mid-August figure was the largest net long in at least four years. Even trend-following funds that had been absent are now “firing on all cylinders,” adding to length as gold broke out. Importantly, while these speculative inflows are large, some analysts point out they are “relatively modest… given the move in gold prices – suggesting there is further upside to come” if more investors pile in . In other words, positioning is bullish but not yet at extreme record levels in proportion to gold’s price move, leaving room for additional buyers.
This surge in paper gold interest highlights that the rally has a strong “hot money” component. It’s not just passive safe-haven holding; fast-moving traders are actively driving the market higher. The rising COT longs also underscore why gold’s jump defied the dollar: in a typical risk-off scenario, one might see short covering or flight from other assets incidentally lift gold, but here we have an affirmative speculative buildup anticipating higher gold ahead.
Massive ETF Inflows: GLD and Silver ETFs See Big Demand
Alongside futures activity, investment flows into gold and silver exchange-traded funds (ETFs) have been massive, indicating broad-based demand from institutions and retail investors alike. The flagship gold ETF, GLD, saw particularly eye-popping inflows. In the week of the surge, GLD attracted roughly $2.3 billion of new money, making it “the No.1 asset gatherer among U.S.-listed ETFs” . To put that in perspective, GLD outdrew even the largest stock index funds for the week – a remarkable rotation of capital into precious metals.
These inflows pushed GLD’s total assets to new heights, as investors sought the convenience of paper gold exposure during the rally. Other precious metals funds saw similar interest: iShares’ silver trust (SLV) reportedly logged sizable inflows as silver prices jumped in unison with gold. Silver’s rally – over 10% in a week to above $40/oz – was the strongest in years, and analysts noted that “momentum traders obviously also became involved” once silver broke technical levels . The U.S. government’s proposal last week to classify silver as a critical mineral (which could spur domestic stockpiling) “helped to fuel the surge through $40” , giving fundamental justification to silver’s move and further enticing ETF investors.
Taken together, the ETF data paints a picture of widespread investment allocation into precious metals. Gold-backed ETFs globally had already been seeing positive inflows in recent months – the World Gold Council reported that the first half of 2025 saw the largest H1 gold ETF inflows since 2020 – and this past week accelerated that trend. The demand was not confined to the U.S. either; European-listed gold funds also saw creations (with particularly strong buying in the UK, Switzerland, and Germany in recent months) . But the U.S. flows were dominant. North American funds accounted for the bulk of new gold ETF buying this quarter , reflecting that U.S. investors are driving this shift to hard assets.
Such massive ETF inflows, alongside record futures longs, indicate a broad conviction trade into gold and silver. Whether as an inflation hedge, a geopolitical hedge, or a play on future Fed easing, capital is pouring into these assets via easily accessible vehicles. GLD’s $2+ billion weekly haul underscores that this was not a niche move – it was front and center in capital markets.
Not a Typical “Risk-Off” – Stocks, Crypto and Bonds Stayed Resilient
Crucially, unlike many past gold spikes, this one did not coincide with a major selloff in other asset classes. In classic market panics, gold’s rise is often mirrored by tumbling equities, collapsing bond yields (as investors buy Treasuries), or even a rush out of speculative assets like cryptocurrencies. That didn’t really happen here – indicating this gold rally was driven by rotation of capital from cash or low-yield reserves, rather than forced liquidations elsewhere.
Consider the stock market: global equities barely blinked. The MSCI World Stock Index had just hit an all-time high in late August; it fell only about 1.5% from that peak during gold’s run-up . A 1.5% dip is trivial – essentially normal daily volatility – and U.S. indices similarly remained near record levels. There was no sense of an equity crash or widespread fear in stocks; in fact, some risk assets like small-cap stocks rose on hopes of Fed rate cuts. Crypto markets were also relatively stable. Bitcoin and other major cryptocurrencies held in their recent trading ranges with no signs of a flight-to-safety out of crypto. Unlike early 2020 (when Bitcoin plunged during a dash for cash), this time crypto was “largely unfazed”. If anything, crypto investors likely interpreted Fed dovishness as positive, which could have buoyed coins – but there was no mass exodus from crypto into gold.
Bonds told a more nuanced story. U.S. Treasuries did not rally alongside gold – in fact, long-term bond prices fell last week, sending yields higher . Typically, if there were a major fear-driven episode, one would expect Treasury yields to plunge (as bond prices rise on safe-haven buying). Instead, the 10-year and 30-year yields ticked up. Notably, gold and bonds moved in opposite directions: “the split between government debt and gold prices has been underway, with gold rising… while the value of longer-term Treasury bonds has halved over five years” . Part of last week’s bond weakness was due to fresh concerns about fiscal deficits and inflation – which ironically can boost gold. A fund manager at Newton noted that the bond market isn’t yet signaling long-term inflation, but “there is falling confidence that can continue indefinitely”, characterizing the situation as a “fiscal crisis, rather than an economic crisis” driving gold’s rise . In short, gold’s jump wasn’t the result of a panic-driven bond rally – if anything, it coincided with a bond selloff. That implies the money fueling gold had to come from elsewhere (cash, forex reserves, or rotation out of other holdings) rather than from investors dumping stocks and bonds in fear.
This cross-market resilience supports the idea that the gold/silver inflows were more of a strategic reallocation or hedge, not a reaction to an acute crash in other assets. As one analyst put it, “If you were a Martian observing this, gold and long-term bonds sending opposite signals is telling you there are concerns” below the surface – but it’s an unusual mix of signals. Investors didn’t run for the exits in equities or corporate bonds; instead, they appear to have drawn on sidelined cash or reallocated currency reserves to fund their gold purchases. This makes the episode more interesting: it hints at a rotation happening quietly, rather than an obvious crisis visible in all markets.
Beyond the Trades: Is Capital Fleeing the Eurozone?
These patterns – U.S.-led gold buying, euro underperformance, no broad risk asset selloff – point to a deeper macro narrative: a potential rotation of capital out of Europe’s financial system and into hard assets. Several data points and developments reinforce this interpretation:
Reserve Currency Shifts: In a striking milestone, gold has now surpassed the euro as the world’s second-largest reserve asset (behind only the U.S. dollar). An ECB report highlighted that for the first time ever, gold represents a larger share of global foreign exchange reserves (20%) than the euro (16%) . In other words, central banks collectively hold more value in gold than in euro-denominated assets. This reflects concerted gold accumulation (over 1,000 tonnes per year since 2022, more than double the prior decade’s average ) at the expense of fiat holdings. It’s effectively a rotation out of traditional currencies – notably the euro – and into bullion. Such a shift “is remarkable”, as one market veteran noted, and coincides with 95% of central banks stating they plan to increase gold reserves in the next year – the highest on record . This trend screams a subtle mistrust in the long-term stability of the euro and other fiat assets, and a desire for the safety of hard currency.
Eurozone Stress Signals: While the eurozone isn’t in open crisis, there are hints of structural stress that may be nudging smart money to preemptively seek safety. Political instability is one concern – for example, in France (the Eurozone’s second-largest economy), the government is teetering on the edge of collapse amid budget battles. Even ECB President Christine Lagarde cautioned that “any risk of a government falling in the euro zone a concern”, after French markets wobbled on snap election fears . Such political tremors feed into a narrative of euro-area fragility. Meanwhile, European banks and governments are grappling with high debt loads and thin margins. As interest rates rose this year, sovereign and corporate borrowing costs in Europe jumped, exposing vulnerabilities in heavily indebted nations. Observers have warned of “debt saturation” and precarious leverage in Europe’s financial system (some even pointing to bloated gold derivatives positions at European banks as a risk) . If investors – or other central banks – perceive even a small chance of a Eurozone financial accident (be it a debt crisis, a bank failure, or political rupture), they may quietly trim exposure now.
Geopolitical Fragmentation and Inflation Hedging: Beyond Europe-specific issues, the broader macro backdrop is one of fracturing globalization and lingering inflation – conditions under which hard assets historically thrive. Under President Trump, the U.S. has upended elements of the post-WWII order, from trade alliances to security commitments . Trade wars and tariffs are forcing reallocations of supply chains and reserves. According to Reuters, Trump’s aggressive policies and sanctions have “upended Western security policy” and contributed to an environment where diversifying away from reliance on any single currency (especially the U.S. dollar) becomes prudent . Many developing countries have responded by boosting gold holdings as a hedge against geopolitical risks and potential sanctions (a lesson learned after Russia’s USD reserves were frozen in 2022) . This “de-dollarization” impulse, interestingly, often doesn’t benefit the euro – it benefits gold. Nations looking to reduce dollar dependence aren’t rushing into euros; they’re buying bullion (and to some extent, yuan) . This adds to global gold demand independent of day-to-day traders.
At the same time, inflation remains a concern. Though off its peak, inflation in both the U.S. and Europe has been stubbornly above central bank targets, eroding trust in fiat purchasing power. Gold is the classic inflation hedge, and its appeal grows when investors worry that “there are concerns… the right tail of inflation risk” in the future . Notably, this gold rally occurred even as inflation expectations in bond markets remained relatively contained – suggesting some investors aren’t waiting for official signals; they are positioning early against the possibility of inflation or currency debasement down the road. The fact that inflation-linked bonds have not rallied (underperforming regular bonds) implies the bond market isn’t convinced inflation will run away . But gold’s surge could be seen as a belts-and-suspenders approach – insurance in case the bond market is wrong or central banks falter.
Hard Asset Accumulation by Private Wealth: It’s not just central banks. Wealthy individuals and institutions are also shifting into tangible assets. Anecdotally, vault operators report high demand for physical gold storage. Real assets from commodities to real estate are getting increased allocation in portfolios as a hedge against both inflation and geopolitical strife. Silver’s inclusion on a U.S. critical minerals list last week (to secure supply chains) is emblematic of the new era of resource nationalism and strategic stockpiling . Gold and silver stand to benefit as strategic assets in a fragmenting world. The rally in both metals might be an early sign of investors preferring the certainty of hard assets in hand over promises on paper.
All these factors converge to a clear insight: the gold and silver surge may be an early warning signal of capital seeking safety from systemic risks – particularly those emanating from currency systems and financial institutions. Unlike a sudden crisis that causes a panicked stampede, this feels more like a strategic redeployment of capital: a rotation before the full storm hits.
Conclusion: A Canary in the Coal Mine?
Gold’s extraordinary run this past week – soaring in concert with a firm dollar, absent a stock market crash – is not just a one-off curiosity. It appears to be a manifestation of deeper shifts in investor behavior and economic regime. The simple story of “Fed drama and political turmoil” belies the larger context: we are likely witnessing a rotation toward safety and solidity in anticipation of future turbulence. Whether that turbulence comes from Europe’s financial system, unsustainable government debts, or a fracturing global order, investors are hedging their bets.
Precious metals are, in effect, serving as a barometer of macro stress and a receptacle for capital seeking refuge. As the European Central Bank’s own analysis noted, “gold generally offers a safe haven in times of stress… in extreme cases, gold prices tend to rise alongside the US dollar, while stock and bond prices decline” . That’s essentially what we’ve just observed – minus the sharp stock decline (at least so far). It puts policymakers on notice: something is bubbling beneath the surface. The last time we saw gold and the dollar rising together was during episodes like the onset of COVID-19 and the 9/11 attacks – clear crises. This time, the “crisis” is more subtle: a slow burn of fiscal strains, geopolitical realignments, and creeping distrust in institutions.
For investors and professionals, the takeaways are clear. Diversification into hard assets is gaining momentum, and not without reason. Gold’s role as a portfolio stabilizer is reasserting itself; even at record nominal prices, it’s attracting huge inflows as a form of insurance. The traditional inverse relationship with the dollar is not sacrosanct – when confidence in both major fiat blocs (dollars and euros) is tested, gold can rise against all currencies at once. Silver’s concurrent jump and its industrial strategic importance highlight that this is a broader precious metals renaissance.
Finally, it’s worth pondering the source of the $200 gold move. The evidence suggests it came not from panic, but from prudence – a reallocation from the quiet corners of cash and currency reserves into the safety of bullion. If that is the case, this gold surge could very well be the early tremor before larger quakes. Investors are effectively voting with their wallets, and their message is a cautious one: prepare for potential storms by holding real assets. Gold’s unusual rally, defying the dollar gravity, might be the canary in the coal mine for broader shifts to come – from an era of easy money and faith in central banks to one where tangible value and trust (or the lack thereof) drive decisions. As always, gold is both a barometer and a beneficiary of such paradigm shifts.
Sources:
Reuters – “Gold hits a record $3,532…main drivers fueled by U.S. President Trump’s upending of policy and Fed independence concerns.”
ETF.com – “GLD led all ETFs last week, hauling in $2.3B as gold flirted with $3,500.”
Reuters – “Gold tops $3,500… FT: ‘Gold surges after Trump’s Fed pressure’… Bloomberg: ‘Record high as rate-cut bets fuel demand.’”
BullionVault – Order flow: “Asian gold ETFs shrank…while European and North American products have now expanded together in 7 of the past 8 weeks, the strongest stretch in 27 months.”
Reuters – Physical market: “As gold prices jump… customers race to cash in old jewellery… If the rush to sell continues, could temper gold’s rally.”
BullionVault – “Dollar gold hit new highs…but Euro and Yuan price of gold held beneath spring highs”
BullionVault – COT data: “Net long position of Managed Money traders 4-year high…155% of long-term average.”
Reuters – “Silver breached $40, highest since 2011… momentum traders involved after US proposal to label silver a critical mineral helped fuel the surge.”
BullionVault – “Western stock markets dropped only 1.5% from last week’s record… long-term gov’t debt fell, driving yields higher, even as gold rose.”
ECB Financial Stability Review (via Frank Holmes) – “Gold now represents 20% of global FX reserves vs 16% for the euro – first time gold’s share exceeds euro’s.”
Reuters – Christine Lagarde: “France is solid but any risk of a government falling in the euro zone is a concern.”
Reuters – “Annual central bank gold purchases have exceeded 1,000 tons since 2022, double the 2010s average”
World Gold Council – “Gold ETFs saw 397t inflows Jan-June 2025, the largest first-half inflow since 2020.”
ECB Research – “In extreme cases (9/11, pandemic onset), gold prices tend to rise alongside the US dollar while stock and bond prices decline markedly – confirming gold’s safe-haven role in times of stress.”
- Gold trades near record highs on US rate cut bets; silver at 14-year high | Reuters
- Gold Surpasses Euro as the Second-Largest Reserve Currency in the World
- What does the record price of gold tell us about risk perceptions in financial markets?
- Gold Tops $3500 Record Price | Gold News
- Gold ETF Inflows Lead $34.3B Surge Into U.S.-Listed ETFs
- Gold ETF Investing Flips from East to West | Gold News
- After the gold rush: Asian, Mid-East sellers flood jewellery market | Reuters
- Central bank demand propels safe-haven gold to record peak | Reuters
- Explainer: Gold's record-breaking rally: who's keeping it going? | Reuters
- Global flows stay hot | World Gold Council
- France's far-right RN says it is getting ready for potential snap elections | Reuters
- Eurozone Financial Crisis: Debt and Derivative Dangers

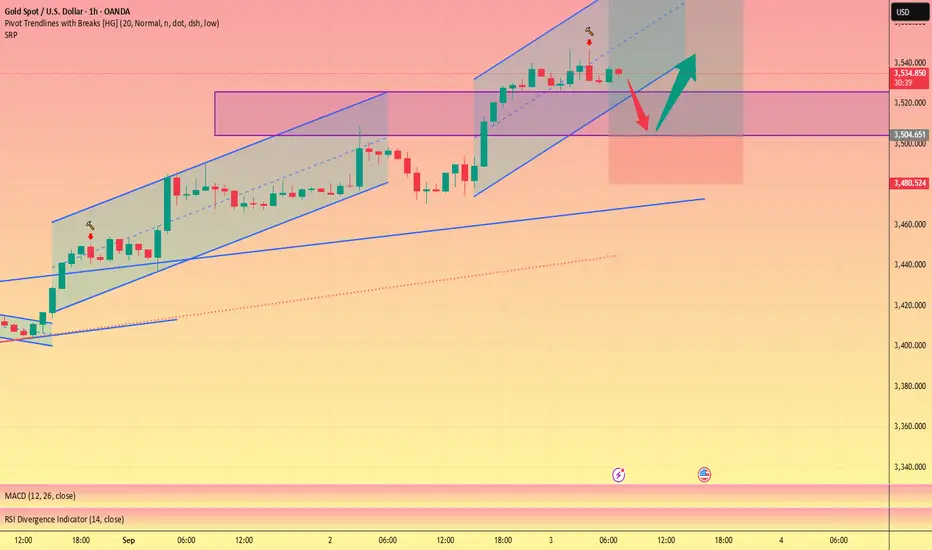
3500 is the key, go long when it retracements and stabilizes#XAUUSD
Before the release of NFP data, gold prices continued to rise on the daily chart and remained stable near the upper limit at the morning opening. 🐂The current market is in an extreme situation. Before there is a clear direction, we always maintain a cautious attitude towards buying. Currently, it is near a historical high and the market is bullish. Once you chase high prices easily, it will be more dangerous and you will easily suffer losses.📊
Judging from the 4H chart, since gold rose to 3500, this point has changed from resistance to support.🥅 No matter whether gold continues to rise or fall, it must touch this point to establish a clearer short-term direction. Therefore, we will definitely not participate in the current trading around 3535.⚠️ If we want to participate in the short term, I suggest referring to 3525-3500 and wait for it to stabilize before taking long orders with a small position in batches. Otherwise, there will definitely be risks. The short-term target can be seen at 3550-3560.📈
Gold (XAU/USD) 3 September, 20251. Macro Outlook (Daily)
Gold continues to maintain a bullish macro structure, with consecutive higher highs (HH) and higher lows (HL) defining the trend. The most recent Break of Structure (BOS) above the $3500 handle confirms sustained upward momentum. Liquidity remains positioned above $3560 – $3575, where equal highs and untested buy-side liquidity are waiting to be taken.
The daily bias is therefore firmly bullish unless $3490 is broken, in which case deeper retracements may emerge.
2. Swing Structure (4H)
On the 4H chart, gold is respecting bullish order flow:
Liquidity below $3515 – $3505 remains vulnerable for inducement sweeps.
A fresh Fair Value Gap (FVG) $3518 – $3508 is unmitigated.
A bullish Order Block (OB) $3512 – $3500 serves as structural demand.
Together, these form a discount zone in alignment with the daily bias, offering high-probability continuation setups.
3. Execution Refinement (1H)
The 1H chart sharpens execution:
OTE retracement cluster $3520 – $3510 aligns with the 61.8–78.6% retracement of the last impulse.
Asia low at $3528 has been swept, providing inducement for London and NY session continuation.
Anchored VWAP from the weekly open sits at $3518, reinforcing institutional demand.
This confluence tightens the execution-ready buy zone for today.
4. Execution-Ready Zones
🔵 Primary Buy Zone (Golden Zone)
Entry: $3520 – $3510
Stop Loss: $3495
Rationale: Supported by daily bullish bias, fresh 4H OB, 4H FVG, 1H OTE, liquidity sweep, VWAP alignment, round number support, and resting liquidity.
Bias: High-probability long setup, >8 institutional confluences.
🔵 Secondary Buy Zone
Entry: $3505 – $3495
Stop Loss: $3480
Rationale: Deep discount, OB extreme, and structural inducement.
Bias: Backup long zone if deeper retracement occurs.
🔴 Primary Sell Zone
Entry: $3560 – $3575
Stop Loss: $3585
Rationale: Liquidity grab above equal highs, premium array, and supply confluence.
Bias: Countertrend fade, scalp only.
🔴 Secondary Sell Zone
Entry: $3595 – $3610
Stop Loss: $3625
Rationale: Weekly high liquidity, premium overextension, and 161.8% extension cluster.
Bias: Opportunistic fade; not suitable for swing shorts.
5. Risk Management & Profit-Taking Strategy
Instead of rigid pip targets, traders should adopt liquidity-based scaling:
Partial exits at session highs/lows (Asia, London, NY).
Major targets at daily/weekly liquidity pools (equal highs, equal lows, imbalance fills).
Leave runners open toward higher-timeframe liquidity magnets — notably $3800.
This approach ensures alignment with institutional order flow while capturing both intraday and swing opportunities.
🌟 Golden Zone of the Day
$3520 – $3510 (Buy Zone)
Backed by 8+ institutional confluences across Daily, 4H, and 1H.
Provides the highest-probability entry point for continuation of the prevailing bullish trend.
6. Strategic Conclusion
Gold’s current price action confirms institutional bullish order flow. Demand zones in the $3520 – $3510 region represent the most compelling setup for today, offering clean alignment across Daily, 4H, and 1H.
Countertrend shorts remain viable only at liquidity clusters near $3560 – $3575 and $3595 – $3610, but should be managed conservatively given the macro bullish context.
Professional traders should prioritize long exposure, scaling out at liquidity levels while leaving runners toward untested buy-side objectives higher up the curve.
📌 Institutional Note: Unless the $3490 level is breached, the path of least resistance remains higher, with liquidity objectives above $3560 – $3575 as the next upside magnet.

Quarterly Shit Analysis - Sept - Dec 2025 - XAUUSDMy last three quarterly analysis proved correct. In the last analysis, I predicted that gold will move within a range, it did happen.
For the new quarter, here is my new analysis. Between 14 Aug 2025 to 01 Sept 2025, I expect the following:
1- Scenario 1: Bullish Trend
Since May 2025, #XAUUSD has created good bullish indications on the Daily and Weekly Charts. Therefore, it could start a new trend.
Conditions: Gold must close a strong bullish daily candle above 3452 first , then another strong daily bullish candle above 3500. The closure of a strong daily candle above 3452 should happen between 14 Aug to 01 Sept. The closure of the daily candle above 3500 is fine to happen after September 1st.
Targets: If the conditions above are met, Gold will start a new bullish trend. The targets will be: 3668, 3750, 3840 and 4,000 or 4043.
If Gold closes a strong daily candle above 3500, the ideal support lines to buy gold will be 3451, 3400, 3364, 3330 and 3300. The best support line, if Gold makes deep retracements will be 3228 and 3162.
2- Scenario 2: Expanded Range (Likely Scenario)
The range for the previous quarterly analysis was from 2956.5 to 3500, but for most of the past months since May 1st, Gold has been moving between 3262 to 3452. It is possible that Gold remains in the wider range (2956.5 to 3500), but makes wider moves. This scenario is possible because gold already reached a historic high in April and then entered a wide range, therefore it is possible to remain in the same range for the rest of the year.
This means gold could make deeper retracements into 3228, 3168, 3092, and 3024 and then go up towards, 3330, 3364 and 3452. When it reaches 3300, 3364 and 3452, then it starts new bearish moves again.
Conditions: Gold fails to close daily bullish candles above 3500 and fails to close daily bearish candles below 2956.5. The ideal condition is if gold closes a strong daily bearish candle below 3228 or 3162 between 14 Aug to 01 Sept 2025.
3- Scenario 3: Bearish Move (Unlikely Scenario):
If Gold closes a strong daily candle below 2956, then it will start a surprising bearish trend and will move towards: 2812, 2640 and 2550. This is not a likely scenario.

GOLD H1 STRUCTURE Gold Buying Zones We Have
TRENDLINE BUY : 3503
FVG AREA BUY : 3509, 3492
ORDER BLOCK : 3448, 3442
ORDER BLOCK : 3408, 3403
These Are Our Buy Zones
Hope You Understand Thanks For Here Follow Us For More

Gold (XAUUSD) Intraday Analysis – September 3, 2025On the H1 timeframe:
Gold has broken out strongly from the accumulation zone around 3,370 – 3,380 USD/oz and is moving within a rising channel.
The price is now testing the key resistance zone at 3,535 – 3,540 USD/oz, which is acting as a short-term ceiling.
Short-term EMAs remain bullish, confirming upward momentum. However, RSI on H1 is entering the overbought territory, signaling a potential short-term pullback.
Fibonacci retracement of the latest leg up (3,380 → 3,535) highlights important support levels at:
3,500 USD (Fibo 23.6% + EMA confluence)
3,470 USD (Fibo 38.2%)
3,440 USD (Fibo 61.8%)
Key Levels:
Resistance: 3,535 – 3,540 | 3,560 (extension)
Support: 3,500 | 3,470 | 3,440
Intraday Trading Strategies:
Trend-following long setup:
Look for buy opportunities on a retracement to 3,500 – 3,470, targeting 3,535 – 3,560.
Stop loss below 3,440.
Counter-trend short setup:
If price fails to break above 3,540 and a reversal candlestick forms on H1, consider a short entry around 3,530 – 3,535.
Target back to 3,500 with a stop loss above 3,545.
Outlook:
The primary bias remains bullish as long as price holds above 3,470. However, the overbought condition suggests a corrective move may come before the next breakout. Traders should focus on Fibonacci zones for precise entries.
- Follow closely to catch the next move, and save these levels for your trading plan today .

XAUUSD: Ready for the Next Breakout?Hello, let’s take a broader look at OANDA:XAUUSD together.
Last Friday, gold surged strongly. The precious metal is now moving around 3447 USD and has become more attractive than ever.
So, what’s next for gold?
From an economic and market perspective, gold is benefiting from ongoing uncertainties, global conflicts, and speculation about the FED’s upcoming rate cuts. The weakening USD has been the driving force behind gold’s continued rally at this stage.
Technical outlook: Gold has just broken higher and is now facing its all-time highs. The formation of an ascending triangle is approaching its climax, and XAUUSD may break out to test higher levels. The answer is only a matter of time. A candle close above the resistance zone will be something to watch for, with the first psychological target at the 3500 USD round level.
Given the current setup, I’m waiting for XAUUSD to push through resistance.
What about you—what do you think will happen? Share your thoughts in the comments.
Good luck!

Silver XAGUSD Overextended With Range-Bound Price Action🥈 XAGUSD (Silver) is overextended in my view 📈. Price has recently pushed into new highs 🔼 and is now moving sideways in a range 📊—often a sign that larger entities 💼 may be working their orders.
⚖️ This could be a form of distribution, as silver has moved into a zone of thin liquidity 🌊. To facilitate bigger positions, institutions may need to generate liquidity by keeping price sideways ⏸️ before the next move.
📉 My current bias is for a retracement back into equilibrium ⚖️ and towards an unresolved bullish imbalance 🔍 that remains below.
⚠️ This is for educational purposes only, not financial advice 📚

GOLD SELL CMP 3539 Short term corrective sell for aggressiveGOLD SELL CMP 3539 Short term corrective sell for aggressive Traders. Gold has given a breakout . now its time to retest the break out area so called corrective trade, so aggressive entry in opposite direction against the Higher time trend .

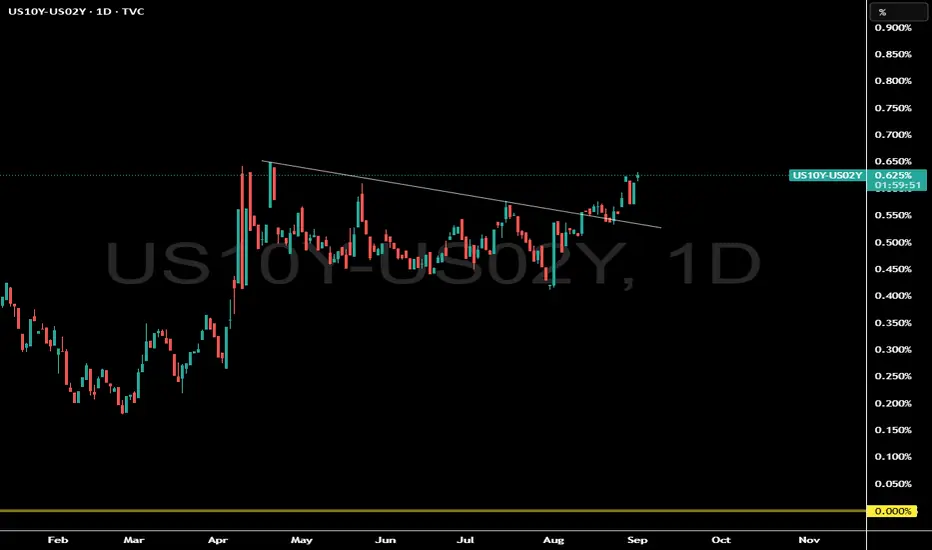
The Most Bullish Chart in the stock marketWhat does this 10 year yield and 2 year yield chart represent?
Is the bond market signaling a big economic event?
This bond market signal has a 100% success rate...but timing is the hard part since its a monthly long term signal.
Wait until we make a new pivot high in this chart...we should see some fireworks.
If you need to know what this means subscribe to our Youtube channel Where we often discuss macro economics and equites.
Will gold break through $3,500 on September 2nd?
I. Core Fundamental Drivers
Expectations of a Fed Rate Cut Strengthen:
Market expectations for a September Fed rate cut have risen to over 87%. Fed Chairman Powell has previously signaled a dovish stance, suggesting an openness to a rate cut. If the interest rate cut is implemented, it will weaken the attractiveness of the US dollar, reduce the opportunity cost of holding gold, and be good for gold prices.
Safe-haven demand surges:
The dismissal of a Federal Reserve governor has raised questions about the Fed's independence and weakened confidence in US dollar assets.
Geopolitical tensions and continued global economic uncertainty (such as tariff policies and recession concerns) have driven funds into gold as a safe haven.
II. Key Technical Levels
Current Price: Spot gold is trading around $3,475 (yesterday's high of $3,489), approaching the historically important $3,500 level.
Support Levels:
Major support: $3,460-3,450 (short-term strength/weakness dividing line). Key Support: $3440 (recent low, trend-sustaining lifeline).
Resistance:
Near-term resistance: $3490-3500 (historical high breakout level).
Targets after a breakout: $3530, $3580 (bullish extension targets).
Technical Pattern:
The daily chart is at the end of a converging triangle and has broken upwards. Both the weekly and monthly charts closed with large bullish candles, indicating strong bullish momentum.
III. Short-Term Trading Strategy
Long Strategy:
Entry Time: Go long after a pullback to the 3460-3450 area and stabilization (conservative traders can arrange long orders in batches).
Stop loss setting: below $3440 (if it falls below this level, the trend will weaken).
Target Range: $3490-3500 (hold for a target of $3530+ after a breakout).
Short Strategy:
Participate with a light position only when a rebound encounters resistance: Short sell after a stagflation signal appears in the 3490-3500 area. Stop loss setting: above $3505.
Target range: $3470-3460 (quick entry and exit, betting on technical pullbacks).
Buy on breakouts:
If the price breaks through the $3500 level, you can buy with a small position, targeting $3530-3550.
IV. Risk Warning
Historical seasonality: Over the past 10 years, the probability of a gold price decline in September has been 70%. Be wary of "good news exhaustion" and technical false breakouts.
Position Management: Limit risk per trade to 2%-5% of total capital, and avoid buying heavily at high levels.
If expectations of a Fed rate cut reverse or geopolitical risks ease, gold prices could face a deep correction.
Summary: The short-term bullish trend remains unchanged. The operation is mainly to go long on pullbacks, with a focus on the breakthrough of the 3460-3450 support and the 3500 mark. Be cautious and strictly control risks before the release of non-farm data.

Explaining Fibonacci Retracement/Extension levelsThis video is designed to help teach you why I use the Fibonacci Defense levels as components of price action and how I use Fibonacci retracement/extension levels (related to previous market trends).
Remember, the three components of price action are TIME, PRICE, & ENERGY.
If you don't understand how price is structured before attempting to use Fibonacci concepts, it's almost like trying to throw darts blindfolded.
You must break down the previous trends in order to try to understand what is happening with current price trends (expansion/contraction/phases).
Watch this video and I hope it helps all of you understand what the markets are doing and how to use Fibonacci Retracement/Extension levels more efficiently.
All types of technical analysis are validation tools - not guarantees. The only thing we get out of technical analysis is a way to validate or invalidate our expectations. A or B. Nothing else.
Get some.
#trading #research #investing #tradingalgos #tradingsignals #cycles #fibonacci #elliotwave #modelingsystems #stocks #bitcoin #btcusd #cryptos #spy #gold #nq #investing #trading #spytrading #spymarket #tradingmarket #stockmarket #silver

XAUUSD Gold Intraday Setup 02.09.2025Gold is currently trading at 3473, after hitting new ATH around 3508, now testing into a key demand zone. Price has shown a corrective move after the recent bullish impulse and is reacting from a consolidation order block.
Key Levels:
First buy zone: 3469–3473 → aligns with immediate demand and prior accumulation.
Second buy zone (deeper retracement): 3449–3454 → lower demand zone + strong support base.
Structure & Bias:
Market structure remains bullish with higher highs and higher lows intact.
Current pullback is corrective in nature, tapping into demand zones.
Liquidity below minor lows (around 3470 and 3450) could be swept before a strong bullish continuation.
Targets:
First target: 3492 (recent high/intraday resistance).
Second target: 3508 (swing high, liquidity pool).
Trade Plan:
Look for bullish confirmation (rejection wick, engulfing, or structure shift) in the 3469–3473 zone for a buy entry.
If price breaks below decisively, next long entry should be considered from the 3449–3454 zone.
Stop-loss ideally below 3460 for the first zone, and below 3435 for the second zone.
👉 In short: Bias is bullish; buy dips into 3469–73 or 3449–54, aiming for 3492 & 3508.

BUY GOLD
Gold is bullish...Price has been trading inside a long-term ascending channel and recently broke out of an ascending triangle consolidation near the upper midline of the channel. This breakout suggests continuation of the bullish trend, with potential upside toward the channel resistance around the $3,600 - 3,800 zone.

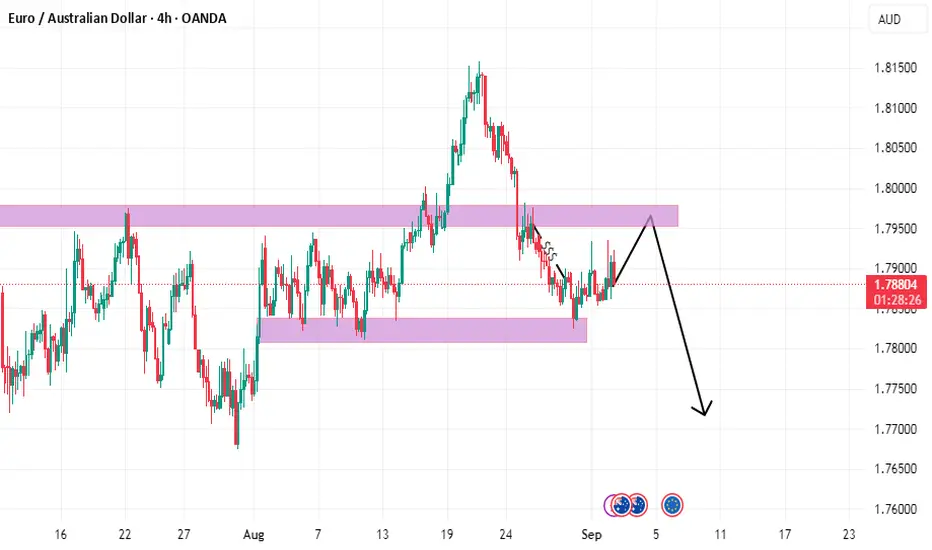
EURAUD What do you think?the general trend on the daily frame indicates an upward trend
so it will rise to take liquidity on 4h frame
then it will fall due to the formation of head and shoulders
and due to the strong resistance
GOLD (XAUUSD): The Next Potential Resistances
As Gold is now trading in a no man's land, here are
2 potentially strong resistances that I spotted.
Psychological Resistance 1: 3550
Psychological Resistance 2: 3600
The price is heading toward Resistance 1.
It will most likely be the next goal for the buyers.
❤️Please, support my work with like, thank you!❤️
I am part of Trade Nation's Influencer program and receive a monthly fee for using their TradingView charts in my analysis.

Gold | H1 Double Bottom | GTradingMethodHello Traders.
Welcome to today's trade idea by GTradingMethod.
🧐 Market Overview
Gold has been making higher highs while RSI has been making lower highs, which is known as negative RSI divergence. This is an indication of weakening buying strength. For further confluence, this potential double top is at the ATH level, which could provide further resistance.
📊 Trade Plan
Risk/reward = 2.9
Entry price = 3 497.6
Stop loss price = 3 515.5
Take profit level 1 (50%) = 3 456.4
Take profit level 2 (50%) = 3 431.9
💡 GTradingMethod Tip
Always predefine your risk for every trade and always accept this risk. If you accept the risk, there can be no emotional pain. If you do not get emotional, you will interpret the market's information objectively.
🙏 Thanks for checking out my post!
Make sure to follow me to catch the next idea and please share your thoughts - I would like to hear them.
📌 Please note:
This is not financial advice. This content is to track my trading journey and for educational purposes only.
