Gold 15M Analysis | Key Triggers Ahead💀 Hey , how's it going ? Come over here — Satoshi got something for you !
⏰ We’re analyzing AAVE on the 4-Hour timeframe timeframe .
👀 On the 15-minute timeframe, gold can be traded using these alarm zones.
Metals

GOLD ROUTE MAP UPDATEHey Everyone,
After completing Bullish Targets 3458 and 3477 yesterday, we got the EMA5 cross and lock above 3477, which opened 3497. That level was hit perfectly today. With no lock above, we confirmed the rejection, and now price is showing support and bounce at 3477.
We are now seeing play between 3497 and 3477 and will need ema5 cross and lock to confirm the next move.
We will keep the above in mind when taking buys from dips. Our updated levels and weighted levels will allow us to track the movement down and then catch bounces up.
We will continue to buy dips using our support levels taking 20 to 40 pips. As stated before each of our level structures give 20 to 40 pip bounces, which is enough for a nice entry and exit. If you back test the levels we shared every week for the past 24 months, you can see how effectively they were used to trade with or against short/mid term swings and trends.
The swing range give bigger bounces then our weighted levels that's the difference between weighted levels and swing ranges.
BULLISH TARGET
3458 - DONE
EMA5 CROSS AND LOCK ABOVE 3458 WILL OPEN THE FOLLOWING BULLISH TARGETS
3477 - DONE
EMA5 CROSS AND LOCK ABOVE 3477 WILL OPEN THE FOLLOWING BULLISH TARGET
3497 - DONE
EMA5 CROSS AND LOCK ABOVE 3497 WILL OPEN THE FOLLOWING BULLISH TARGET
3513
BEARISH TARGETS
3439
EMA5 CROSS AND LOCK BELOW 3439 WILL OPEN THE FOLLOWING BEARISH TARGET
3417
EMA5 CROSS AND LOCK BELOW 3417 WILL OPEN THE FOLLOWING BEARISH TARGET
3395
EMA5 CROSS AND LOCK BELOW 3395 WILL OPEN THE SWING RANGE
3369
3352
EMA5 CROSS AND LOCK BELOW 3395 WILL OPEN THE SECONDARY SWING RANGE
3336
3315
As always, we will keep you all updated with regular updates throughout the week and how we manage the active ideas and setups. Thank you all for your likes, comments and follows, we really appreciate it!
Mr Gold
GoldViewFX

GOLD: Long Trading Opportunity
GOLD
- Classic bullish formation
- Our team expects pullback
SUGGESTED TRADE:
Swing Trade
Long GOLD
Entry - 3483.1
Sl - 3479.3
Tp - 3491.7
Our Risk - 1%
Start protection of your profits from lower levels
Disclosure: I am part of Trade Nation's Influencer program and receive a monthly fee for using their TradingView charts in my analysis.
❤️ Please, support our work with like & comment! ❤️

GOLD: Strong Bullish Sentiment! Long!
My dear friends,
Today we will analyse GOLD together☺️
The market is at an inflection zone and price has now reached an area around 3,478.27 where previous reversals or breakouts have occurred.And a price reaction that we are seeing on multiple timeframes here could signal the next move up so we can enter on confirmation, and target the next key level of 3,484.06.Stop-loss is recommended beyond the inflection zone.
❤️Sending you lots of Love and Hugs❤️

XAU/USD | Breakout in Progress – Are You Ready for the Next ATH?By analyzing the gold chart on the 4-hour timeframe, we can see that, as expected from our analysis two days ago, the price began its bullish move from the $3383 zone and successfully hit all four targets at $3393, $3398, $3404, and $3409 — but it didn’t stop there! Gold continued its rally beyond those levels.
As anticipated in yesterday’s outlook, we closely watched the $3419–$3429 supply zone for a potential bearish reaction. When price reached $3424, it dropped to $3404, validating our second scenario as well. Although the drop could’ve extended further, the combined result of both scenarios delivered over 500 pips of total profit!
After hitting $3404, gold gained demand again — and with the release of the U.S. Core PCE data, this bullish trend strengthened, pushing price up toward its all-time high (ATH) near $3500. Gold is now trading around $3447, just 500 pips away from that historic level.
Given the increasing odds of a Fed rate cut in September, the bullish momentum is likely to continue. In my view, a new ATH for gold could be on the horizon in the coming weeks.
Hope this analysis helps you ride the wave — make the most of it! 💰📈
THE LATEST ANALYSIS 👇🏼
Will $3500 be the next stop for gold? 👀
👇 Drop your thoughts below & don’t miss the next update!

SILVER: Bears Are Winning! Short!
My dear friends,
Today we will analyse SILVER together☺️
The price is near a wide key level
and the pair is approaching a significant decision level of 40.381 Therefore, a strong bearish reaction here could determine the next move down.We will watch for a confirmation candle, and then target the next key level of 40.271.Recommend Stop-loss is beyond the current level.
❤️Sending you lots of Love and Hugs❤️

XAUUSD Buys at 3476 Now Perfect entry📍 XAUUSD Buy Alert – Sept 2, 2025
Gold just broke out above key resistance at $3,476, confirming bullish momentum. With Fed rate cut expectations and strong central bank demand backing the move, this entry looks 🔥 for short-term upside.
Bias: Strong Buy
Entry: $3,476
Target: $3,514 / $3,545
Support: $3,430
Note: Holding above $3,476 could trigger a run toward $3,700 in coming weeks.
Perfect timing for momentum traders—ride the wave while it lasts.

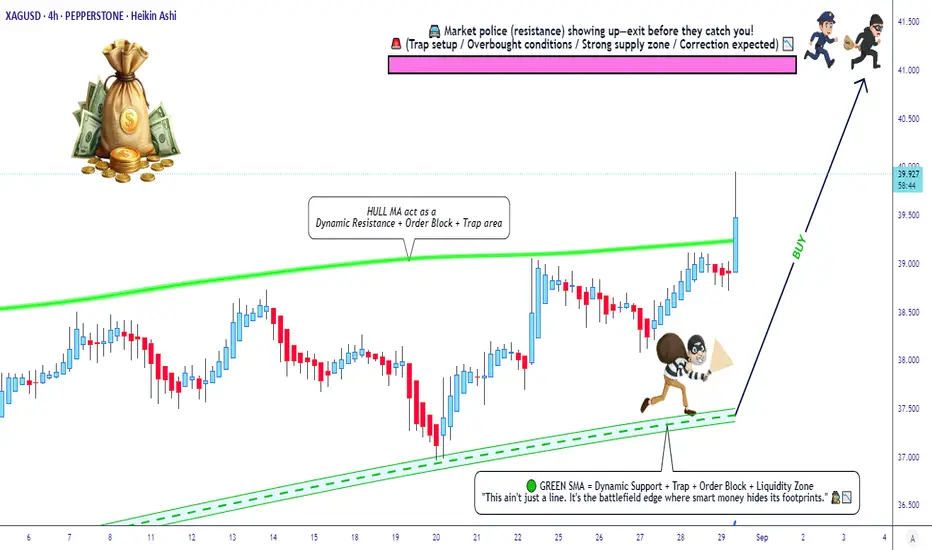
XAG/USD Market Robbery Plan – Entry, SL, and Escape Route💎 XAG/USD Silver vs U.S Dollar Heist Plan (Swing/Scalping Trade) 💰🚀
🌟Hello Money Makers, Robbers & Thief OG’s🌟
The vault is open… and this time it’s SILVER (XAG/USD)! ⚡
Based on our 🔥Thief Trading Style🔥, here’s the robbery blueprint:
📈 Entry (The Break-In):
The thief doesn’t wait at the door… we layer in quietly. Place multiple buy limit orders at:
(39.900)
(39.700)
(39.500)
(Feel free to add more layers if you want to expand the robbery bag 🏦).
Any pullback = our silent entry.
🛑 Stop Loss (Thief Escape Route):
This is Thief SL @38.700.
But remember, dear Ladies & Gentleman (Thief OG’s), adjust SL according to your own risk appetite & position size.
🎯 Target (The Police Barricade 🚓):
Police waiting heavy at 42.000 – so don’t get caught!
Our escape van target is set @ 41.000 💰.
Grab the loot and vanish before the chase starts! 🏃♂️💨
💎 Thief Notes:
Silver shines but can trap greedy robbers. Always layer in wisely, manage risk, and respect the Thief Code.
⚠️ Trading Alert:
Beware of sudden news explosions 📢 – they trigger alarms in the market vault! Use trailing SL if the loot gets heavy.
🔥💵 Support our robbery squad 💥Hit the Boost Button💥 to fuel the getaway car 🚘💨.
Every like = more strength for our crew. Stay sharp, stay stealthy, and keep robbing the market with Thief Trader Style! 🏆🥷💰
#SilverHeist #XAGUSD #ForexThief #SwingTrade #ScalpingPlan #LayeringStrategy #ThiefTrader #MarketRobbery #BullishSilver #SmartTrading
Gold Outlook: Record Highs vs Pullback RisksGold is approaching breakout confirmation toward new all-time highs, with daily RSI signaling overbought conditions. However, price action remains near a critical resistance zone needing further confirmation for a breakout; and, in times of heightened uncertainty, momentum indicators rarely constrain gold’s bullish potential.
• A clean hold above 3500 and 3,540 would confirm further upside toward 3,780 — the projected height of the 5-month consolidation — and potentially $4,000.
• On the downside, pullback risks may find support at 3,430, 3,410, and 3,360 before threatening a deeper reversal toward 3,260 or lower.
Written by Razan Hilal, CMT

GOLD Is Going Down! Short!
Here is our detailed technical review for GOLD.
Time Frame: 9h
Current Trend: Bearish
Sentiment: Overbought (based on 7-period RSI)
Forecast: Bearish
The market is on a crucial zone of supply 3,485.32.
The above-mentioned technicals clearly indicate the dominance of sellers on the market. I recommend shorting the instrument, aiming at 3,418.30 level.
P.S
Please, note that an oversold/overbought condition can last for a long time, and therefore being oversold/overbought doesn't mean a price rally will come soon, or at all.
Disclosure: I am part of Trade Nation's Influencer program and receive a monthly fee for using their TradingView charts in my analysis.
Like and subscribe and comment my ideas if you enjoy them!

Holding bullish trend, waiting for PMI to spark the next wave ⚓️ Captain Vincent – Gold Plan XAU/USD
1. Market Wave 🌍
The USD continues to weaken as investors increasingly believe the FED will cut rates in the coming months.
As the greenback loses appeal, big money is shifting away from cash into safe-haven assets → Gold emerges as the top choice .
👉 This supports a sustained bullish trend . If USD selling pressure continues, the market could witness new breakouts toward the year-end.
2. Technical Analysis ⚙️
On H2, Gold just made a Higher High after BOS , confirming buyers still hold the upper hand.
Golden Harbor 🏝️ (Buy Zone 3,450 – 3,452): Overlaps with old FVG, high liquidity area.
Quick Boarding 🚤 (OB ~3,470): Intermediate support, good spot for quick pullback entries.
Storm Breaker 🌊 (Sell Zone 3,538 – 3,540): Fib 0.618–0.786 resistance, profit-taking supply expected on retest.
👉 Intraday bias: Wait for pullback to Buy. Short-term Sell only if Gold tests Storm Breaker.
3. Captain Vincent’s Map – Key Levels 🪙
Golden Harbor 🏝️ (Buy Zone): 3,450 – 3,452
Quick Boarding 🚤 (OB Support): 3,470
Storm Breaker 🌊 (Sell Zone): 3,538 – 3,540
4. Trade Scenarios 📌
🔺 Golden Harbor 🏝️ (BUY – Priority)
Entry: 3,450 – 3,452
SL: 3,444
TP: 3,455 → 3,458 → 3,462 → 3,465 → 34xx
🔻 Storm Breaker 🌊 (SELL Reaction)
Entry: 3,538 – 3,540
SL: 3,548
TP: 3,535 → 3,532 → 3,529 → 35xx
5. Captain’s Note ⚓
"The golden sail still rides the bullish wind, but Storm Breaker 🌊 above may stir counterwaves. Be patient at Golden Harbor 🏝️ for the right entry, and keep eyes on PMI at 21:00 – the catalyst for the next wave."

SILVER (XAGUSD): The Next Resistance
Here is my latest structure analysis for Silver.
With a current bull, run the price successfully violated
39.0 - 39.5 supply area that turned into a demand zone now.
The closest strong supply zone that I see is based on a major
rising trend line and 41.0 psychological level.
It looks like the price may easily reach that soon.
❤️Please, support my work with like, thank you!❤️
I am part of Trade Nation's Influencer program and receive a monthly fee for using their TradingView charts in my analysis.

GOLD → False breakout at 3500. What next? 3400 or 3600?FX:XAUUSD updates its ATH on the spot market to 3508.5 and forms a false breakout, provoking liquidation and profit-taking. The imbalance in the market is changing, and a deeper correction is possible...
Gold updated its historical maximum above $3500, but faced a correction amid a short-term strengthening of the dollar. The market's attention is focused on the US ISM Manufacturing PMI data, which may determine further dynamics.
Key drivers: The probability of a rate cut in September is estimated at 90%, which supports gold. Pressure on the USD continues due to concerns about the independence of the Fed (pressure from Trump) and geopolitics. The escalation of the Russia-Ukraine conflict (new strikes by the Armed Forces of Ukraine on Russian territory) is increasing demand for defensive assets.
Ahead of the ISM Manufacturing PMI: Forecast — growth to 49 (but remains in the contraction zone). If the data turns out to be weaker, it will strengthen dollar sales and push gold to new records.
Resistance levels: 3485, 3500
Support levels: 3467.6, 3441, 3423
Technically, gold may enter a longer consolidation or correction. If the bears keep the price below 3490-3485, then in the short term, we can expect a decline to the specified support zones. I do not rule out the possibility of a retest of 3500-3505, but at the moment I do not see the potential for the market to continue growing (in the short term!).
Best regards, R. Linda!

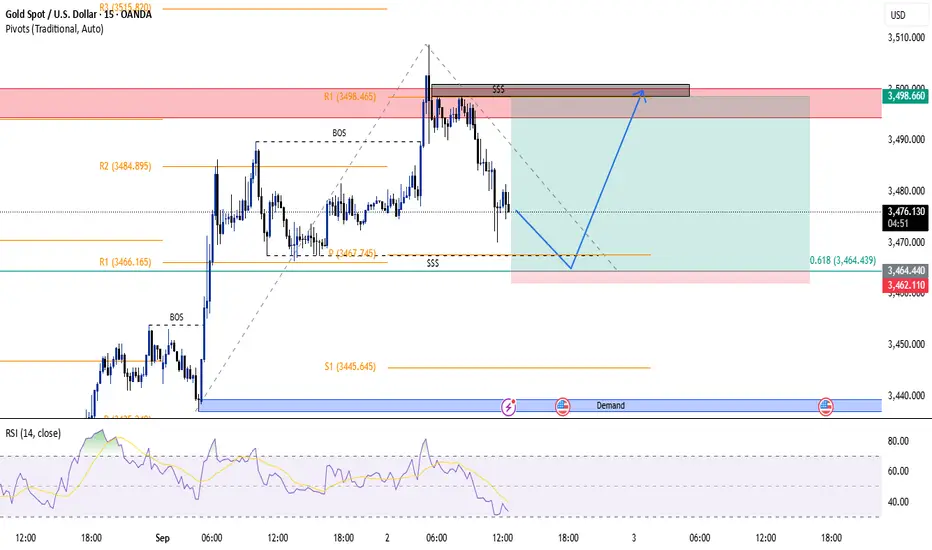
Gold Analysis – 15-Minute Timeframe (September 2, 2025)Based on a combination of my personal intuition and Smart Money Concepts (SMC), I expect the price to touch 3464 and then move upward.
✅ Reasons for this scenario:
Presence of a standard pivot around the 3464 level, which may act as a key support or resistance.
Liquidity buildup in that area, increasing the likelihood of inducement, which could fuel the upward move.
The magic Fibonacci ratio of 0.618 aligns perfectly with the last swing move, adding confluence to the setup.
📌 Entry Strategy: I plan to enter a long position upon spotting a rejection candle on the 1-minute timeframe.
Good luck and stay profitable
First Drop to 3307–3289, Then Buy for the Next UptrendOur system has identified a strong short signal across short-term, medium-term, and long-term timeframes as of July 3, 2025, with confidence levels above 89%. All durations are aligned, indicating a synchronized momentum shift.
Entry Point : 3354.43
Short-Term TP : 3334.30
Medium-Term TP : 3320.89
Long-Term TP : 3307.47~ 3289
📉 Based on the current market structure and signal convergence, TeconLab expects XAUUSD to drop into the 3307–3289 range, where a potential reversal zone is likely to form.
🛡️ Safest Entry for Buy: The 3289 level is considered the most favorable area for entering long positions after the expected correction completes.
📈 After reaching this zone, our system anticipates a new uptrend to begin, offering a fresh opportunity for upside movement.
The TP Zigzag path displayed on the chart outlines the projected decline with target steps, preparing for a potential bullish reversal afterward.

Gold Dips to 3,440:Dollar Weakness Sets Stage for the Next SurgeHey Traders, in today's trading session we are monitoring XAUUSD for a buying opportunity around the 3,440 zone. Gold is trading in an uptrend, with price currently correcting toward this key support/resistance level.
Structure: The broader bias remains bullish, but price is pulling back after recent highs.
Key level in focus: 3,440 — an important area where buyers may look to step in and resume the trend.
Fundamentals: The U.S. Dollar Index (DXY) is approaching 98.400 resistance while maintaining a bearish tone. A weaker dollar continues to provide support for Gold, reinforcing the bullish context.
Trade safe,
Joe.

Silver - Expecting Bullish Continuation In The Short TermM15 - Strong bullish momentum.
No opposite signs.
Until the two Fibonacci support zones hold I expect the price to move higher further.
If you enjoy this idea, don’t forget to LIKE 👍, FOLLOW ✅, SHARE 🙌, and COMMENT ✍! Drop your thoughts and charts below to keep the discussion going. Your support helps keep this content free and reach more people! 🚀
--------------------------------------------------------------------------------------------------------------------

Ok, we hit a new high... But what's next for gold?Gold overcome the the psychological 3500 zone today, forming a new all-time high. At the time of the video analysis, we are seeing a slight correction lower. That said, the near-term outlook still remains positive. Let's dig in.
TVC:GOLD
MARKETSCOM:GOLD
Let us know what you think in the comments below.
Thank you.
75.2% of retail investor accounts lose money when trading CFDs with this provider. You should consider whether you understand how CFDs work and whether you can afford to take the high risk of losing your money. Past performance is not necessarily indicative of future results. The value of investments may fall as well as rise and the investor may not get back the amount initially invested. This content is not intended for nor applicable to residents of the UK. Cryptocurrency CFDs and spread bets are restricted in the UK for all retail clients.

Gold Sets Record High on Rate-Cut Bets, Haven DemandPrecious metals have extended already impressive year-to-date rallies on expectations of imminent rate cuts and mounting concerns over the Federal Reserve's independence, MUFG analysts say in a note. Lower rates typically boost noninterest bearing bullion's appeal. Investors are also seeking out safe-haven assets amid persistent geopolitical, economic and trade risks, MUFG says. The latest uptick in gold and silver follows Fed Chair Jerome Powell's signal that rates could be lowered this month

GOLD → One step away from 3500. Consolidation. What next?FX:XAUUSD has been rallying towards 3500 since the opening of the session, and the market has every chance of testing this level. Consolidation or correction may form before the next breakout...
Gold resumed its growth at the beginning of the week, reaching five-month highs around $3480 amid declining risk appetite and expectations of Fed policy easing. Trading activity remains low due to holidays in the US and Canada.
Key drivers : Weak Asian markets and uncertainty surrounding Trump's trade policy are supporting interest in gold. The probability of a rate cut in September is estimated at 90% after last week's PCE data.
Overall, the market maintains its momentum towards record levels ($3500), but low liquidity may increase volatility.
Technically , gold is strongly bullish. The price is striving to test the ATH - 3500. Before that, consolidation or a retest of the 3469-3460 zone may form. The dollar is weak at the moment and continues to trend downward, which generally supports gold.
Resistance levels: 3484.8, 3500
Support levels: 3469.5, 3460
Undoubtedly, after consolidation or correction, gold may reach its target. However, continued growth beyond 3500 may be questionable due to a lack of energy, as the market has spent it to reach 3500. Accordingly, a false breakout of the ATH could trigger a strong profit-taking phase, which in turn could lead to a sell-off and correction.
Best regards, R. Linda!

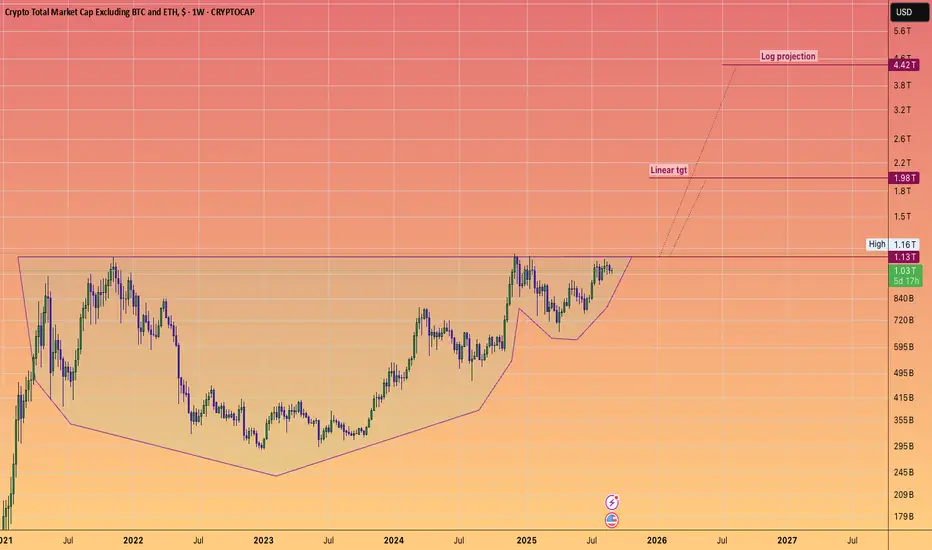
***REMINDER*** of the TOTAL 3 Targets.We are on the cusp of price discovery in many key assets that will contribute to the upcoming alt season.
The Russell 2000 #RTY is close to all time highs..
#GOLD is charging ahead which often pulls up ~BTC
#ETHEREUM hit a new all time already and retraced ... so the next break above will likely see price discovery and vacuum price action to fib extension around $7.5k
#BTCd dominance has topped.
This cup and handle for Total 3 has been a long time in the making which suggests a powerful move is likely to occur.
GOLD NEW ATH AGAIN ? Hello Welcome To My Gold Idea
Gold Buy Setup For Now > CISD BUY : 3484
Gold Buy Setup Pending > FVG BUY : 3454, 3448
Gold Buy Setup Pending > ORDER BLOCK BUY : 3407 , 3402
Target Will NEW ATH Hope You Got It Follow For More !

GOLD Buys or Sells? the next move today 📈 Gold Outlook – September 2, 2025
Gold continues its bullish momentum today, fueled by festive demand in India and global safe-haven buying. Prices have edged up to ₹10,609 per gram for 24K, with spot XAU/USD hovering near $3,490 and eyeing a breakout above $3,500. Market sentiment remains positive amid Fed rate cut expectations and geopolitical uncertainty.
Bias: Bullish
Action: Buy on dips above $3,430, targeting $3,514 short-term
Support: $3,365
Resistance: $3,500 / $3,514
Stay nimble—any retracement could offer fresh entry opportunities.
