Gold Surges Above Expectations, Reaches 5-Week Highs!👋Hello everyone, let’s take a look at OANDA:XAUUSD !
📍Gold continues its impressive rally, even surpassing our previous expectations and reaching the highest levels in 5 weeks. Currently, the bullish momentum is intact, trading around $3412 and surpassing the key psychological level of $3400, gaining over 300 pips from the previous session.
The recent surge in gold is largely driven by concerns over the Fed. Pressure from Trump is fueling speculation that the central bank could cut rates faster and keep them low for a longer period. The CME FedWatch tool shows that investors now expect an 87% chance of a rate cut in September, which is beneficial for gold prices.
📈From a technical perspective: Gold has broken through the $3400 level and closed clearly above the resistance, turning it into new support. The EMA 34 and 89 still favor the bulls, and our strategy will prioritize selling at the top and continuing to buy as long as support holds. The target for the strategy is $3430–3433 USD (D1 resistance).
What do you think💬? How will gold move, and what will the price be at the close today?
✍️ Leave your thoughts in the comments!
Metals

XAUUSD 4H🔎 Chart Context
• Asset: Gold Spot (XAU/USD)
• Timeframe: 4H
• Current price: 3,447.4
• The chart shows gold breaking out of a multi-week consolidation range between 3,250 – 3,400, now pushing toward higher liquidity zones.
📊 Key Observations
1. Market Structure
• Gold has been consolidating inside a wide range box (3,250 – 3,400) since July.
• Recent breakout above 3,425 resistance suggests bullish momentum.
• Structure remains bullish as long as price holds above 3,400 support.
2. Support Zones
• 3,400 – 3,425: Fresh breakout zone; now flipped into short-term support.
• 3,325 – 3,350: Mid-range demand, strong base for buyers.
• 3,250 – 3,275: Major structural demand, defended multiple times in July & August.
3. Resistance Zones
• 3,500: First major upside target (supply/psychological resistance).
• 3,600: Extended bullish target and liquidity cluster.
4. Liquidity & Projections
• Liquidity pools above 3,500 will likely attract price.
• Chart projection suggests:
• Possible short-term pullback into 3,400 – 3,425.
• Continuation rally toward 3,500 → 3,600.
📈 Bullish Scenario (Higher Probability)
• Price sustains above 3,425 breakout level.
• Path: Pullback → Retest support → Continuation higher.
• Targets:
• TP1: 3,500
• TP2: 3,600
📉 Bearish Scenario (Low Probability / Countertrend)
• Gold fails to hold above 3,400.
• Breakdown path:
• Re-entry into range (3,350 → 3,325).
• Possible revisit of 3,250 demand zone.
• Would represent fake breakout scenario.
⚡ Trading Plan
• Long Setup (Preferred):
• Entry: Pullback into 3,425 – 3,400.
• TP1: 3,500
• TP2: 3,600
• Stop: Below 3,375
• Short Setup (Only if breakdown confirmed):
• Entry: Failed retest of 3,400 from below.
• TP: 3,325 → 3,250
• Stop: Above 3,425

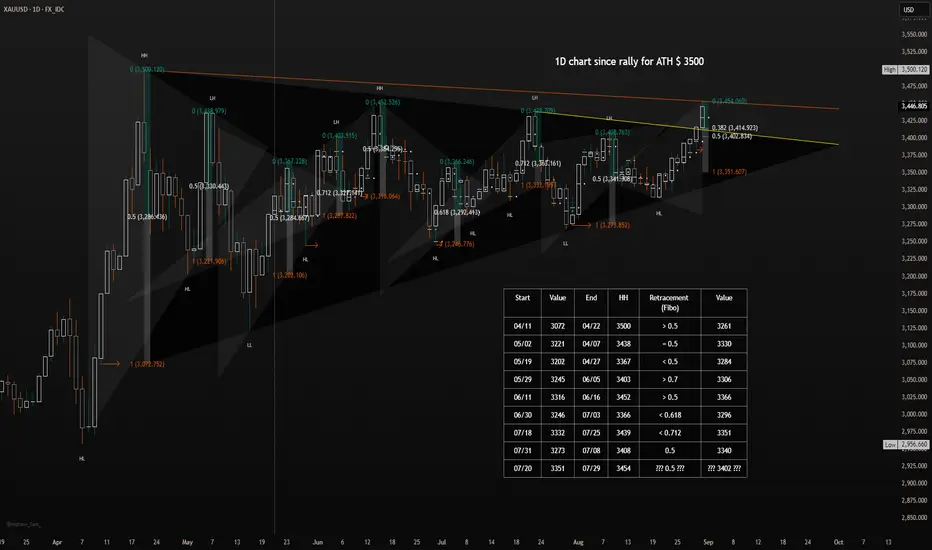
The day after a new higher highHello fellow traders! 👋
It seems like so many times again, the market went in a different direction than you may have expected. 🤷♀️
After multiple positive words from members of the Fed, a rate cut is likely to happen and is getting priced in. 📉 On Friday, July 29, we got some good economic data from the U.S., but the market acted differently. 🤔 Why is this? The data wasn't worse than expected; it was as expected. The market is taking this as a sign—a sign for higher prices. But, and this is a fact, many retail traders aren't. 😥
It's not about confusion; it's about the market (and us as traders) not having priced in all the possibilities. 🤯
The truth is, they are lying to you. They (the government) are telling people and the news that things are about to get fixed and will be good, but they aren't. 🤥 If you think the data we got on Friday is true, think again. Look at the data; you'll see the forecast was as expected, but in reality, the numbers are better than before. Do you get it? The obvious conclusion isn't always the real one. 💡 In my opinion, the U.S. economic data everyone is talking about is much better than many people think because the news is written to make it seem bad. 😒 You can think whatever you want, of course!
Price went up, not down, and a rally was chased. Many stop-loss orders were hit and turned into a cascade of higher prices. 📈 Institutions are buying gold, yes, because the dollar is cheap (?), and a rate cut is coming with a very high probability. 💰 So they buy gold, which results in many people's (and that's a good thing) stop-loss orders being executed. 👏 (sorry)
I've seen it in the past, and you can see it too if you look at my data table. Whenever a very high gold price was reached, a correction followed. 📉
I expect a correction on Monday or Tuesday, and this correction will lead to at least $3418, which is the 0.382 Fibonacci level. In my view, $3403 is the 0.5 level and more realistic. If you look at the table I put in the image, you can see that the day after a high price like we had today, the correction was always at the 0.5 Fibonacci level or more! 📊
Don't think it won't happen; they will trap you in any way they can, such as with fakeouts... 😈
Believe in the market and its structure because, until now, there has never been a day without a correction after a rally like this! 💪
Gold at the Threshold – Can Bulls Break 3500? | H1 OutlookHello traders,
Gold is consolidating just under the all-time high at 3500. On H1, the chart shows stacked supply above and multiple demand layers below, creating a clear battlefield for the next big move 👇
🔹 H1 Supply & Targets (Above Price)
Immediate Supply 3461–3449 → secondary block with OB + FVG overlap.
Primary Supply 3495–3475 → key rejection zone under ATH, strong OB + liquidity inducement.
Liquidity Magnet 3500 → ATH level, buy-stop cluster above.
Fibo Extension Target 3520–3530 → first bullish expansion above ATH (1.272).
🔹 H1 Demand & Supports (Below Price)
Decision Demand 3435–3425 → aligned with EMA21, first correction pocket.
Mid Demand 3415–3405 → OB confluence + EMA50 support.
Deep Demand 3395–3380 → OB + imbalance + EMA100.
Final Demand 3375–3360 → EMA200 cluster, last major H1 support.
🔹 Bias
Bullish bias as long as price holds above 3435–3425.
Neutral zone between 3461–3449 demand flip and 3495–3475 supply.
Bearish shift only if candles close under 3395–3380.
🔹 Scenarios
Bullish Path:
Hold above 3435–3425 → retest 3495–3475 supply.
Break above supply → sweep ATH 3500 → expansion to 3520–3530.
Bearish Path:
Rejection at 3495–3475 → correction into 3435–3425.
Deeper rejection → cascade to 3415–3405 then 3395–3380.
🔹 Conclusion
Gold sits at a pivotal point: ATH magnet above vs. stacked demand layers below. If bulls defend retracements into 3435–3405, upside toward 3500+ stays on the table. If sellers hold both supply zones, correction opens down to EMA100–200 supports.
✨ This map gives a clear 4x4 structure of supply and demand.
Where do you stand — breakout of 3500 or deeper retrace? 👇
Like 🚀🚀🚀 Comment below & follow GoldFxMinds for precision sniper maps 🚀📈

H4 Outlook – Gold (XAUUSD) September 2025Hello traders,
Gold is pressing into premium territory, with sellers attempting to defend supply while a cluster of EMAs builds strong confluence below. Let’s refine the H4 battle map 👇
🔹 H4 Structural Zones
Short-Term Supply (3450–3470) → wick rejection zone, first intraday resistance.
Liquidity Magnet (3485–3500) → psychological round number + liquidity pool above highs.
Decision Demand (3420–3400) → first intraday support, aligned with EMA 21 (3404).
Mid-Term Demand (3380–3360) → valid OB + confluence with EMA 50 (3370), EMA 100 (3363), and EMA 200 (3357). This is the strongest support cluster.
Liquidity Sweep Zone (3320–3300) → inducement pocket if deeper retracement occurs.
🔹 EMA Confluence (H4)
EMA 5 → 3432 (guiding immediate momentum).
EMA 21 → 3404 (Decision Demand).
EMA 50 → 3370 (part of Mid-Term Demand).
EMA 100 → 3363 (inside Mid-Term Demand).
EMA 200 → 3357 (base of Mid-Term Demand).
💡 All three mid/long EMAs overlap between 3370–3357, making 3380–3360 a critical demand block.
🔹 Fibonacci Extensions
1.0 = 3480 → inside Liquidity Magnet.
1.272 = 3520–3530 → bullish expansion target.
1.618 = 3600–3620 → extended projection if bullish momentum holds.
🔹 Scenarios
Bullish:
Hold above 3420–3400 (Decision Demand) keeps flow bullish.
Break 3470 → run into Liquidity Magnet (3485–3500).
Above 3500 → Fibo extensions at 3520–3530 then 3600+.
Bearish:
Rejection from 3450–3470 → pullback to Decision Demand (3420–3400).
Break below → direct move into Mid-Term Demand (3380–3360, EMA cluster).
If that fails → liquidity sweep at 3320–3300.
✨🔹 H4 Bias
Bullish → while holding above 3400.
Neutral → ranging between 3450–3470 supply and 3400 demand.
Bearish → only if 3360 breaks, exposing 3320 liquidity.
My preferred bias is bullish, as long as 3400 holds. Gold is pressing into supply, and a sweep of the liquidity magnet at 3500 looks likely. A bearish shift only comes if 3360 breaks.Summary: On H4, gold is capped by 3450–3470 but strongly supported at 3380–3360, where three EMAs converge. 3500 remains the liquidity magnet, with Fibo extensions at 3520 and 3600.
✨ Stay sharp — gold is sitting between heavy supply above and strong EMA confluence demand below. Patience is key here, wait for confirmations before engaging.
What’s your view on gold’s next move? 👇
Drop a comment and don’t forget to like and follow GoldFxMinds for daily outlooks and precision sniper-entry plans 🚀📈

Daily Outlook – September 2025 (XAUUSD)Hello traders,
Gold closed August with a strong daily close in premium territory, pressing into the 3460–3480 supply. Bulls still control momentum, but September opens with price testing critical levels where continuation or retracement will be decided.
🔹 Daily Structural Zones
Premium Supply Zone (3460–3480) → overhead resistance where sellers may attempt control.
Decision Zone (3400–3380) → first key support, aligned with EMA 21, pivot for continuation or correction.
Mid-Term Demand Zone (3340–3320) → valid Order Block, aligned with EMA 100, stronger structural support.
Liquidity Retest Zone (3260–3240) → liquidity pocket / inducement area, a level where short-term sweeps and reactions may occur.
🔹 EMA Confluence (Daily)
EMA 5 (3409) → immediate bullish guide.
EMA 21 (3370) → inside Decision Zone.
EMA 50 (3349) → near Mid-Term Demand.
EMA 100 (3330) → aligned with Mid-Term Demand Zone.
EMA 200 (3074) → deeper long-term support, outside daily range.
💡 Interpretation: EMAs confirm layered supports. Decision Zone is short-term pivot, Mid-Term Demand is the first true OB, and below it price could sweep the Liquidity Retest Zone.
🔹 Daily Progression Map
Bullish scenario:
Break above Premium Supply (3460–3480) → unlocks Bullish Expansion Target (3520–3550).
Further continuation → Extended Bullish Target (3600).
Bearish scenario:
Rejection at Premium Supply → pullback into Decision Zone (3400–3380, EMA 21 confluence).
If Decision Zone fails → test into Mid-Term Demand OB (3340–3320, EMA 100 confluence).
Break below 3320 → liquidity sweep into Liquidity Retest Zone (3260–3240) before deeper targets are considered.
🔹 Daily Bias – September
Bullish → while above 3400 (Decision Zone).
Neutral → range between 3480 and 3400.
Bearish shift → only if D1 closes below 3320.
🔹 Conclusion
Gold opens September in premium territory, facing resistance at supply.
Breakout above 3480 → continuation to 3520–3550 and 3600.
Rejection → correction into Decision Zone (3400–3380), then Mid-Term Demand OB (3340–3320).
Below 3320 → expect liquidity play around 3260–3240 before any deeper move.
✨ What’s your view for gold in September? Drop your thoughts below 👇
Don’t forget to🚀🚀🚀my plan and follow GoldFxMinds for daily outlooks and precision sniper-entry plans 🚀📈

Gold Weekly Outlook | NFP Week – September 1–5, 2025Hello traders,
We enter September with gold consolidating right below the premium supply 3460–3500. This week brings heavy USD events, including NFP, which makes EMAs and structural demand zones critical guides for price reaction.
🔹 Weekly Structural + EMA Confluence
Supply 3460–3500 → premium supply + liquidity pool, decisive resistance.
Demand 3360–3340 → shallow demand, first cushion.
Demand 3280–3250 → stronger accumulation zone, aligning closely with EMA 21 (~3222) = high confluence.
Demand 2850–2800 → deeper demand, above EMA 50 (~3002) as secondary anchor.
EMA 100 (~2605) & EMA 200 (~2230) → far below, ultimate long-term supports.
🔹 Key USD News (Sept 1–5)
Tue → ISM Manufacturing PMI & Prices
Wed → JOLTS Job Openings
Thu → ADP Employment, Unemployment Claims, ISM Services PMI
Fri → NFP, Unemployment Rate, Hourly Earnings
💡 Expect traps/liquidity sweeps before Friday → real move likely sets in post-NFP.
🔹 Weekly Progression Map
Bullish:
Break & close above 3460–3500 → upside to 3550–3575, then 3600–3620.
As long as price rides EMA 5, bulls keep control.
Bearish:
Rejection at 3460–3500 → pullback into 3360–3340.
If broken → retest 3280–3250 demand + EMA 21 confluence.
If 3250 fails → extended retracement into 2850 demand + EMA 50 (3002).
🔹 Weekly Bias
Bullish → above 3340, especially if EMA 5 keeps supporting.
Neutral → ranging between 3460 and 3340 (likely pre-NFP).
Bearish shift → only if W1 closes under 3250, opening path to 3000–2850.
🔹 Conclusion
This week’s battle is between 3460–3500 supply and 3340–3250 demand (EMA 21 confluence).
Breakout → upside 3550–3620.
Rejection → pullback into EMA supports.
NFP on Friday will likely decide the final weekly close.
✨ What’s your view for gold this NFP week? Drop your thoughts below 👇
Don’t forget to🚀🚀🚀and follow GoldFxMinds for daily precision plans & sniper entry maps — let’s grow the community together 🚀📈

Monthly Outlook – September 2025 📊 Monthly Outlook – September 2025 (XAUUSD)
Hello traders,
Gold closed August with a strong full-body bullish candle above 3440, pressing into premium territory. The absence of a lower wick highlights dominant buyer control, but the market is extremely stretched compared to its dynamic supports. September will be decisive: either continuation into fresh highs, or a corrective retracement back into structural demand.
🔹 Monthly Structural Zones
Monthly Supply 3460–3500 → premium supply, untested liquidity pocket where sellers may attempt control.
Monthly Liquidity Wick 3250–3120 → not an Order Block, but a deep liquidity sweep where institutions previously accumulated.
Monthly Demand 2800–2850 → major accumulation area + last higher low on monthly structure.
🔹 EMA Confluence (Monthly)
EMA 5 → tightly riding price, confirming bullish momentum.
EMA 21 → around 2800, aligning with monthly demand (key confluence if pullback).
EMA 50 → 2200, long-term support.
EMA 100 → 1843, mid-term anchor.
EMA 200 → 1578, ultimate macro support.
💡 Interpretation: Price is extremely extended above all EMAs. A healthy retracement toward EMA 21 (2800) is possible if momentum slows, but as long as candles close above EMA 5, bulls remain in full control.
🔹 Progression Map
Bullish path (continuation):
Break & hold above 3460–3500 → opens 3550–3600.
If momentum persists → expansion toward 3700–3720.
Monthly close above 3720 confirms price discovery into new ATH territory.
Bearish path (retracement):
Rejection at 3460–3500, slip under 3400 → first correction toward 3320.
If downside continues → test into 3250–3120 liquidity wick (expect liquidity sweep & re-accumulation, not clean OB mitigation).
If 3120 fails → deeper move toward 2850 demand, where EMA 21 adds strong confluence.
🔹 Macro Context
Dollar strength and global bond yields remain the main driver.
Gold’s parabolic climb increases the chance that September prints at least a corrective wick.
Institutions may revisit the liquidity wick 3250–3120 for re-accumulation if a deeper pullback sets in.
🔹 Monthly Bias – September 2025
Primary Bias: Bullish → above 3300, gold remains in strong uptrend with EMA 5 support.
Neutral → if price consolidates between 3400–3300 after rejection from 3460–3500.
Bearish shift → only if the monthly candle closes below 3120, opening the way to 2850 (EMA 21 confluence).
✨ What do you think about this September map? Drop your thoughts below don't forget to 🚀🚀🚀 and follow GoldFxMinds 👇 and let’s get ready for the big monthly battle 🚀

Gold maybe ready to memeGold has a potentially explosive setup if clears a level directly above. It can meme to $4k

Gold Market Trend Analysis Report for August 29:
I. Core Views
After a strong breakout above the key psychological level of $3,400, gold maintains a bullish short-term technical outlook. However, today coincides with a critical time window, and the market is focused on the US PCE inflation data, so we need to be vigilant about the risk of a market reversal at a high level. We recommend primarily buying on pullbacks, with caution when chasing higher prices.
II. News Analysis
The continued weakening of the US dollar provides key momentum: The US dollar index has fallen for three consecutive trading days, dropping to 97.85. The weakening dollar has significantly increased the appeal of dollar-denominated gold, particularly stimulating demand from international buyers, becoming the most direct driver of gold's price increases.
Multiple factors contribute: Potential market concerns about the Federal Reserve's independence and an influx of safe-haven funds have formed the macroeconomic backdrop for this round of gold price increases, contributing to a positive market sentiment.
Silver also strengthened: Silver prices climbed to a high of more than one month, confirming the overall strong atmosphere of the precious metals sector and enhancing the reliability of gold's rise.
Today's Focus: US PCE Data: The upcoming release of the US Core PCE Price Index for July is the Federal Reserve's preferred inflation indicator. Its results will significantly impact market expectations of the Fed's monetary policy path, potentially triggering significant market volatility. This represents the greatest uncertainty and risk event today.
III. Technical Analysis
Daily Chart Level:
Strong Pattern: The daily chart closed with a large bullish candlestick, breaking through the 3,400 level and reaching a five-week high, indicating strong bullish momentum.
Potential Risks: Today marks the eighth trading day since the recent rise from the low of $3,311, representing a significant turning point. Be wary of the possibility of a price correction or reversal at high levels.
Operational thinking: The most ideal opportunity to go long is not to chase high prices, but to wait for prices to retrace and correct before buying in order to control risks.
Hourly Chart Level:
Bullish Pattern: The 1-hour moving average system remains in a bullish formation with a golden cross, indicating a short-term bullish trend.
Key Support and Resistance:
Near-term support: $3,405 (the intraday bull-bear watershed). Strong support: $3,400. As long as the price holds above this level, the short-term strong trend will persist.
Upward resistance: Near $3,430, with further resistance expected towards the $3,440 area.
IV. Trading Strategy Recommendations
Overall strategy: Focus on buying on pullbacks, supplemented by shorting on rebounds.
Long strategy: If gold prices stabilize in the $3,405-3,395 support area, consider placing long positions in batches, with a stop-loss below $3,385 and a target of $3,430-3,440.
Short strategy: If gold prices first touch the $3,430-3,440 resistance area and show clear signs of resistance (such as a long upper shadow and a bearish candlestick pattern), try shorting with a small position, entering and exiting quickly.
Risk Warning:
Focus on the European trading session: If gold prices maintain their strength during the European trading session, there is still upward momentum in the US market. Pay close attention to the impact of PCE data: market volatility will intensify before and after the data is released. Investors should manage their positions or temporarily exit the market and wait and see to avoid uncertainty risks.

SILVER Set To Fall! SELL!
My dear followers,
I analysed this chart on SILVER and concluded the following:
The market is trading on 39.719 pivot level.
Bias - Bearish
Technical Indicators: Both Super Trend & Pivot HL indicate a highly probable Bearish continuation.
Target - 39.114
About Used Indicators:
A super-trend indicator is plotted on either above or below the closing price to signal a buy or sell. The indicator changes color, based on whether or not you should be buying. If the super-trend indicator moves below the closing price, the indicator turns green, and it signals an entry point or points to buy.
Disclosure: I am part of Trade Nation's Influencer program and receive a monthly fee for using their TradingView charts in my analysis.
———————————
WISH YOU ALL LUCK

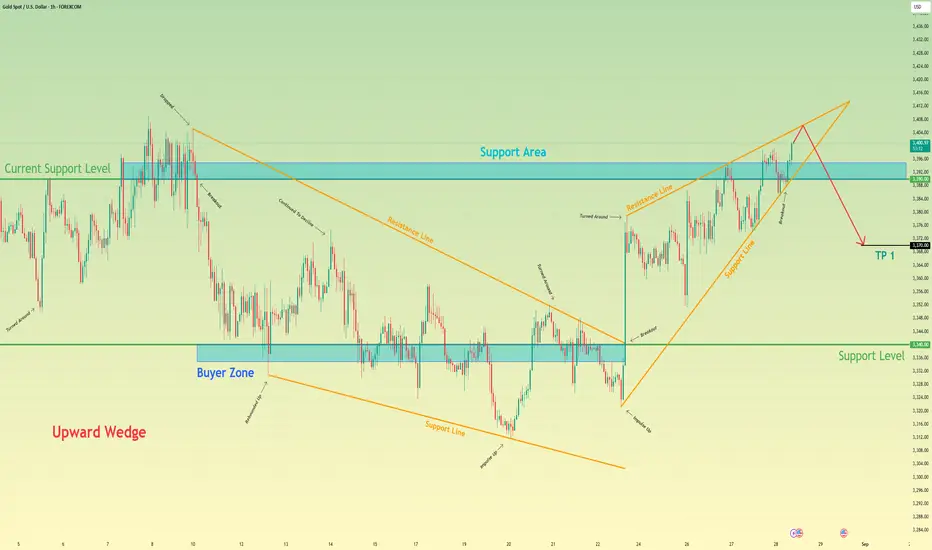
Gold will start to decline and then exit from wedgeHello traders, I want share with you my opinion about Gold. The market dynamic for XAUUSD has seen a significant evolution, transitioning from a corrective falling wedge into a new bullish phase after a powerful breakout from the lows. This upward trend has since matured and taken the shape of a large upward wedge, a pattern that has been guiding the price higher through a series of rebounds and corrections. This formation, while bullish in the short term, often signals potential trend exhaustion as it approaches its apex. Currently, the price action for XAU is at a critical juncture, pushing up against the upper resistance line of this wedge. The primary working hypothesis is a short scenario, which is predicated on the common bearish resolution of a rising wedge pattern. It is anticipated that the asset will be rejected from this resistance line, signalling that buying momentum is waning. A confirmed failure at this peak would likely trigger a sharp reversal, with enough selling pressure to cause a breakdown below the wedge's ascending support line and the current support level of 3390. This structural failure would validate the bearish thesis and initiate a new downward leg. Therefore, the TP is logically set at 3370 points, representing a prudent first objective for the price to achieve following the anticipated breakdown of the wedge structure. Please share this idea with your friends and click Boost 🚀
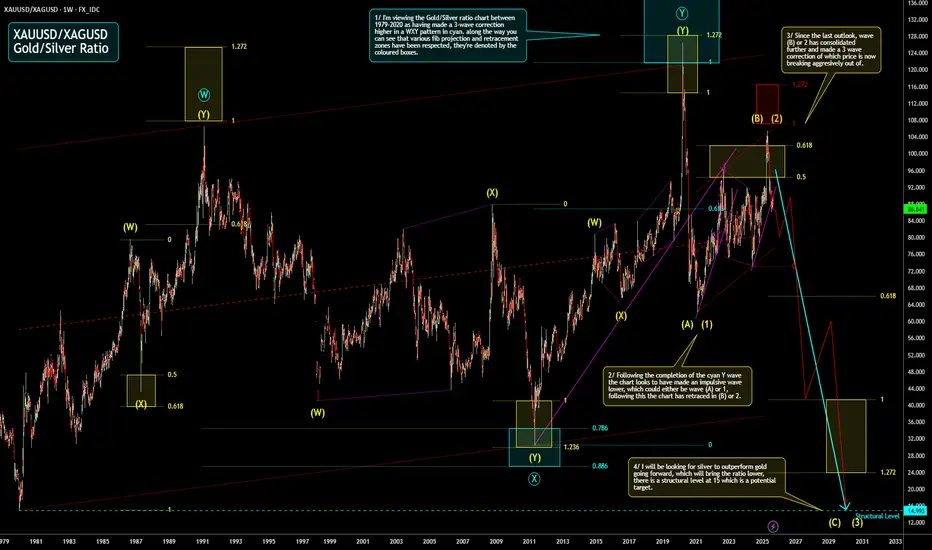
Gold/Silver Ratio Weekly Outlook Here is my weekly outlook on the TVC:GOLD TVC:SILVER ratio. I'm expecting the ratio chart to continue to drop which will mean silver will continue to outperform Gold. I have highlighted a structural level at 15 which is a potential target.
XAU/USD Technical Outlook – Short-Term Dip, Bigger Upside AheadHello guys.
It is what I see:
We can see that Gold is currently trading around $3,404, consolidating after a strong bullish move inside a rising wedge formation. The wedge has now broken out to the upside, and price action is showing a potential head and shoulders pattern near the top.
Head and Shoulders:
The left shoulder, head, and right shoulder are clearly visible, and the neckline is sitting around the $3,399–$3,400 zone. If price dips and retests this neckline, we could see a short-term bearish move toward the target of the head and shoulders around $3,399. This is a healthy pullback after the recent rally.
Bigger Picture (Wedge):
Even though we might see a short-term correction, the larger wedge breakout suggests continuation to the upside. The measured target of the wedge points toward $3,430, which lines up as the next resistance level.

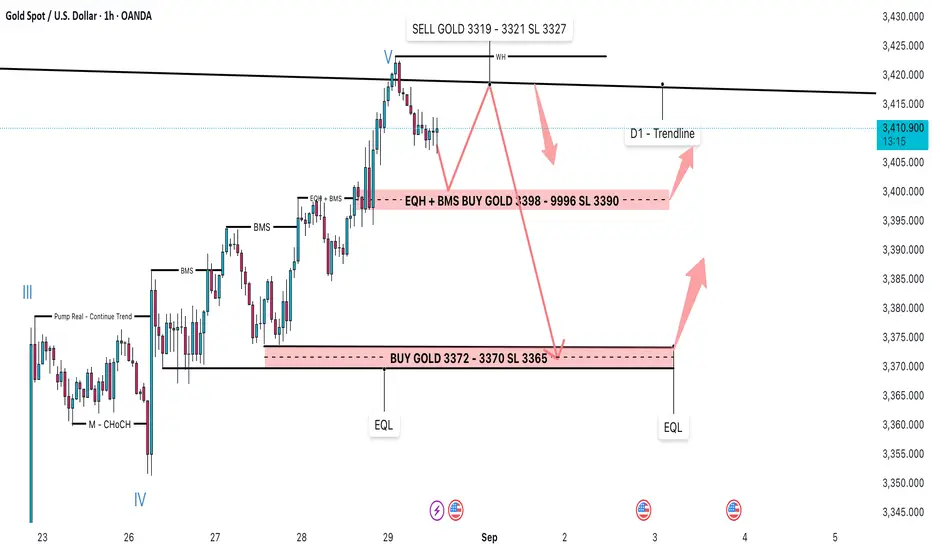
GOLD 29/08: Monthly Candle Closing. DON'T BUY FOMOGold is at a decisive point: will the market continue its bullish run, or is it setting up a deeper correction? Using Smart Money Concepts (SMC) and Elliott Wave Theory, we can map out clear scenarios without falling into FOMO traps.
🔎 Market Structure (SMC + Elliott)
Elliott Wave: The structure has completed waves III – IV – V, with wave V tapping into the higher trendline (D1). This suggests a potential exhaustion phase.
SMC:
Multiple BMS (Break of Market Structure) signals → liquidity manipulation by institutions.
EQH (Equal Highs) and EQL (Equal Lows) → liquidity pools ready to be swept.
Key Demand Zones identified:
3398 – 3396 (EQH + BMS support)
3372 – 3370 (deep liquidity sweep / EQL)
The D1 trendline remains the main dynamic resistance.
📌 Trading Plan
Scenario 1 – Short-term Sell (Counter-trend):
Sell Zone: 3319 – 3321
Stop Loss: 3327
Target: Demand Zone 3398 – 3396
Scenario 2 – Buy at Demand Zone 1 (Main Setup):
Buy Zone: 3398 – 3396
Stop Loss: 3390
Target: 3410 – 3415 (D1 trendline retest)
Scenario 3 – Buy at Demand Zone 2 (Deeper Sweep):
Buy Zone: 3372 – 3370
Stop Loss: 3365
Target: 3400 – 3410
✅ Best Risk-Reward setup, aligned with liquidity grab + Elliott retracement.
✅ Conclusion
The bigger picture still supports a bullish bias, but liquidity sweeps may occur before continuation.
Avoid chasing the market. Wait for confirmation at demand zones for optimal entries.
Main focus: Buy from 3398–3396 or 3372–3370, instead of entering impulsively at highs.
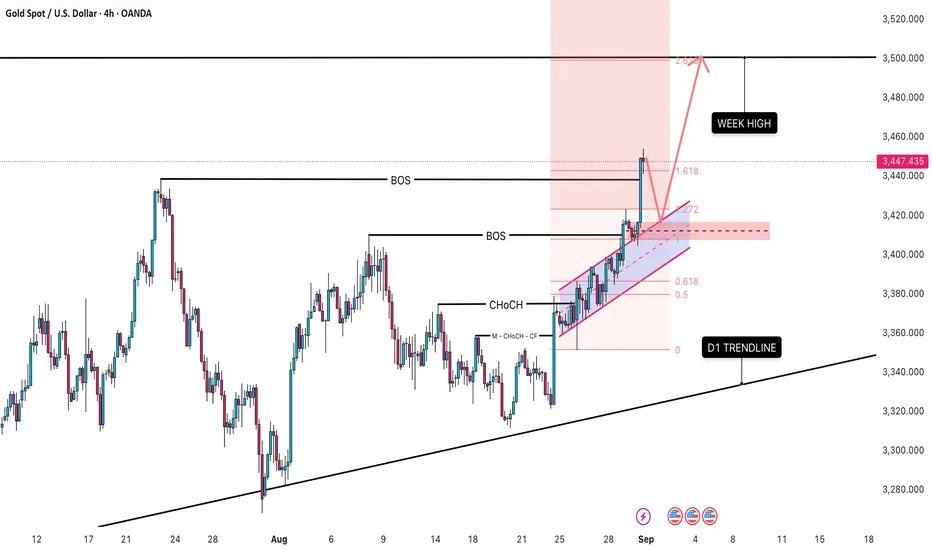
GOLD → Retest 3400 before the news. Will there be a rally?FX:XAUUSD is pulling back slightly after hitting a new high of 3423. The trend is bullish, and on the D1 chart we see a breakout of a symmetrical triangle, which generally hints at bullish potential.
Gold is correcting after rising to $3423 in anticipation of US PCE inflation data.
Key factors: Doubts about the Fed's independence are limiting the USD's strengthening. Soft Fed rhetoric: Board member Waller supported a rate cut in September and further easing. The probability of a September rate cut is estimated at 87%.
Today's news: Core PCE inflation data (forecast: 2.6% y/y).
If below forecast → increased expectations for policy easing → support for gold
If above forecast → dollar strength → gold correction
Short-term gold dynamics depend on inflation data and its impact on Fed rate expectations
Support levels: 3405, 3394, 3386.5
Resistance levels: 3415, 3423, 3433
As part of the correction, the price may test liquidity zones and enter a consolidation phase ahead of the news. However, the market is one step away from distribution (exit from a symmetrical triangle). If the bulls keep the price above 3400 as part of the correction, we will have a good chance to catch the rally...
Best regards, R. Linda!

OPEN WEEK WILL DUMP TO 3410 OR PUMP TO 3500 ?The chart shows that gold is currently in a strong bullish trend. Price has broken above a significant supply zone, which now acts as a demand zone. The recent "BOS" (Break of Structure) confirms this bullish momentum.
Trading Strategy
1. Bullish Scenario (Primary):
Entry: Look for a pullback to the key demand zone around the 3,410–3,425 level. This is a high-probability area for a bounce.
Target: The main target for this bullish move is the new week high at 3,500 and potentially extending to 3,520.
Stop Loss: Place your stop loss below the low of the demand zone to protect your capital.
2. Bearish Scenario (Secondary):
Confirmation: A break below the demand zone at 3,410 would invalidate the primary bullish plan.
Target: If this happens, price could retrace back to the D1 Trendline around the 3,350 level.
3. Key Levels to Watch:
Support:
3,410 - 3,425: Major demand zone.
3,380: A minor support level.
3,350: The D1 Trendline.
Resistance:
3,447: Current high.
3,500: Key psychological and structural resistance level.
3,520: Final target.
Important Notes
Risk Management: Always use a proper stop loss and never risk more than 1-2% of your capital on a single trade.
Confirmation: Wait for bullish price action signals like an engulfing candle, pin bar, or double bottom on a lower timeframe before entering a long position.
Market News: Be aware of any high-impact news events that could affect the price of gold.
XAUUSD Gold Technical Analysis: Weekly Forecast# XAUUSD Gold Technical Analysis: Advanced Multi-Timeframe Trading Strategy & Weekly Forecast
Current Price: $3,448.12 (As of August 30, 2025, 12:54 AM UTC+4)
Asset Class: XAUUSD / Gold Spot
Analysis Date: August 30, 2025
---
Executive Summary
Gold (XAUUSD) continues its extraordinary bull market trajectory, currently trading at $3,448.12 per ounce, representing a phenomenal 37.77% year-over-year gain. Recent market data confirms gold rose to $3,448.50 on August 29, 2025, posting a daily gain of 0.91% and a substantial 5.31% monthly advance. Our comprehensive technical analysis reveals the precious metal is positioned within a critical resistance zone near $3,390-3,400, forming a pennant/ascending triangle pattern with declining volume suggesting near-term indecision. Analytical forecasts project potential targets of $3,597.89 by end-2025, supported by ongoing monetary accommodation and geopolitical uncertainties.
---
Multi-Timeframe Technical Analysis
Elliott Wave Analysis
Gold's price action demonstrates a complex five-wave impulse structure within a Grand Super Cycle:
Primary Count: Currently in Wave 5 of (5) of - final extension phase
Wave Structure: Completing terminal impulse toward $3,800-4,000 zone
Corrective Potential: Wave 4 completion suggests limited downside to $3,200-3,150
Extended Projection: Long-term targets reach $4,200-4,500 by 2026-2027
Invalidation Level: Break below $3,150 would negate primary bullish count
Fibonacci Relationships: Current wave exhibits 1.618 extension characteristics
Wyckoff Market Structure Analysis
Gold exhibits Wyckoff Distribution Phase characteristics at current elevated levels:
Phase: Early Distribution with testing of supply levels
Volume Analysis: Declining volume on recent advances indicates weakening demand
Price Action: Narrowing ranges with repeated tests of $3,400 resistance
Composite Operator Activity: Institutional profit-taking evident above $3,350
Market Character: Building selling pressure against strong underlying demand
Accumulation Zones: $3,150-3,250 represents potential future re-accumulation
W.D. Gann Comprehensive Analysis
Square of 9 Analysis:
- Current price $3,448.12 positioned at critical 180-degree Gann resistance
- Next major Gann square: $3,721 (360-degree completion from cycle low)
- Time and price convergence: September 18-25, 2025 (Autumn Equinox influence)
- Cardinal Gann levels: $3,481, $3,600, $3,721 (geometric progressions)
Angle Theory Application:
- 1x1 Rising Angle Support: $3,250-3,300 (primary trend support)
- 2x1 Accelerated Angle: $3,500-3,550 (next resistance cluster)
- 1x2 Support Angle: $3,000-3,100 (major correction boundary)
- 1x4 Long-term Support: $2,800-2,900 (secular bull market support)
Time Cycle Analysis:
- 120-day cycle completion due: Mid-September 2025
- Seasonal Gann Pattern: September-October historically strong for gold
- Major time window: October 12-22, 2025 (critical turning point)
- Lunar cycles: New moon September 15 coincides with technical resistance
Price Forecasting & Squaring of Price and Time:
- Immediate resistance: $3,480-3,520
- Primary target: $3,650-3,750
- Extended projection: $3,850-4,000
- Time harmony suggests breakthrough after October equinox
Ranges in Harmony:
- Current range: $3,350-3,480 (compression phase)
- Next expansion: $3,200-3,800 (major trading range)
- Long-term channel: $2,500-4,500 (multi-year projection)
---
Japanese Candlestick & Harmonic Pattern Analysis
Recent Candlestick Formations (Daily Chart)
Doji Patterns: August 28-30 showing indecision at resistance
Long Upper Shadows: Repeated rejection at $3,450-3,480 levels
Bullish Marubozu: August 26 confirming strong buying interest
Volume Divergence: Declining volume on recent rally attempts
Evening Star Formation: Potential three-candle reversal pattern developing
Harmonic Pattern Recognition
Potential Bat Pattern: Completion zone $3,380-3,420 (current area)
ABCD Pattern: Active correction targeting $3,200-3,250
Gartley Formation: Long-term bullish pattern projecting $4,200+
Fibonacci Confluence: Multiple retracement levels converging at $3,250
Advanced Harmonic Analysis
Three Drives Pattern: Completing third drive toward $3,500-3,600
Butterfly Pattern: Extreme extension suggesting $3,150-3,200 correction
Cypher Pattern: Potential reversal zone at $3,600-3,700
Deep Crab Setup: Long-term bullish projection to $4,500-5,000
Bull Trap vs Bear Trap Analysis
Current Setup Assessment:
Bull Trap Probability: 65% - False breakout above $3,450 likely
Bear Trap Potential: 35% - Shallow correction creating buying opportunity
Key Levels: Break above $3,520 negates trap scenario
Volume Confirmation: Required for sustainable breakout above resistance
---
Ichimoku Kinko Hyo Analysis
Current Cloud Structure (Daily Chart)
Price Position: Above Kumo cloud but approaching resistance
Tenkan-sen (9-period): $3,421 (short-term dynamic resistance)
Kijun-sen (26-period): $3,367 (medium-term trend support)
Senkou Span A: $3,394 (leading span A - immediate support)
Senkou Span B: $3,289 (leading span B - key cloud support)
Chikou Span: Approaching resistance at historical price levels
Future Kumo Analysis (26 periods ahead):
- Thinning cloud structure indicating potential volatility increase
- Future resistance zone: $3,500-3,600 (forward-looking cloud top)
- Kumo twist anticipated: Late September 2025
Ichimoku Trading Signals
TK Cross: Tenkan above Kijun but flattening (weakening signal)
Price vs Cloud: Above cloud with momentum slowing
Chikou Span: Potential resistance at $3,450 historical level
Cloud Breakout: Consolidating above cloud with mixed signals
---
Technical Indicators Deep Dive
RSI (Relative Strength Index) Multi-Timeframe
Daily RSI: 58.4 (neutral zone, down from recent highs)
Weekly RSI: 67.8 (approaching overbought but not extreme)
4H RSI: 52.1 (reset from overbought levels)
RSI Divergence: Bearish divergence forming on daily timeframe
RSI Support: 50 level crucial for maintaining bullish momentum
Bollinger Bands Analysis
Current Position: Price at upper band ($3,450 level)
Band Width: Contracting after recent expansion (consolidation)
%B Indicator: 0.89 (near upper extreme but not at 1.0)
Squeeze Formation: Bollinger Band squeeze developing for next move
VWAP Analysis (Volume Weighted Average Price)
Daily VWAP: $3,398 (key support level)
Weekly VWAP: $3,324 (intermediate support zone)
Monthly VWAP: $3,187 (major trend support)
Volume Profile: Highest volume acceptance at $3,250-3,350 zone
Moving Average Structure
10 EMA: $3,412 (immediate dynamic support)
20 EMA: $3,384 (short-term trend support)
50 SMA: $3,298 (intermediate support)
100 SMA: $3,156 (key trend support)
200 SMA: $2,934 (major secular support)
Moving Average Signals:
- Perfect bullish alignment maintained across all timeframes
- Golden Cross pattern firmly established
- Price trading above all major moving averages
---
Support & Resistance Analysis
Primary Resistance Levels
1. R1: $3,480-3,520 (immediate Gann and technical resistance)
2. R2: $3,600-3,650 (major harmonic completion zone)
3. R3: $3,750-3,800 (Elliott Wave 5 target area)
4. R4: $3,900-4,000 (psychological and long-term projection)
5. R5: $4,200-4,500 (Extended Elliott Wave and Gann targets)
Primary Support Levels
1. S1: $3,367 (Kijun-sen and recent swing support)
2. S2: $3,250-3,300 (major accumulation and VWAP zone)
3. S3: $3,150-3,200 (Elliott Wave 4 and harmonic support)
4. S4: $3,000-3,100 (psychological and 1x2 Gann angle)
5. S5: $2,800-2,900 (major secular bull market support)
Volume-Based Support/Resistance
High Volume Node: $3,250-3,350 (institutional accumulation)
Low Volume Gap: $3,450-3,550 (potential rapid movement zone)
Volume Resistance: $3,600+ (historical distribution levels)
POC (Point of Control): $3,285 (maximum volume acceptance)
---
Multi-Timeframe Trading Strategy Framework
Scalping Strategy (5M & 15M Charts)
5-Minute Timeframe Methodology:
Entry Signals: Pullbacks to 20 EMA with RSI <30 in uptrend
Profit Targets: $8-15 per ounce per scalping trade
Stop Loss: $5-8 maximum risk per position
Volume Filter: Above-average volume required for entries
Time Windows: Asian session 1:00-5:00 AM, NY session 8:00-11:00 AM EST
15-Minute Scalping Framework:
Range Trading: Current range $3,420-3,470
Breakout Strategy: Volume confirmation above $3,470 for continuation
Mean Reversion: Fade moves beyond 2.5 standard deviations from VWAP
Risk Management: Maximum 4 positions per session, 1:2 R:R minimum
Intraday Trading Strategies (30M, 1H, 4H)
30-Minute Chart Approach:
Trend Following: Long above EMA cluster ($3,400-3,410)
Pattern Trading: Triangle and flag formations near resistance
Target Methodology: Initial $3,480, extended $3,520-3,550
Risk Parameters: $15-25 stops, 2:1 reward-to-risk minimum
1-Hour Chart Strategy:
Momentum Trading: MACD bullish crossovers with histogram expansion
Support Bounces: Long entries from $3,350-3,400 zone
Resistance Fading: Short opportunities above $3,470 without volume
Session Management: Focus on London AM and NY session overlap
4-Hour Swing Framework:
Cloud Strategy: Long on successful Ichimoku cloud support tests
Elliott Wave: Prepare for Wave 5 completion and subsequent correction
Fibonacci Trading: Use 38.2% and 50% retracements for entries
Hold Duration: 3-10 days for swing positions
Swing Trading Strategy (Daily, Weekly, Monthly)
Daily Chart Methodology:
Breakout Strategy: Long on sustained breaks above $3,520 with volume
Correction Trading: Accumulate on pullbacks to $3,250-3,350
Target Progression: $3,650 → $3,800 → $4,000 sequential targets
Position Management: Scale in on multiple timeframe confirmations
Weekly Chart Analysis:
Primary Trend: Strongly bullish above $3,000 weekly support
Swing Targets: $3,800-4,000 zone for major profit-taking
Risk Management: Weekly closes below $3,150 signal trend change
Monthly Chart Perspective:
Secular Trend: Multi-decade bull market acceleration phase
Long-term Targets: $5,000-6,000 by 2027-2030
Major Support: $2,500-2,800 (unlikely to test in current cycle)
---
Day-by-Day Trading Plan: September 2-6, 2025
Monday, September 2, 2025 (Labor Day - Reduced Liquidity)
Market Conditions: Thin trading expected, potential for gap moves
Technical Setup:
Resistance: $3,470, $3,500, $3,530
Support: $3,400, $3,350, $3,300
Expected Range: $3,380-3,480
Trading Strategy:
Reduced Position Sizes: Holiday conditions warrant caution
Gap Trading: Monitor overnight developments for gap opportunities
Range Strategy: Buy support, sell resistance until breakout
Risk Management: Tighter stops due to thin liquidity
Tuesday, September 3, 2025
Market Outlook: Full participation returns, volatility potential increases
Key Events & Strategy:
Economic Calendar: US manufacturing data and job openings
Technical Focus: $3,450-3,470 resistance cluster test
Fed Watch: Monitor Federal Reserve officials' speeches
Entry Strategy: Long $3,380-3,420 targeting $3,500+
Risk Considerations:
- Dollar strength potential from strong economic data
- Geopolitical developments affecting safe-haven demand
- Interest rate expectations impact on gold
Wednesday, September 4, 2025
Market Outlook: Mid-week momentum with focus on Fed policy signals
Strategic Framework:
Pattern Recognition: Triangle/pennant completion monitoring
Volume Analysis: Institutional participation crucial for breakout
Support Defense: $3,350-3,400 zone strength critical
Breakout Preparation: Position for move above $3,480
Trading Approach:
Momentum Strategy: Follow confirmed breakouts with volume
Contrarian Setup: Fade false breakouts without participation
News Trading: ADP employment data potential market mover
Thursday, September 5, 2025
Market Outlook: Pre-NFP positioning and weekly close dynamics
Key Considerations:
NFP Preparation: Traders positioning ahead of Friday's data
Technical Levels: $3,500-3,550 next major resistance zone
Jobless Claims: Weekly data could influence gold sentiment
Fed Policy: Continued monitoring of rate cut expectations
Execution Strategy:
Trend Continuation: Above $3,450 favors $3,550 target
Profit Scaling: Take profits at $3,500, $3,550, $3,600 levels
Risk Adjustment: Prepare for NFP volatility
Friday, September 6, 2025
Market Outlook: NFP release and weekly close significance
Critical Session Strategy:
NFP Impact: Non-farm payrolls major market catalyst
Weekly Close: Above $3,420 maintains bullish structure
Profit Protection: Secure gains from successful trades
Weekend Risk: Geopolitical and news flow considerations
Trading Framework:
Pre-NFP: Light positioning due to event risk
Post-NFP: React to data with appropriate position sizing
Weekly Levels: Close above $3,450 very bullish, below $3,350 concerning
---
Macroeconomic & Policy Analysis
Federal Reserve Policy Impact
The Federal Reserve's monetary policy stance remains crucial for gold's trajectory. Current fed funds rate at 4.25%-4.50% with markets anticipating rate cuts later in 2025 provides a supportive backdrop for gold. Recent Fed meetings show officials holding rates steady while markets expect 2-3 potential cuts before year-end, representing a shift from earlier expectations.
Interest Rate Environment
Gold has demonstrated remarkable resilience despite restrictive monetary policy, with COMEX gold futures open interest rising 8% following recent Fed meetings. Low gold lease rates at 0.33% indicate weak lending demand, supporting underlying physical demand for the precious metal.
Inflation Dynamics & Currency Debasement
The relationship between Federal Reserve policies and gold prices has intensified, with the precious metal serving as an inflation hedge and currency debasement protection. Rising real yields remain a headwind, but ongoing monetary accommodation expectations support higher gold prices.
Geopolitical Risk Factors
1. Trade Policy Uncertainty: Ongoing tensions affecting global growth
2. Currency Wars: Competitive devaluations supporting gold demand
3. Debt Ceiling Issues: US fiscal concerns driving safe-haven flows
4. Middle East Tensions: Regional conflicts supporting risk premiums
5. China-US Relations: Trade disputes affecting global stability
---
Central Bank Gold Demand & ETF Flows
Central Bank Activity
Net Purchases: Continued central bank accumulation, particularly from emerging markets
Diversification Drive: Move away from dollar-denominated reserves
Strategic Reserves: Gold viewed as portfolio diversification tool
Policy Support: Central bank demand providing price floor
ETF Flow Analysis
GLD Holdings: Monitoring largest gold ETF for institutional sentiment
Retail Demand: Continued interest in gold-backed securities
Flow Patterns: Consistent inflows supporting underlying demand
Market Structure: ETF demand creating physical market tightness
---
Bull Trap vs Bear Trap Assessment
Current Market Structure Analysis
Bull Trap Scenario (65% Probability):
Characteristics: False breakout above $3,470-3,500 resistance
Volume Profile: Declining volume on advance indicating weak breakout
Technical Setup: RSI divergence and overextended conditions
Price Target: Correction to $3,200-3,250 support zone
Time Frame: 2-4 weeks for trap completion
Bear Trap Scenario (35% Probability):
Characteristics: Shallow decline to $3,350-3,300 creating buying opportunity
Volume Confirmation: High volume on support test indicating accumulation
Technical Reversal: Hammer or doji formation at key support levels
Breakout Target: $3,600-3,800 following trap completion
Catalyst Required: Fed dovish pivot or geopolitical escalation
Trap Identification Signals
Bull Trap Confirmation:
- Break above $3,480 on low volume
- Immediate reversal within 24-48 hours
- High volume selling on decline
- RSI failure at resistance level
Bear Trap Confirmation:
- Sharp decline to $3,300-3,350 on moderate volume
- Quick reversal with volume expansion
- Gap up following support test
- Institutional buying evidence
---
Risk Management Comprehensive Framework
Position Sizing Methodology
Scalping Trades: 0.5-1% account risk per trade
Intraday Positions: 1-2% maximum account risk
Swing Positions: 2-3% account risk per established position
Maximum Exposure: 6-8% total gold-related risk allocation
Stop-Loss Implementation
Scalping: $5-10 per ounce maximum
Intraday: $15-30 per ounce based on volatility
Swing Trading: Below key support levels ($3,250 for current longs)
Technical Stops: Elliott Wave and pattern invalidation levels
Profit-Taking Strategy
Scaling Approach: 25% at first target, 50% at second, hold 25%
Trailing Stops: Implement after 2:1 favorable movement
Time-Based Exits: Close before major Fed announcements
Pattern-Based: Honor harmonic and Elliott Wave completion zones
---
Weekly Outlook Probability Matrix
Bullish Scenario (Probability: 45%)
Primary Catalysts:
- Federal Reserve dovish policy signals
- Geopolitical tensions escalation
- Technical breakout above $3,520 with volume
- Weaker US economic data supporting rate cut expectations
Price Objectives:
- Initial: $3,550-3,650
- Extended: $3,750-3,800
- Optimistic: $4,000+
Neutral/Consolidation Scenario (Probability: 35%)
Characteristics:
- Range-bound trading $3,300-3,500
- Mixed economic signals and Fed uncertainty
- Technical indecision at resistance levels
- Declining volatility and volume
Bearish Scenario (Probability: 20%)
Risk Factors:
- Fed hawkish surprise or strong economic data
- Technical breakdown below $3,300 support
- Dollar strength and rising real yields
- Profit-taking from institutional players
Downside Targets:
- Initial: $3,200-3,250
- Extended: $3,100-3,150
- Stress: $3,000-3,050
---
Long-Term Strategic Outlook
Secular Bull Market Analysis
Gold's secular bull market remains intact with multiple supportive factors:
Monetary Debasement: Ongoing currency printing cycles
Debt Sustainability: Growing government debt burdens globally
Demographic Shifts: Aging populations requiring safe assets
Technology Disruption: Digital currencies highlighting gold's role
Multi-Year Price Projections
2025 Year-End: $3,597-3,800 (analytical forecast range)
2026 Target: $4,200-4,500 (Elliott Wave completion)
2027-2030: $5,000-6,000 (secular bull market continuation)
Crisis Scenario: $7,000+ (major monetary system disruption)
---
Conclusion & Strategic Recommendations
Gold (XAUUSD) stands at a critical juncture near $3,448, exhibiting technical characteristics of a mature bull market phase with potential for both continuation and correction. The confluence of multiple analytical methodologies suggests elevated probability for a near-term consolidation or correction before the next major advance toward $4,000+.
Key Success Factors:
1. Federal Reserve Policy Support: Dovish pivot crucial for next leg higher
2. Technical Breakout Confirmation: Sustained move above $3,520 with volume
3. Geopolitical Catalyst: Safe-haven demand supporting higher prices
4. Dollar Weakness: USD decline necessary for gold strength
Critical Monitoring Points:
1. September 18 FOMC Meeting: Next Fed policy decision impact
2. Technical Level Behavior: Response at $3,450-3,520 resistance
3. Volume Patterns: Institutional participation in breakout attempts
4. Global Risk Sentiment: Correlation changes with risk assets
Strategic Recommendation:
Maintain cautiously optimistic stance with tactical flexibility. Current setup favors a Bull Trap scenario with 65% probability, suggesting opportunity to accumulate on pullbacks to $3,250-3,350 zone. Risk management remains paramount given elevated volatility potential and technical setup maturity.
The October time window (12-22) represents a critical juncture for intermediate-term direction, with potential for either final impulse toward $4,000+ or corrective phase toward $3,150-3,200.
---
*This comprehensive analysis is provided for educational and informational purposes only. Gold trading involves substantial risk of loss and may not be suitable for all investors. Past performance does not guarantee future results. Always implement appropriate risk management and consult with qualified financial professionals before making investment decisions.*
---
For individuals seeking to enhance their trading abilities based on the analyses provided, I recommend exploring the mentoring program offered by Shunya Trade. (Website: shunya dot trade)
I would appreciate your feedback on this analysis, as it will serve as a valuable resource for future endeavors.
Sincerely,
Shunya.Trade
Website: shunya dot trade
Disclaimer: This post is intended solely for educational purposes and does not constitute investment advice, financial advice, or trading recommendations. The views expressed herein are derived from technical analysis and are shared for informational purposes only. The stock market inherently carries risks, including the potential for capital loss. Therefore, readers are strongly advised to exercise prudent judgment before making any investment decisions. We assume no liability for any actions taken based on this content. For personalized guidance, it is recommended to consult a certified financial advisor.

XAUUSD Weekly outlook 25-29 Aug, 2025XAUUSD Weekly Outlook (Swing Trading Perspective)
Gold has broken out of the descending channel after Powell hinted at potential rate cuts on Friday, which has shifted market sentiment bullish.
Currently, price is hovering at 3371 above a key demand zone around 3349 – 3355, which also aligns with the channel breakout & retest. A pullback into this zone would provide a high-probability swing entry, supported by demand structure and market fundamentals.
Trading Plan (Swing Buy Setup):
Entry Zone: 3349 – 3355 (retest of channel line + demand area)
Stop Loss: Below 3325 (invalidates demand structure)
Target: 3430 (major supply zone / weekly resistance)
Risk/Reward: ~2.3
Price has confirmed a bullish breakout of the falling channel.
The retest + demand area aligns with structure support and liquidity grab.
As long as price holds above 3350 zone, bias remains bullish.
First upside objective is 3390–3400, followed by a weekly swing target of 3430.
Bias: Bullish
Confirmation Needed: Clean retest and rejection from 3350 demand area before continuation.

Short-term GOLD analysis
Gold appears to be completing a diametric, the last wave of which (wave-g) could end at 3308-3290.
If the post-pattern move fails to pass, a combination pattern is likely to form.
Good luck
NEoWave Chart

Gold Analysis – 15-Minute Timeframe (August 30, 2025)Considering the RSI is in overbought territory and a clear bearish divergence is present, it seems inevitable for gold to react to the highlighted resistance zone (red area).
✅ While the suggested take-profit (TP) target might be slightly ambitious—and geopolitical developments could prevent price from reaching the blue order block—technically, it's not unlikely for price to resume its bullish movement from that zone.
📌 If a valid setup forms, I’ll definitely enter a short (Sell) position.
Good luck and happy trading! 🌟

SILVER BULLISH BREAKOUT|LONG|
✅SILVER is going up currently
And the price broke the key structure level of 39.52$
Which is now a support, and after the pullback
And the retest, I think the price will go up
LONG🚀
✅Like and subscribe to never miss a new idea!✅

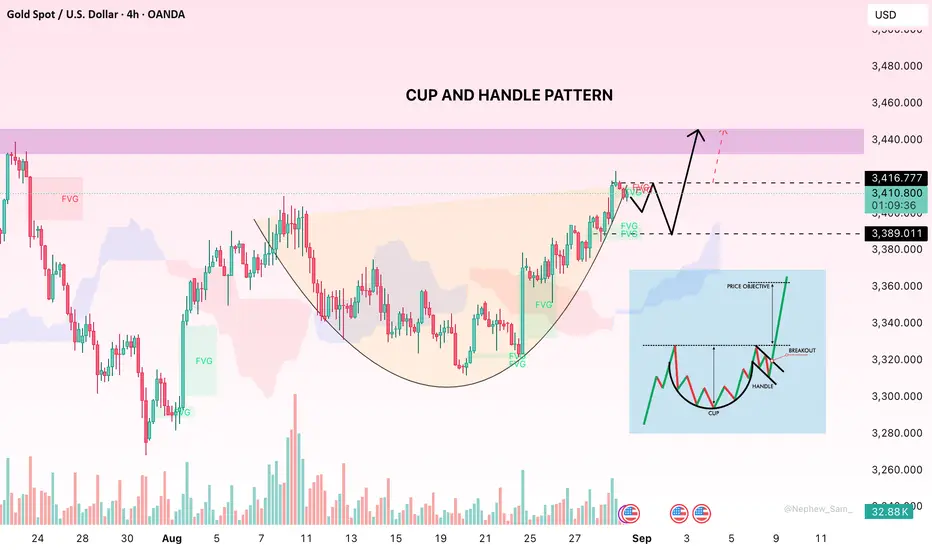
Strong Bullish Momentum, Eyeing a Break Above $3,420Hello everyone,
Gold is currently maintaining a clear bullish structure as the Cup and Handle pattern nears completion, signalling the potential for a breakout should the $3,420 resistance be breached. The Fair Value Gap (FVG) zones at $3,375 – $3,400 have repeatedly acted as solid support for the ongoing uptrend, while trading volumes during upward sessions highlight that buying pressure remains dominant. Should the price break above $3,420, the next target could extend to $3,440, or even higher, as the bullish momentum strengthens further.
Do you think gold has the strength to push through $3,420 this time? Share your thoughts in the comments!