XAGUSD Final TP Hit BeautifullySILVER Hit our TAKE PROFIT PRICE LEVEL which doesnt surprise us " SOMFX TRADING TEAM " because this was what we were eagerly waiting for weeks.
The structure of the market was clear to every one who understands the dynamics of the market move.
if you go back to the original post of silver at 29/July/2025 you will clearly see that i have predicted the first move, the second move and also i have clerly pointed that the sellers will try to come back to the market at 39.00 and they will be doomed by point a horizontal line saying " So many willing sellers will be doomed here " and that is clearly what happened.
GUYS HAPPY TARDING.
Metals

XAUUSD big correction is coming on September?The complex correction or consolidation is now on the edge.
Either Gold will break it and make a new range or it will retreat about $100-$150 correction.
I prefer to trade with the correction, BEARISH FOR GOLD!
LET'S GO...!!!

VIOLENT BOS on SILVER takes place! HOW FAR it goes this time?!?This is where momentum strategys eventually lead to...

Silver Acceleration PhaseGold and Silver are entering acceleration mode.
Silver tends to run into hyperdrive during gold's last major leg up. Gold could push to 3,800+ here, while Silver could run up to 45+.
The miners are very happy. Most of their technicals look amazing.
PAAS and FMS in particular are my favorites currently and look like they want to moon soon.

GOLD ROUTE MAP UPDATEHey everyone,
We closed the week on a strong note with the final target of 3439 being achieved. The move was confirmed by the EMA5 cross and lock above 3416 just like we analysed, providing clear validation of the bullish momentum.
BULLISH TARGET
3390 – ✅ DONE
EMA5 CROSS AND LOCK ABOVE 3390 WILL OPEN THE FOLLOWING BULLISH TARGETS
3416 - ✅ DONE
EMA5 CROSS AND LOCK ABOVE 3416 WILL OPEN THE FOLLOWING BULLISH TARGET
3439 - ✅ DONE
BEARISH TARGETS
3365 – ✅ DONE
We will now come back Sunday with a full multi timeframe analysis to prepare for next week’s setups, including updated views on the higher timeframes, EMA5 alignments, and structure expectations going forward.
Thanks again for all your likes, comments, and follows.
Wishing you all a fantastic weekend!!
Mr Gold
GoldViewFX

From Rally to Reversal: Gold Near PRZ, Bears Prepare!As I expected in the previous idea , Gold started to rise with the help of Powell's words and reached my targets(Full Target) .
Gold is currently entering the Potential Reversal Zone(PRZ) and is also moving near the Resistance zone($3,451-$3,406) and Resistance line .
In terms of Elliott Wave theory , Gold appears to be completing microwave 5 of the main wave C . The wave structure is a Zigzag Correction(ABC/5-3-5) .
I expect Gold to drop to at least $3,363 after entering the Potential Reversal Zone(PRZ) .
Second Target: $3,351
Third Target: Support lines
Note: Stop Loss (SL) = $3,416(Worst)
Gold Analyze (XAUUSD), 2-hour time frame.
Be sure to follow the updated ideas.
Do not forget to put a Stop loss for your positions (For every position you want to open).
Please follow your strategy; this is just my idea, and I will gladly see your ideas in this post.
Please do not forget the ✅ ' like ' ✅ button 🙏😊 & Share it with your friends; thanks, and Trade safe.

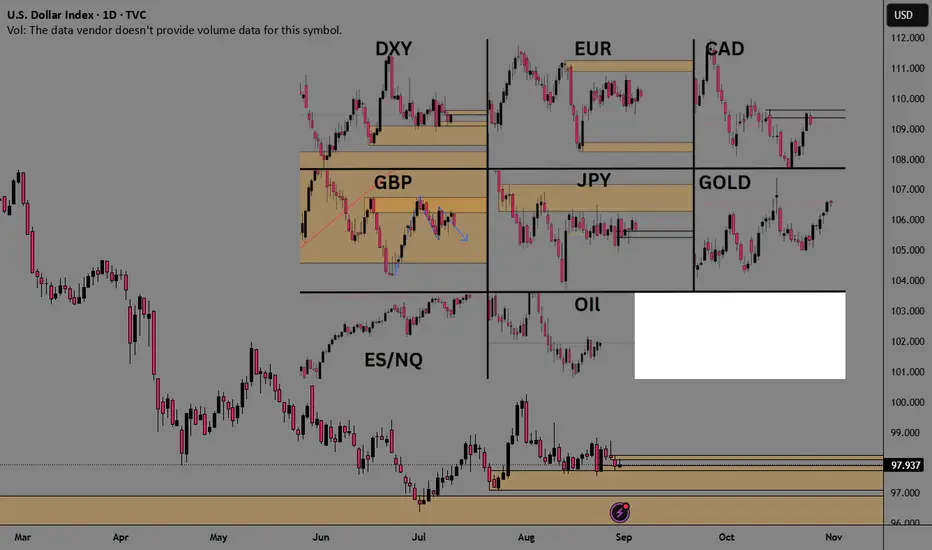
Current Price Action All MarketsWanted to share a picture of the daily TF price action of the major markets.
1) August has been a very slow market for forex. Nothing but chop... Especially over the last 3 weeks.,
2)Stocks and gold have seen a slow grinding uptrend.,
Each market is unique in its own right and benefits not only different types of traders, but also different setups perform better during specific market conditions. It's essential to trade various types of market conditions to suit your style, as well as when you perform at your best and worst.
XAUUSD: August 29Gold Support and Resistance Levels:
Daily Chart Resistance: 3440, Support: 3360
4-Hour Chart Resistance: 3440, Support: 3380
1-Hour Chart Resistance: 3423, Support: 3404
Gold is trading in a narrow range today. My advice is to buy low and sell high based on resistance and support levels. I've already started selling. I hope gold falls as expected.
High: 3414, Low: 3404. For a short-term decline, we're looking at targets around 3400.

Gold | H2 Double Top | GTradingMethod🧐 Market Overview:
Gold is testing a key diagonal resistance level while forming a potential double top on the H2 timeframe. This setup suggests that sellers may step in at this level if resistance holds.
📊 Trade Plan:
Risk/Reward: 4.6
Entry: 3423.1
Stop Loss: 3429.6
Take Profit 1 (50%): 3397.8
Take Profit 2 (50%): 3385.5
💡 GTradingMethod Tip:
Double tops near major resistance often provide high R:R opportunities, but confirmation from price action is key before entering.
🙏 Thanks for checking out my post!
Make sure to follow me to catch the next idea and share your thoughts — I’d love to hear them.
📌 Please note:
This is not financial advice. This content is to track my trading journey and for educational purposes only.

GOLD: The Market Is Looking Down! Short!
My dear friends,
Today we will analyse GOLD together☺️
The in-trend continuation seems likely as the current long-term trend appears to be strong, and price is holding below a key level of 3,427.05 So a bearish continuation seems plausible, targeting the next low. We should enter on confirmation, and place a stop-loss beyond the recent swing level.
❤️Sending you lots of Love and Hugs❤️

SILVER: Strong Bearish Sentiment! Short!
My dear friends,
Today we will analyse SILVER together☺️
The market is at an inflection zone and price has now reached an area around 38.963 where previous reversals or breakouts have occurred.And a price reaction that we are seeing on multiple timeframes here could signal the next move down so we can enter on confirmation, and target the next key level of 38.858.Stop-loss is recommended beyond the inflection zone.
❤️Sending you lots of Love and Hugs❤️

Silver Eyes 40-Resistance for a Record High BreakoutIn line with gold’s momentum and the industrial demand for silver—particularly from the growing tech and AI sectors—a clear hold above the 40 mark may extend gains toward 42, aligning with the upper border of the uptrending channel respected since 2023. A breakout beyond that border may offer a more comfortable bullish outlook for silver, with potential upside toward 46 and 50, in line with the 2011 peaks and possibly beyond.
On the downside, should momentum pull back, a clean break below 37 may extend losses toward the channel’s mid-zone near 35, where a potential rebound could emerge. If not, the next key level I’m eyeing is the lower boundary of that channel near the 30 mark, which may offer another long-term bullish positioning opportunity on the silver chart.
— Razan Hilal, CMT

Gold Eyes Record High BreakoutAs gold's price action continues to narrow within a 5-month consolidation, traders await confirmation of whether the formation represents an inverted head and shoulders pattern with an extended right shoulder, or a triangle consolidation—keeping markets on edge for a breakout signal.
The 3450–3500 zone stands as a critical resistance barrier. A confirmed breakout above it could lead gold prices to extend toward 3780–3800 (equal to the height of the pattern), and ultimately test the 4,000 checkpoint—the target of a long-term monthly cup and handle pattern.
On the downside, key supports lie at 3320 and 3280. A clear break below these levels could confirm a steep bearish breakout toward 3130 and 2900, which may, in turn, set the stage for long-term bullish opportunities back toward the 4,000 level.
— Razan Hilal, CMT

GOLD (XAUUSD): Bullish Confirmation After News
Gold finally turned bullish after US news.
I see a strong intraday bullish confirmation:
a breakout of a resistance line of a horizontal range on an hourly
time frame with a high momentum candle, provide a valid Change of Character.
We can expect growth now.
❤️Please, support my work with like, thank you!❤️
I am part of Trade Nation's Influencer program and receive a monthly fee for using their TradingView charts in my analysis.

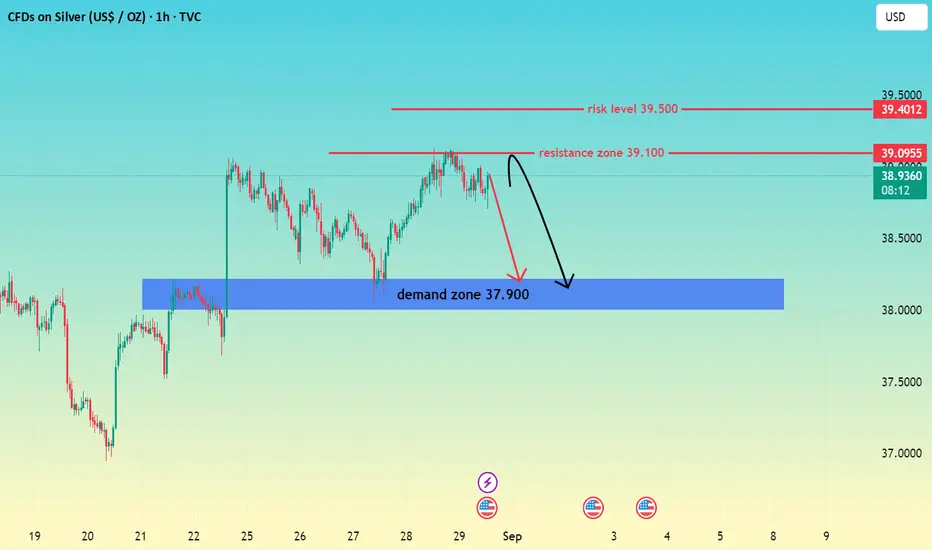
SILVER AT RESISTANCE ZONE-READ CAPTIONHi trade's
Silver price is currently approaching the resistance zone near 39.100, while the risk level remains at 39.500.
If price respects this resistance, we may see a rejection and a move back toward the demand zone at 37.900.
However, if buyers push above 39.500, the bearish setup becomes invalid.
This setup highlights a short opportunity from resistance with demand zone as the key target. Risk management is crucial, as a breakout above 39.500 may shift the trend
Resistance 39.100
Demand 37.900
Risk 39.500
Gold Faces Upward Pressure from Fundamentals: Levels to WatchGold is currently trading above the trend line from its historic high at the 3,410 level. However, let's summarize the developments for XAUSD since the beginning of the month. News since the beginning of August, particularly the Financial Times report on August 8 about Swiss gold bars being subject to tariffs, and the uncertainty caused by the delay in official confirmation, significantly widened the spread between spot gold and gold futures, with the average intraday spread around 35. After the official approval of the gold tariff, gold peaked at 3,409 on August 7 and then hit this month's low of 3,311 on August 20, forming a falling wedge pattern. Gold then attempted to break out of the wedge strongly and met its 200-hour moving average. And acted as resistance.
At the Jackson Hole Conference held in Wyoming, USA, Fed Chairman J. Powell drew attention to the downward pressure on the employment:"In the near term, risks to inflation are tilted to the upside, and risks to employment to the downside-a challenging situation," Powell said in his remarks. "Nonetheless, with policy in restrictive territory, the baseline outlook and the shifting balance of risks may warrant adjusting our policy stance."market and noted that they could change their monetary policy stance. Although Fed members and Powell reiterated their data-dependent stance. This speech was perceived as dovish by the market and interpreted as a signal for an interest rate cut in September. With this announcement, gold rose from 3,323 to 3,374 levels. Following this upward movement, gold continued within a rising wedge formation. However, on August 25, Fed member Lisa Cook was dismissed by US President Trump, and Cook's objection to this decision on legal grounds increased uncertainty in the market regarding interference with the Fed's independence of both means and purpose.
On August 28, gold reached around $3,420, its highest level this month. This breakout from the rising wedge may be misleading, but the pressure on the Fed and upcoming inflation and unemployment data may signal that upward pressure will continue. We clearly saw this month's PPI data breakdown, specifically in the Trade of Finished Goods section, that tariffs are accelerating inflation pass-through.In other words, tariffs have begun to have a serious impact on the trade balance, which means that future CPI (headline inflation) and PCE data could show a significant upward movement, increasing uncertainty and pushing gold prices higher.
In conclusion, the overall outlook for gold is upward. The 3,420 resistance level is currently critical, as it is both a Fibonacci retracement and a resistance level. If this level is broken, the upward movement could accelerate. Breaking the 3,420 resistance level would mean overcoming the trend coming from the 3,500 level, implying that there would be no other obstacle left to test the 3,450 level, the last resistance before the historical peak. However, if the technical analysis holds, the rising wedge formation carries downside risks. Breaking below the 3406 support level is critical in this regard; if broken, gold could exit the formation and begin a downward movement towards 3385.

XAUUSD: August 28th Market Analysis and StrategyGold Support and Resistance Levels:
Daily Chart Resistance: 3440, Support: 3350
4-Hour Chart Resistance: 3420, Support: 3374
1-Hour Chart Resistance: 3409, Support: 3385
Based on the market, 3400 serves as a reference resistance level for today, followed by 3420. Short-term support focuses on yesterday's low of 3374, followed by the weekly low of 3351. In the short term, 3380-3385 may become a key level for gold prices today. If it fails to fall below 3380, gold prices will continue to fluctuate upward. In the NY market, focus on the upward pressure in the 3409-3420 range, and the support levels of 3385 and 3734. My personal recommendation is to buy on dips!
BUY:3385near
BUY:3374near
SELL:3409near
SELL:3420near

Gold (XAUUSD) – Waiting for Buy Opportunity Near Range SupportWe're currently inside a range and approaching its lower boundary.
There was a chance to go long a bit lower, but there’s still time — the highlighted zone looks like a solid area to consider longs.
We’re patiently waiting for price to enter the zone and give us a valid buy signal.
No rush. Let the market come to us

GBPUSD SETUP BUY AGAINWhat do you think?
in my opinion, the price will fall to demand area
AND THIS DEMAND AREA is strong as it could break downtrend line
so I will buy from this area ,but when the price make rejection from this area or when reflected
And you can look on this analysis in down

GOLD BEST PLACE TO SELL FROM|SHORT
GOLD SIGNAL
Trade Direction: short
Entry Level: 3,406.14
Target Level: 3,357.86
Stop Loss: 3,438.15
RISK PROFILE
Risk level: medium
Suggested risk: 1%
Timeframe: 9h
Disclosure: I am part of Trade Nation's Influencer program and receive a monthly fee for using their TradingView charts in my analysis.
✅LIKE AND COMMENT MY IDEAS✅

Gold (XAUUSD) Intraday Analysis – August 29, 2025On the H1 timeframe, gold has just created a fresh high around 3,420 USD/oz but faced strong selling pressure, pushing the price back to 3,407 USD/oz. This indicates that the 3,420 resistance zone remains a solid short-term barrier.
Technical Analysis
Key Resistance Levels:
3,420 USD/oz – the recent top, a breakout above this level may extend the bullish move toward 3,435 – 3,450 USD/oz.
3,407 – 3,410 USD/oz – current retest zone. Holding above it could trigger another attempt to test 3,420.
Key Support Levels:
3,380 – 3,385 USD/oz – highlighted demand area, acting as intraday support.
3,360 USD/oz – stronger support, aligning with the 38.2% Fibonacci retracement of the previous bullish leg.
EMA & RSI Outlook:
EMA 20 is still pointing upward, reflecting an intact bullish trend.
RSI on H1 shows slight bearish divergence → signaling a possible short-term pullback before continuation.
Trading Strategies
Buy the Dip (trend-following setup):
Look for long entries around 3,385 – 3,390 USD/oz.
Targets: 3,420 – 3,435 USD/oz.
Stop loss: below 3,375 USD/oz.
Counter-trend Sell (short-term setup):
If price fails to break 3,420 USD/oz, consider selling between 3,415 – 3,420 USD/oz.
Target: 3,385 USD/oz.
Stop loss: above 3,426 USD/oz.
- The overall trend remains bullish, but traders should wait for a corrective dip to enter with better risk-reward.
- Save this analysis to track the key levels and stay prepared for intraday setups.

Gold XAUUSD Intraday Analysis 29.08.2025Gold has been trading in a bullish trend, moving higher without any significant retracement yesterday. Currently, price is holding around 3405–3407 after rejecting higher levels.
Looking at the chart, a potential retracement zone lies at 3393–3396, which aligns with a demand area and prior consolidation. If price retraces into this zone, it may provide a strong opportunity to join the ongoing bullish trend.
The upside target remains at 3415, which corresponds to the next resistance area, while invalidation of this setup lies below 3386 support.
Trading Idea:
Entry (Buy Zone): 3393–3396
Stop Loss (SL): 3386
Take Profit (TP): 3415
Risk-to-Reward ratio: ~1:2
Plan: Wait for retracement into the 3393–3396 zone, and find confirmatoin before entering long.

Silver breakout support at 3830The Silver remains in a bullish trend, with recent price action showing signs of a continuation breakout within the broader uptrend.
Support Zone: 3830 – a key level from previous consolidation. Price is currently testing or approaching this level.
A bullish rebound from 3830 would confirm ongoing upside momentum, with potential targets at:
3965 – initial resistance
4000 – psychological and structural level
4040 – extended resistance on the longer-term chart
Bearish Scenario:
A confirmed break and daily close below 3830 would weaken the bullish outlook and suggest deeper downside risk toward:
3800 – minor support
3755 – stronger support and potential demand zone
Outlook:
Bullish bias remains intact while the silver holds above 3830. A sustained break below this level could shift momentum to the downside in the short term.
This communication is for informational purposes only and should not be viewed as any form of recommendation as to a particular course of action or as investment advice. It is not intended as an offer or solicitation for the purchase or sale of any financial instrument or as an official confirmation of any transaction. Opinions, estimates and assumptions expressed herein are made as of the date of this communication and are subject to change without notice. This communication has been prepared based upon information, including market prices, data and other information, believed to be reliable; however, Trade Nation does not warrant its completeness or accuracy. All market prices and market data contained in or attached to this communication are indicative and subject to change without notice.
