GOLD - WAVE 5 BULLISH TO $3,734 (UPDATE)I'll warn you all again, don't blindly ignore this 'Scenario 2 Bullish Analysis' as it might catch you off guard!👀 Gold has failed to take out the Wave 2 low ($3,245) multiple times now.
As long as Gold remains above Wave 2 low ($3,245), this Gold bullish bias remains an option. As traders we always have to be prepared to adapt to different market conditions.
Metals

Gold and the Calm Before the Breakout StormGold Technical Outlook:
Trend: Gold has been in a sustained uptrend since late 2024, holding well above the 200-day SMA (3,062) and stabilizing around the 50-day SMA (3,346).
Resistance: The top of the consolidation range sits near 3,430–3,450, a key barrier that has rejected multiple breakout attempts.
Support: On the downside, the base of the range is marked around 3,245, which aligns with a prior swing low. The rising 50-day SMA provides additional dynamic support.
Momentum: RSI is steady at 55, showing room for upside but not yet overbought. MACD is modestly positive, hinting at a gradual recovery in bullish momentum.
Structure: Price is currently oscillating in a horizontal range (3,245–3,450) after its sharp rally, suggesting a consolidation phase rather than trend reversal.
What this means:
Gold remains in consolidation but within a strong broader uptrend. The 3,430–3,450 resistance zone is the key breakout level to watch — a close above it could re-ignite bullish momentum and open the door for fresh highs. On the flip side, failure to hold the 3,245 floor would signal deeper corrective risk.
For now, this looks like a bullish continuation pattern with traders awaiting a decisive breakout from the range to confirm the next leg.
-MW

GOLD ROUTE MAP UPDATEHey Everyone,
Following yesterday’s update, price action confirmed a cross and lock below 3365, which opened the retracement range toward 3347. While a downside move materialised, the full gap to 3347 was not completed. Instead, rejection above that level triggered renewed buying interest, consistent with our established dip buying framework. This subsequent upward move extended to 3386, leaving the 3390 bullish target just short but still within reach.
We will keep the above in mind when taking buys from dips. Our updated levels and weighted levels will allow us to track the movement down and then catch bounces up.
We will continue to buy dips using our support levels taking 20 to 40 pips. As stated before each of our level structures give 20 to 40 pip bounces, which is enough for a nice entry and exit. If you back test the levels we shared every week for the past 24 months, you can see how effectively they were used to trade with or against short/mid term swings and trends.
The swing range give bigger bounces then our weighted levels that's the difference between weighted levels and swing ranges.
BULLISH TARGET
3390
EMA5 CROSS AND LOCK ABOVE 3390 WILL OPEN THE FOLLOWING BULLISH TARGETS
3422
EMA5 CROSS AND LOCK ABOVE 3422 WILL OPEN THE FOLLOWING BULLISH TARGET
3439
BEARISH TARGETS
3365 - DONE
EMA5 CROSS AND LOCK BELOW 3365 WILL OPEN THE FOLLOWING BEARISH TARGET
3347
EMA5 CROSS AND LOCK BELOW 3347 WILL OPEN THE FOLLOWING BEARISH TARGET
3324
EMA5 CROSS AND LOCK BELOW 3324 WILL OPEN THE SWING RANGE
3304
3281
As always, we will keep you all updated with regular updates throughout the week and how we manage the active ideas and setups. Thank you all for your likes, comments and follows, we really appreciate it!
Mr Gold
GoldViewFX

Smart Money Playbook: Where Will Gold Hunt Liquidity Next?Gold SMC Daily Plan – 26/08
Market Context (SMC perspective):
Price is consolidating near 3375 after an impulsive bullish move. There’s uncollected liquidity above 3385–3400, an FVG around 3354, and a deep buy zone at 3323–3327. Structure remains bullish unless 3327 is broken.
________________________________________
Key SMC Zones
• Liquidity Pool: 3385–3400 (potential sweep before reversal)
• FVG: 3354 region – watch for reaction
• Buy Zone: 3323–3327 (SL 3320)
• BOS/ChoCH: Upside confirmed above 3354; bearish shift if 3327 breaks
________________________________________
Trading Scenarios (SMC Logic)
1) BUY SCALP – Quick Liquidity Grab
• Entry: 3350–3352 (FVG support)
• SL: 3343
• TP: 3355 → 3360 → 3375 → 3385 → 3400+
Reason: Mitigation of FVG + bullish BOS continuation.
________________________________________
2) BUY ZONE – Swing Setup
• Entry: 3339–3336 (deep OB)
• SL: 3334
• TP: 3340 → 3350 → 3360 → 3365 → 3370 → 3380 → 3390 → 3400+
Reason: Possible liquidity sweep below 3340 before upside continuation.
________________________________________
3) SELL SCALP – Quick Reversal
• Entry: 3380–3383 (above intra-day liquidity)
• SL: 3385
• TP: 3378 → 3374 → 3370 → 3365 → 3360 → 3350
Reason: Sweep of local highs → BOS to downside.
________________________________________
4) SELL ZONE – High-Risk Liquidity Sweep
• Entry: 3400–3402
• SL: 3406
• TP: 3395 → 3390 → 3385 → 3380 → 3370 → 3360
Reason: Hunt major liquidity above 3400, then reversal.
________________________________________
SMC Flow for Today:
• Look for buy confirmations around FVG 3354 or deep buy zone 3327.
• If price sweeps 3385–3400 first, watch for sell setups with BOS confirmation.
• Structure bias flips bearish only if price closes below 3327.

GOLD - SHORT TO $2,880 (UPDATE)The slow burn on Gold continues... 137 days of pure consolidation🩸
Be patient & don't become a victim to the markets by forcing trades.

GOLD A Fall Expected! SELL!
My dear subscribers,
GOLD looks like it will make a good move, and here are the details:
The market is trading on 3378.7 pivot level.
Bias - Bearish
My Stop Loss - 3383.2
Technical Indicators: Both Super Trend & Pivot HL indicate a highly probable Bearish continuation.
Target - 3370.7
About Used Indicators:
The average true range (ATR) plays an important role in 'Supertrend' as the indicator uses ATR to calculate its value. The ATR indicator signals the degree of price volatility.
Disclosure: I am part of Trade Nation's Influencer program and receive a monthly fee for using their TradingView charts in my analysis.
———————————
WISH YOU ALL LUCK

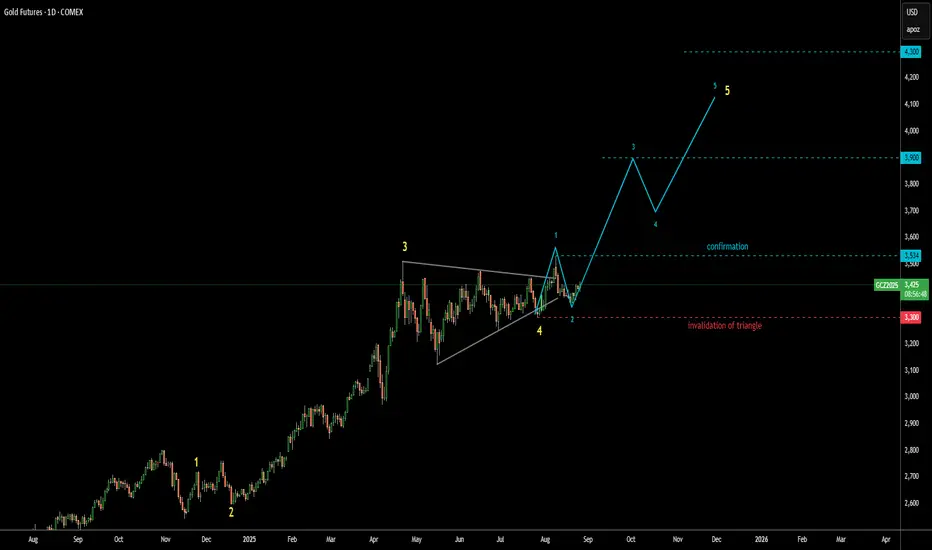
Gold Update 26AUG2025: Bullish Confirmation Above $3,534 The gold futures price has made a U-turn as it didn't trigger Triangle's invalidation at $3,300
This bounce back could be a harbinger of wave 3 within the larger degree wave 5
It will be confirmed once upmove breaks above the top of wave 1 beyond $3,534
I erased the complex correction scenario as the price might be taking off right now
I added the breakdown of the upcoming large wave 5 into smaller 5 waves inside
Target range remains intact between $3,900 and $4,300
Gold Faces Upward Pressure from Multiple SourcesGold is reacting to risks tied to the Trump–Cook showdown, Nvidia earnings, Fed independence, PCE data, and Powell’s dovish short-term shift on rates at Jackson Hole, all of which are giving the metal upward pressure. Key resistance levels stand at 3377, 3384, 3400, and 3411. A break of 3377 and 3384 could increase volatility for the rest of the day.

XAUUSD Technical Analysis – 15m timeframeOn the 15-minute chart, gold is consolidating around 3,374 – 3,376 after a minor pullback from the 3,385 zone. The current price structure is holding above the Fibonacci 0.618 retracement at 3,368 – 3,370, which shows that buyers are still in control of the short-term bullish momentum.
1. Key Resistance Levels
Immediate resistance: 3,385 – 3,390 (highlighted supply zone)
Extended resistance: 3,400 – 3,405 (Fib 3.618 extension)
2. Key Support Levels
Immediate support: 3,368 – 3,370 (Fib 0.618)
Strong support: 3,363 – 3,365 (Fib 0 level)
Deeper support: 3,350 – 3,352
3. Price Action & Technicals
EMA 20/50 (M15): Price is trading above, confirming bullish bias.
RSI (M15): Neutral with room to push higher.
Price action: Since the strong bullish impulse on Aug 23 (marked by the arrow), price has maintained higher lows, showing buyers remain in control.
4. Trading Strategies
Buy on dip (primary plan):
Entry: 3,368 – 3,370
TP1: 3,385 – 3,390
TP2: 3,400 – 3,405
SL: below 3,363
Buy breakout (confirmation trade):
If price closes above 3,390 on M15/H1, look for long entries.
Target: 3,400 – 3,405
SL: below 3,375
Short-term Sell (counter-trade):
If price reaches 3,400 – 3,405 and shows rejection signals, short entries may be considered.
Target: 3,385
SL: above 3,410
Conclusion
Gold remains in a short-term bullish structure. Best setups today are buying dips near 3,368 – 3,370 or buying a confirmed breakout above 3,390. Watch carefully how price reacts around the 3,390 – 3,400 zone for the next directional move.
👉 Save these key levels for your trading plan and follow for more strategies in upcoming sessions.

Gold XAUUSD Long-term BullishThe monthly chart on XAUUSD shows a great BULLISH setup.
A horizontal support level around the $1955 has been broke and confirmed.
Also, a descending trendline support has been broke and confirmed.
Price is currently retracing down and re-testing near prior support which is expected to hold. This is an excellent trading opportunity with low risk and high reward.
Entry = 1955 to 1960
TP = 2060
SL = 1945
Note: This is a long-term chart and therefore very reliable.

XAUUSD: Market Analysis and Strategy for August 26Gold Support and Resistance Levels:
Daily Chart Resistance: 3405, Support: 3320
4-Hour Chart Resistance: 3386, Support: 3350
1-Hour Chart Resistance: 3380, Support: 3368.
Gold is currently within the triangle range and must break through to expand. So far, it has not been able to break through effectively, but today's Asian market news has caused some movement in gold. We will have to see how this holds.
In addition, today's rapid decline in the Asian market coincided with the 3350-3355 range, the support area mentioned yesterday. The rebound indicates that support is valid.
Thus, as long as gold doesn't break below key support today, it will continue to fluctuate upward.
It is important to note that if gold breaks through, it will quickly reach resistance at 3390-3405. We will focus on observing the price's reaction. If resistance is encountered again, it may decline and then fluctuate upward.
During the US trading session, keep an eye on data such as the July durable goods orders rate and the August Conference Board Consumer Confidence Index, which may be the main factors determining today's intraday high.
BUY: 3360near
BUY: 3350near

Gold Supported by Ichimoku Cloud, Upside Bias in PlayHello everyone, looking at the 12H XAU/USD chart, I see gold is consolidating right at the upper edge of the sideways range. Price has held firmly above the Kumo (Ichimoku cloud) and left behind two clear demand FVG zones: 3,345–3,355 and deeper at 3,330–3,345. These often act as a “cushion” for price to rebalance before continuing higher. On the upside, a supply FVG is still hanging around 3.38x and further at 3.40x — making 3,380 the key “wall” that gold needs to break.
The fundamental backdrop looks quite supportive:
After Jackson Hole, Mr. Powell signalled that the Fed could cut rates in September. The probability of a cut via FedWatch has risen sharply, dragging yields lower and cooling the USD.
At the start of the week, the USD staged a technical rebound as the market “reset” risk ahead of a heavy data calendar, causing choppy intraday swings in gold but without breaking the structure above the cloud.
This week’s US calendar is packed: Consumer Confidence, Durable Goods Orders, preliminary GDP, Jobless Claims, and especially core PCE at the end of the week. If data comes in weak, rate cut expectations will be further reinforced.
The PBOC continues to inject large liquidity to support the CNY, easing global cash stress and creating a more favourable environment for gold.
Gold ETF (GLD) holdings remain elevated, showing that investor positions have not weakened significantly. At the same time, US consumer confidence is softening, adding another reason for the Fed to “soften its tone.”
As long as price stays above the Kumo and with the demand FVG 3,345–3,355 right below, I favour the upside scenario. If 3,350 holds, my near-term target is 3,390, with extension to 3,405 (overlapping with the higher supply FVG). This view only weakens if a 12H candle closes below 3,335 — in which case the risk of a deeper pullback to retest the lower FVG increases.
What do you think about the scenario of gold being “backed by the Ichimoku cloud” and heading towards the 3,390–3,405 zone?

DeGRAM | GOLD fixed above the support zone📊 Technical Analysis
● XAU/USD rebounded from the 3,310–3,320 support zone, breaking short-term resistance and confirming a higher low within the structure.
● The move opens the way toward 3,374, with a breakout above this level exposing 3,402 and 3,433 as the next resistance targets.
💡 Fundamental Analysis
● Softer US PMI data and moderating yields have eased USD strength, reviving gold’s safe-haven bid. Recent IMF comments on slower global growth add to demand for protective assets.
✨ Summary
Bullish above 3,320; targets 3,374 → 3,402 → 3,433. Invalidation below 3,310.
-------------------
Share your opinion in the comments and support the idea with a like. Thanks for your support!

GOLD → Consolidation to continue growth towards 3400FX:XAUUSD is updating its local maximum but is facing pressure in the 3375-3400 zone. The market is bullish, but the dollar is consolidating. Traders are waiting for signals and stronger drivers...
Gold resumes growth, approaching the $3400 level, amid a weakening dollar and falling US government bond yields.
Key drivers: Trump's new threats of tariffs on Chinese goods and his attack on the Fed (removal of Lisa Cook) are undermining confidence in US assets (pressure on the dollar).
Soft Fed rhetoric: Expectations of a September rate cut have strengthened after Powell's speech.
Key risks: The dollar's recovery amid trade threats, US economic data may adjust rate expectations, and the escalation of the trade war supports demand for safe assets
The short-term dynamics of gold will depend on the balance between the Fed's soft monetary policy and trade tensions.
Resistance levels: 3379, 3400
Support levels: 3369, 3362, 3358
As part of the correction, the market may test local support zones located within the current trading range, after which gold may return to attack 3375-3379 to continue its growth towards 3400.
Best regards, R. Linda!

XAUUSD – Eyeing the 3,400 BreakoutHello everyone, Kevin here – let’s take a look at OANDA:XAUUSD !
Gold has just staged an impressive rebound, moving close to the 3,400 USD level after a period of accumulation. On the chart, a potential “cup” pattern is taking shape, with the key target being the trendline – a critical technical factor to watch.
Key supports at 3,330 USD and 3,290 USD remain intact, highlighting strong buying pressure on pullbacks. The preferred strategy is still to follow the bullish trend. In addition, the Fed’s recent remarks on interest rates continue to lend support.
If price breaks decisively above the trendline around 3,400 USD, momentum could expand further toward 3,420 – 3,450 USD, which is also my target this time.
And you – what’s your view on XAUUSD’s trend? Drop your thoughts below and let’s discuss!

GOLD: The Market Is Looking Up! Long!
My dear friends,
Today we will analyse GOLD together☺️
The in-trend continuation seems likely as the current long-term trend appears to be strong, and price is holding above a key level of 3,372.04 So a bullish continuation seems plausible, targeting the next high. We should enter on confirmation, and place a stop-loss beyond the recent swing level.
❤️Sending you lots of Love and Hugs❤️

SILVER: Strong Bullish Sentiment! Long!
My dear friends,
Today we will analyse SILVER together☺️
The market is at an inflection zone and price has now reached an area around 38.677 where previous reversals or breakouts have occurred.And a price reaction that we are seeing on multiple timeframes here could signal the next move up so we can enter on confirmation, and target the next key level of 38.812.Stop-loss is recommended beyond the inflection zone.
❤️Sending you lots of Love and Hugs❤️

Silver Daily NEOWAVE Analysis Since its sharp decline of over 15% in April 2025, Silver has been unfolding in a Running Contracting Triangle. The market is currently advancing in Wave D, with Wave E expected to complete the structure. Once Wave B concludes, a bullish thrust to the upside is anticipated; however, failure to materialize could indicate the development of an X-wave instead.

Gold Supported by Rate-Cut Expectations, Data in SpotlightGold (XAUUSD) – Overview
Supported by Fed Cut Bets and Softer Data Outlook
Gold remains well-supported as futures markets are now pricing in two 25bps Fed rate cuts by December. Fed Chair Jerome Powell has signaled rising risks to the labor market, even amid elevated inflation, suggesting the Fed may need to adjust its restrictive stance.
This dovish bias continues to weigh on U.S. Treasury yields and supports gold. The upcoming U.S. GDP growth and PCE inflation data will be critical — softer readings could reinforce expectations of rate cuts and push gold higher.
🔹 Technical Outlook
Gold is attempting to stabilize in the bullish zone.
Stability above 3,366 keeps the upside open toward 3,383 and 3,401.
If price stabilizes below 3,366, a correction toward 3,357 – 3,350 is likely.
A confirmed break below 3,350 would shift bias bearish and expose deeper levels.
🔹 Key Levels
Resistance: 3,383 – 3,401
Support: 3,357 – 3,350 – 3,343
✅ Summary:
Gold is consolidating near its pivot with Fed policy expectations providing a bullish backdrop. Holding above 3,366 favors further upside, while a break below 3,350 would signal weakness and invite a deeper correction.
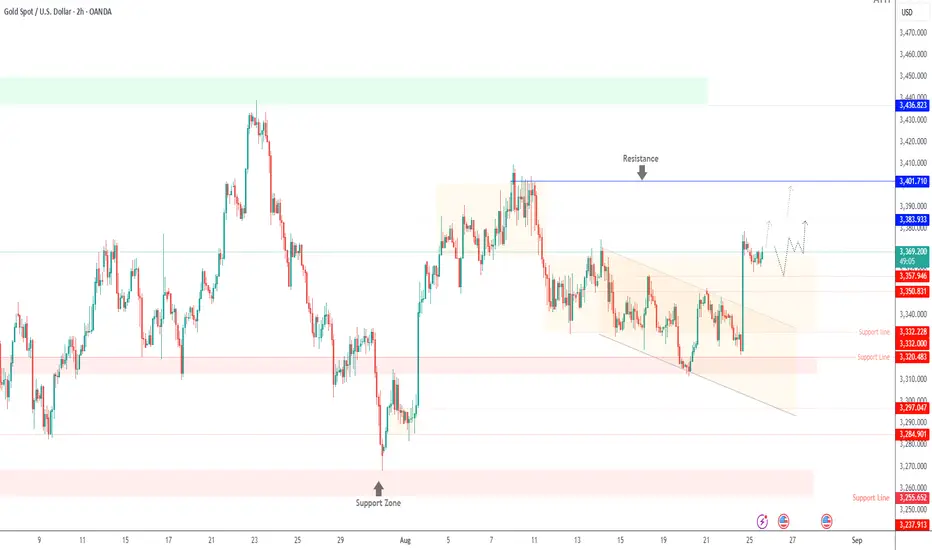
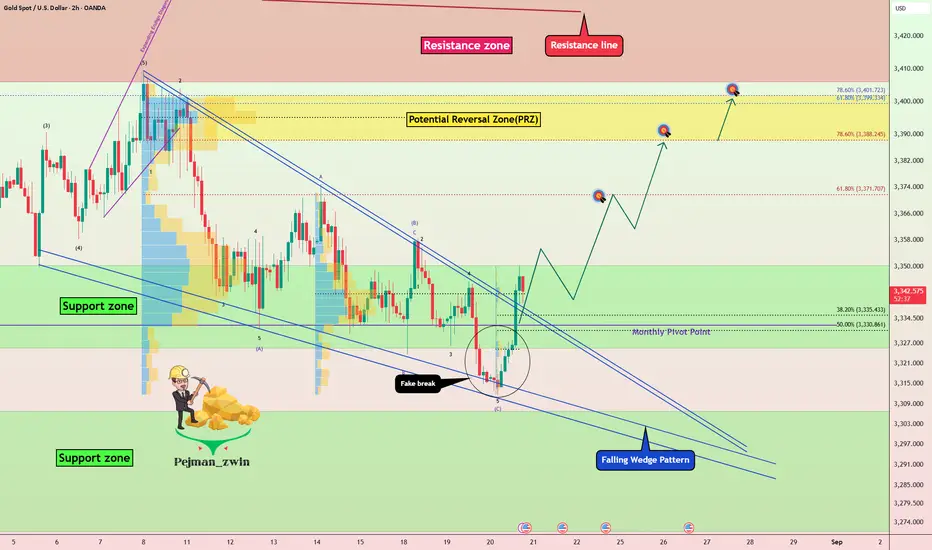
Gold Breaking Out of Falling Wedge Pattern – Rally Ahead?After creating a fake break below the Support zone($3,350-$3,326) , Gold ( OANDA:XAUUSD ) rose again above this zone and the Monthly Pivot Point .
If we look at the Gold chart on the 2-hour time frame from a Classic Technical Analysis perspective, we can see a falling reversal pattern , with Gold currently breaking the upper line of this pattern .
In terms of Elliott Wave theory, it seems that Gold is completing a corrective wave , and we should wait for the next impulse wave .
I expect Gold to start rising from the Support zone($3,350-$3,326) and rise to at least $3,369.
Second Target: Potential Reversal Zone(PRZ) = $3,402-$3,388
Note: Stop Loss (SL) = $3,320
Note: From today until Friday, important indexes will be released from the US, which can create excitement in financial markets, especially Gold, and even change the market trend when released.
FOMC Meeting Minutes = Today
Unemployment Claims = Tomorrow
Flash Manufacturing /Services PMI = Tomorrow
Fed Chair Powell Speaks = Friday
Gold Analyze (XAUUSD), 2-hour time frame.
Be sure to follow the updated ideas.
Do not forget to put a Stop loss for your positions (For every position you want to open).
Please follow your strategy; this is just my idea, and I will gladly see your ideas in this post.
Please do not forget the ✅ ' like ' ✅ button 🙏😊 & Share it with your friends; thanks, and Trade safe.
XAUUSD (Gold vs USD) on the 1H timeframe.XAUUSD (Gold vs USD) on the 1H timeframe with Ichimoku cloud, trendlines, and marked target zones.
From what’s visible:
Current price: around 3340.38
First target (TP1): around 3356 – 3360 zone (mid-green zone labeled "TARGET POINT")
Second target (TP2): around 3375 – 3380 zone (upper green zone labeled "TARGET POINT")
📌 So my chart suggests a potential bullish move with Target 1 = ~3360 and Target 2 = ~3375–3380.

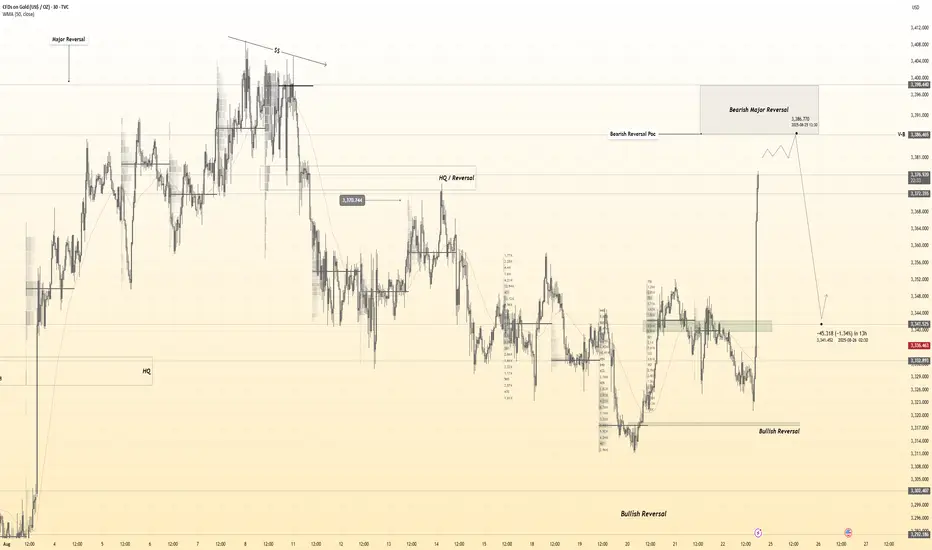
Gold 30Min Engaged ( Bearish Reversal Entry Detected )Time Frame: 30-Minute Warfare
Entry Protocol: Only after volume-verified breakout
🩸Bearish Reversal - 3386
➗ Hanzo Protocol: Volume-Tiered Entry Authority
➕ Zone Activated: Dynamic market pressure detected.
The level isn’t just price — it’s a memory of where they moved size.
Volume is rising beneath the surface — not noise, but preparation.
🔥 Tactical Note:
We wait for the energy signature — when volume betrays intention.
The trap gets set. The weak follow. We execute.
MarketBreakdown | EURUSD, USDCAD, USDJPY, SILVER
Here are the updates & outlook for multiple instruments in my watch list.
1️⃣ #EURUSD daily time frame 🇪🇺🇺🇸
The pair is now consolidating within a wide horizontal range.
We see a test of its support now.
Probabilities will be high, that a bullish movement will follow from that.
2️⃣ #USDCAD daily time frame 🇺🇸🇨🇦
The pair is positioned strongly bullish,
respecting a solid rising trend line after a pullback.
With a high probability, growth will continue.
3️⃣ #USDJPY daily time frame 🇯🇵🇺🇸
Similarly to EURUSD, the pair is consolidating.
The price is trading in the middle of the horizontal
parallel channel.
With a high probability, it will start growing soon
and reach the resistance of the range.
4️⃣ #SILVER #XAGUSD daily time frame 🪙
The price has recently updated a local high, breaking
a significant horizontal resistance cluster.
We see its retest now. There is a great chance that
the market will cotinue rising soon.
Do you agree with my market breakdown?
❤️Please, support my work with like, thank you!❤️
I am part of Trade Nation's Influencer program and receive a monthly fee for using their TradingView charts in my analysis.
