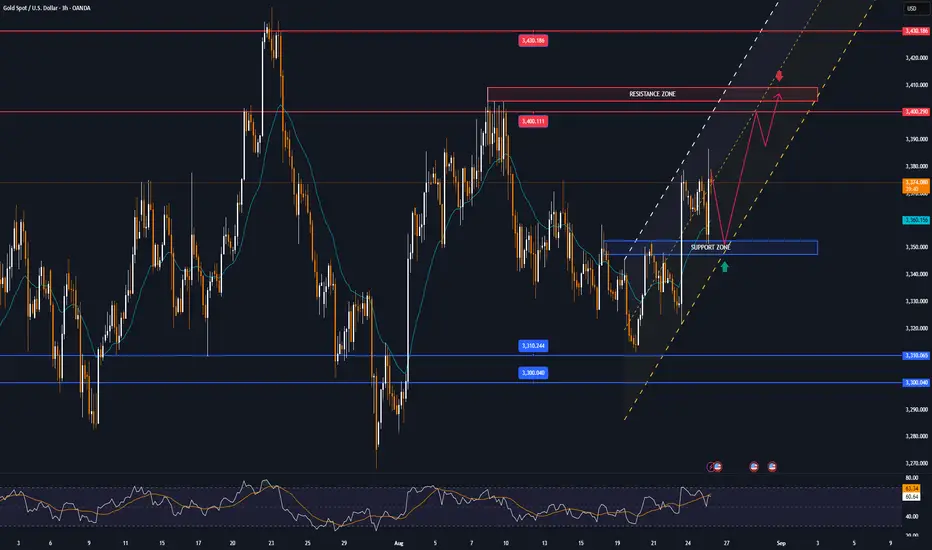
Gold Consolidates Near Key Support – Breakout Ahead?Gold is currently trading near $3,351, consolidating within a tight range after breaking below the ascending trendline from recent higher lows. The market is hovering in a demand zone between $3,342 – $3,360, suggesting indecision before the next move. Gold remains in a short-term consolidation phase, with the broader trend still inside an ascending channel. If buyers hold the $3,342 zone, a rebound toward $3,375–$3,400 is likely. However, sustained pressure below $3,342 could shift momentum in favor of sellers, targeting $3,317 and potentially deeper into the channel support.
🔑 Key Levels to Watch
- Resistance: $3,367 → $3,383
- Support: $3,342 → $3,317 → $3,302
- Breakout Zones: Below $3,338: Opens room to $3,310 and below. Above $3,390: May lead to fresh highs toward $3,410+
Note
Please risk management in trading is a Key so use your money accordingly. If you like the idea then please like and boost. Thank you and Good Luck!
Metals

GOLD spikes after Trump's move, with technical conditionsOANDA:XAUUSD surges after Trump's move, US President Donald Trump decided to fire Federal Reserve Governor Lisa Cook over allegations that she falsified mortgage records. The news affected the US Dollar index to fall sharply in early Asian trading on Tuesday (August 26), while spot gold prices rose nearly 35 dollars.
On Monday evening local time, US President Trump posted a letter to Federal Reserve Governor Cook on the social media platform Truth Social, stating that he would remove Federal Reserve Governor Cook from his position, effective immediately.
Trump stated in the document: "By virtue of the authority vested in me under Article II of the United States Constitution and the Federal Reserve Act of 1913, as amended, I hereby order to immediately remove Mr. Cook from his position on the Board of Governors of the Federal Reserve System.
Given Mr. Cook’s fraudulent financial conduct and potential criminal conduct, I have no confidence in his integrity.
At the very least, these actions expose his serious negligence in financial dealings and call into question his competence and credibility as a financial regulator.”
“The American people must have full confidence in the integrity of those who set policy and oversee the Federal Reserve,” Trump said. “Given his fraudulent and even criminal conduct in financial matters, they cannot have that confidence, and I have no confidence in his integrity.”
The move comes after the U.S. Justice Department said it plans to investigate Cook after Federal Housing Finance Agency Director Bill Pulte filed criminal charges alleging possible mortgage fraud.
Bloomberg News reported that the investigation is the latest in a series of moves by the Trump administration to increase regulatory scrutiny of Democratic figures and put pressure on the Federal Reserve.
TVC:DXY Falls Sharply, Gold Price Spikes Nearly $35 in Short Term
The US Dollar Weakens Against All Major Currencies After Trump Fires Federal Reserve Governor Cook. Bloomberg said Trump's move has undermined people's confidence in the US Dollar, the world's reserve currency.
Cook’s departure is bad for the Dollar as it opens the door for President Trump to appoint a new governor who may be more inclined to cut interest rates. This further challenges the independence of the Federal Open Market Committee (FOMC), the cornerstone of the Dollar’s safe-haven status, and this could lead to further sell-offs in the Dollar, and of course, gold, which is directly correlated to the Dollar, will receive support from this.
Technical Outlook Analysis OANDA:XAUUSD
Gold briefly surged above the 0.236% Fibonacci retracement level after the news but has now pared its intraday gains back below the said Fibonacci retracement level.
However, it is also achieving the initial technical conditions for a bullish outlook in the short term with price action above the EMA21 and the Relative Strength Index (RSI) moving above 50, an RSI above 50 with some significant slope would be a reliable signal for momentum support.
In terms of the overall technical picture, gold has not yet established a specific long-term trend with a sideways accumulation state that has lasted for the past few months, depicted by the green rectangle.
Therefore, short-term trades are preferred in the current technical context, and the key points for this trading day are listed below.
Support: 3,350 – 3,310 – 3,300 USD
Resistance: 3,371 – 3,400 – 3,430 USD
SELL XAUUSD PRICE 3407 - 3405⚡️
↠↠ Stop Loss 3411
→Take Profit 1 3399
↨
→Take Profit 2 3393
BUY XAUUSD PRICE 3350 - 3352⚡️
↠↠ Stop Loss 3346
→Take Profit 1 3358
↨
→Take Profit 2 3364
Gold (XAUUSD) Intraday Analysis – Key Levels and Trading StrategTechnical Outlook
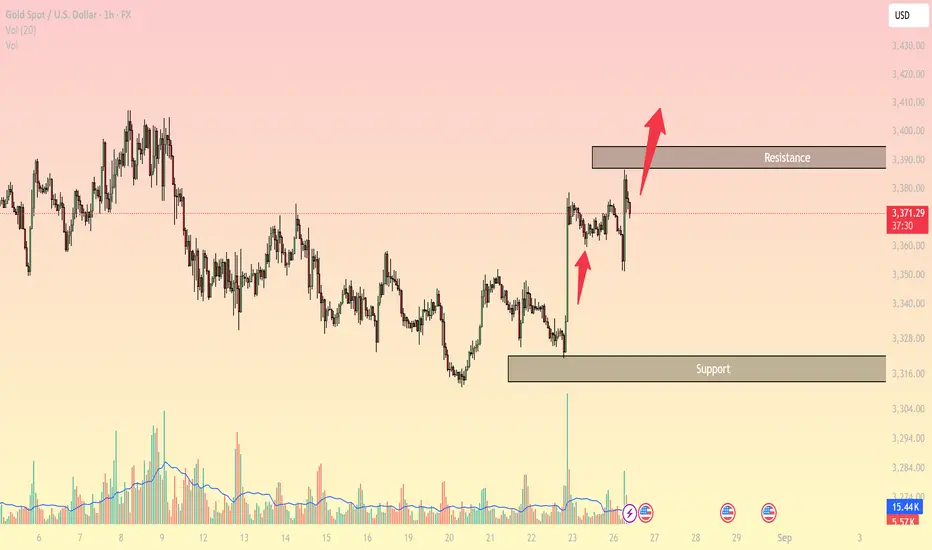
Gold has bounced strongly from the support area around 3316 – 3320 and is now heading toward the resistance zone 3385 – 3395. Price action shows momentum is recovering after a period of consolidation, but the market is approaching a critical decision point.
Resistance levels:
3385 – 3395: First key resistance zone. A breakout above this area could open the door toward 3410 – 3420.
3410 – 3420: Major resistance aligned with previous highs.
Support levels:
3316 – 3325: Nearest support, origin of the recent rally.
A breakdown below this area may push price back toward 3290 – 3300.
Indicators & Price Behavior
EMA 20 (H1): Slope is turning upward, signaling short-term bullish momentum.
RSI (H1): Not yet in overbought territory, suggesting room for further upside.
Volume profile: Strong buying volume confirmed the rebound from support, showing buyers are active again.
Trading Strategies
Scenario 1 – Bullish Continuation:
Look for a pullback toward 3350 – 3360. If bullish candlestick confirmation appears, consider long positions targeting 3385 – 3395, with extended target at 3410. Stop loss below 3340.
Scenario 2 – Resistance Rejection:
If price reaches 3385 – 3395 and forms bearish reversal signals (e.g., pin bar, bearish engulfing, increasing selling volume), consider short positions targeting 3355 – 3360, with stop loss above 3400.
Conclusion
Gold is showing recovery momentum in the short term, but the 3385 – 3395 resistance zone will be crucial. Traders should patiently watch price reaction here before entering new positions.
Stay tuned for more strategies and remember to save this analysis if you find it useful.
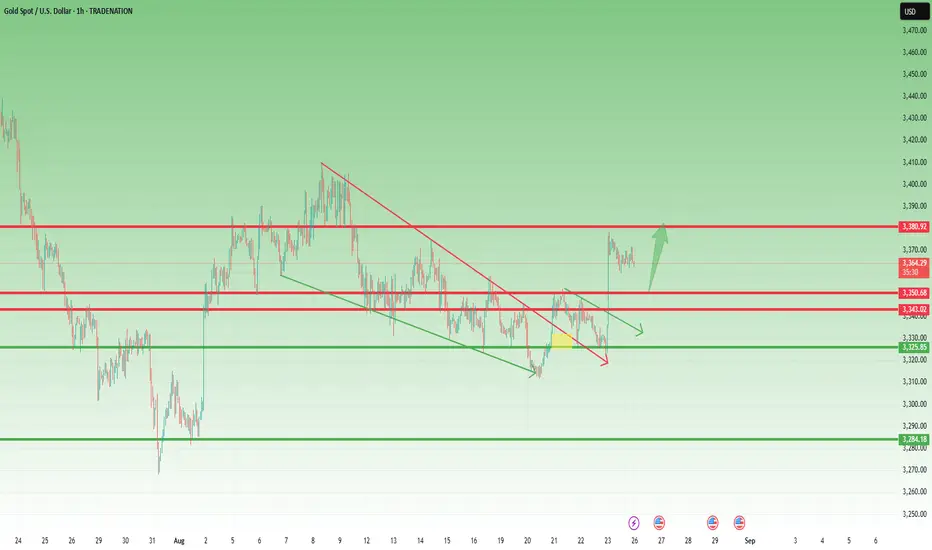
Gold Analysis- Quick UpdateAs I said yesterday, Gold looks bullish overall, not just on XAUUSD.
Right now, price is correcting after Friday’s huge rally – perfectly normal. The key level to watch is 3350 for buyers to step in.
For confirmation, we need a break above 3380. If that happens, I believe 3400 will fall this time, and in the medium term we could even see a test of the old 3500 ATH.
At the moment I’m out of the market, waiting for a trade that’s worth the risk. Patience is also a position. 🚀
Disclosure: I am part of TradeNation's Influencer program and receive a monthly fee for using their TradingView charts in my analyses and educational articles.
XAUUSD – Bullish Sentiment Stays StrongHello everyone, what’s your view on OANDA:XAUUSD trend?
Last week, gold staged an impressive breakout in the final session, and it is now trading around 3360 USD.
This week, optimism remains strong across the market, with both Wall Street analysts and Main Street investors expecting higher gold prices.
Among 13 Wall Street experts surveyed, 8 (62%) forecast gold will rise, while 5 (38%) see prices moving sideways. None predicted a decline.
On the retail side, 194 Main Street investors participated in a Kitco News poll. 115 (59%) expect gold to climb, 35 (18%) anticipate a drop, and 44 (23%) remain neutral.
I also maintain a bullish outlook. What about you — where do you see XAUUSD heading this week?

Gold Faces Short-Term Cooling: Watch the Gap at 3,355–3,345Hello everyone, looking at this H2 chart, what do you see in XAU/USD?
Technically, gold has just spiked sharply and is now trading narrowly just below 3,372–3,375 USD. The spike left a very clear bullish Fair Value Gap (FVG) at 3,355–3,345 USD. On the Ichimoku cloud, the price has just slightly exceeded the cloud’s edge, but the forward kumo is fairly flat – a setup that often “pulls” price back to test the gap before any further breakout.
Above, the old supply FVG around 3,372–3,375 USD still shows where price was restrained, with a series of short-bodied candles and long upper wicks. Below, the green FVG at 3,355–3,345 lies near the cloud’s edge – a new equilibrium formed after the spike.
What stands out is how price is “holding its breath” just below 3,372 while the flat kumo stretches ahead and the FVG sits right beneath: this trio often signals a technical retracement to fill the gap at 3,355–3,345 before the market decides the next move.
Watch price action around 3,372 closely: if rejected at the old supply FVG, the likelihood of a pullback to 3,355 → 3,345 is high. Only a firm H2 close above 3,372 would brighten the chance of continuing to 3,380.
What do you think about this gap-fill scenario? Leave your thoughts in the comments below!

Bullish bounce off?The Gold (XAU?USD) has bounced off the pivot, which has been identified as a pullback support and could potentially rise to the swing high resistance.
Pivot: 3,350.47
1st Support: 3,307.78
1st Resistance: 3,431.19
Risk Warning:
Trading Forex and CFDs carries a high level of risk to your capital and you should only trade with money you can afford to lose. Trading Forex and CFDs may not be suitable for all investors, so please ensure that you fully understand the risks involved and seek independent advice if necessary.
Disclaimer:
The above opinions given constitute general market commentary, and do not constitute the opinion or advice of IC Markets or any form of personal or investment advice.
Any opinions, news, research, analyses, prices, other information, or links to third-party sites contained on this website are provided on an "as-is" basis, are intended only to be informative, is not an advice nor a recommendation, nor research, or a record of our trading prices, or an offer of, or solicitation for a transaction in any financial instrument and thus should not be treated as such. The information provided does not involve any specific investment objectives, financial situation and needs of any specific person who may receive it. Please be aware, that past performance is not a reliable indicator of future performance and/or results. Past Performance or Forward-looking scenarios based upon the reasonable beliefs of the third-party provider are not a guarantee of future performance. Actual results may differ materially from those anticipated in forward-looking or past performance statements. IC Markets makes no representation or warranty and assumes no liability as to the accuracy or completeness of the information provided, nor any loss arising from any investment based on a recommendation, forecast or any information supplied by any third-party.

GC 8/26 Outlook – Filling the H4 FVG, Trend Not Ready YetPrice is finally working down into the H4 FVG (3377–3396 zone) after rejecting the Daily FVG overhead (~3425–3440). This is the key area of interest going into Tuesday’s trading sessions.
🔑 Context:
Daily FVG above → unfilled liquidity magnet for the future.
H4 FVG below → currently being filled, acting as the main battleground.
Daily Low (3405) already taken; price now sitting between liquidity pools.
ADX < 25 (HTFs) → No strong trending environment yet, so expect more range-like behavior until a side commits.
📌 What I’m Watching:
Reaction inside the H4 FVG → Looking for either absorption/reversal (bullish case) or continuation through to lower liquidity.
Liquidity Levels:
Midpoint of H4 FVG (~3394).
Bottom of H4 FVG (~3377).
Weekly/Monthly Lows (3353 / 3347) if downside momentum extends.
Killzones:
Asian: Likely to set the range.
London: Could raid deeper into FVG.
NY: Potential reaction leg (either reversal or continuation).
📊 Bias: Neutral → short-term bearish into H4 FVG completion. Waiting for a clear reaction to confirm the next trending move.

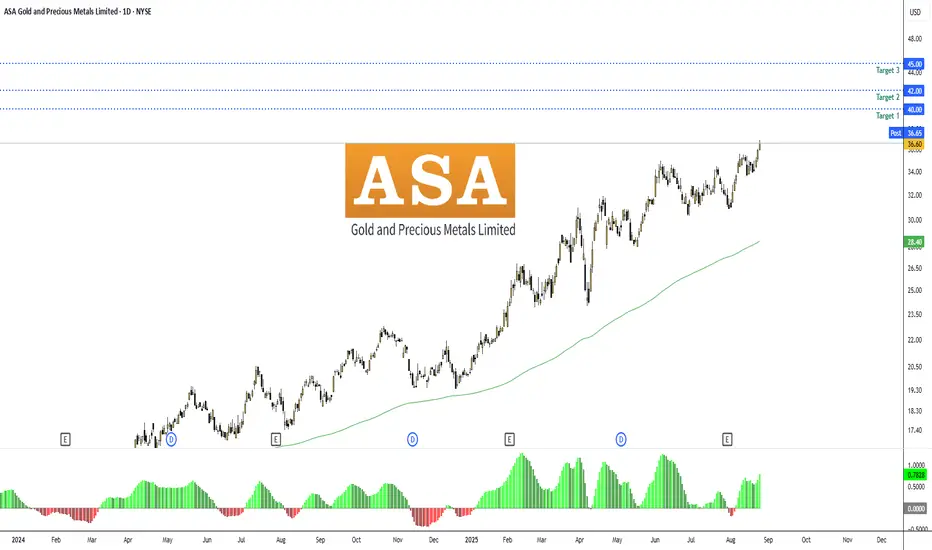
Insider: ASA Gold and Precious Metals LimitedNYSE:ASA #ASA — ASA Gold and Precious Metals Ltd | Financial | Closed-End Fund - Equity | USA | NYSE | August 25, 2025.
Insider Purchase and Company Overview
Recent insider filings for ASA Gold and Precious Metals Limited (NYSE: ASA), a closed-end investment fund focused on companies engaged in the exploration, mining, or processing of gold and other precious metals, reveal aggressive accumulation by major shareholder Saba Capital Management, L.P. As a 10% owner, Saba executed two notable purchases in late August 2025: on August 21, 2025, acquiring 6,710 shares at $35.05 per share for a total value of $231,380, and on August 22, 2025, adding 4,632 shares at $35.97 per share for $166,181.
These transactions, disclosed via SEC Form 4 on August 25, 2025, boosted Saba's total holdings to 4,077,634 shares, representing a significant stake in the fund. This activity is part of a broader pattern of buying by Saba throughout August 2025, including larger acquisitions such as 9,943 shares on August 19 at $33.99, 18,310 shares on August 15 at $34.24, 8,310 shares on August 14 at $33.89, 1,836 shares on August 13 at $35.11, 354,169 shares on August 12 at $35.39, and a substantial buy on August 11 valued at approximately $11.4 million at $35.00 per share.
Saba Capital, led by activist investor Boaz Weinstein, has been increasing its position amid an ongoing proxy battle and governance disputes with ASA's board, signaling strong conviction in the fund's undervaluation relative to its net asset value (NAV) and the bullish outlook for precious metals. No other significant insider purchases from executives or directors were reported in August 2025, but institutional interest is evident, with Sprott Inc. maintaining a $8.45 million stake as of recent filings.
➖ www.nasdaq.com
➖ www.marketbeat.com
News Analysis
August 2025 news for ASA has been dominated by governance changes and activist developments. On August 22, 2025, the company announced the resignation of directors William Donovan and Mary Joan Hoene, alongside the appointment of Karen Caldwell to the board—a move that may reflect ongoing pressure from Saba Capital to refresh leadership and address the fund's persistent discount to NAV (historically trading at 10-20% below its underlying assets).
Earlier in the month, ASA filed an 8-K on August 7, 2025, likely related to operational updates, and released its August Gold Chart Book on August 1, highlighting positive trends in gold mining equities amid rising metal prices. Saba's activism, which includes a dropped lawsuit in July 2025 over expired anti-takeover measures (poison pills) and ongoing proxy proposals to expand the board, underscores their push for value unlocking, such as potential conversions or mergers.
No other major insiders or traders reported buys in August, but Saba's consistent accumulation (totaling over $20 million in value across the month) positions them as the dominant force, with holdings now exceeding 4 million shares. This activist involvement could catalyze premium narrowing or strategic actions, boosting shareholder value.
Charts:
• (1D)
• (3D)
SEC From 4:
www.sec.gov
Forecast:
Replicating Saba's recent buys at an average entry of ~$35.50 (blending the August 21-22 transactions), the setup offers solid upside potential in a precious metals bull market, supported by technical strength and activist catalysts. I estimate a 15-30% growth potential over the next 3-6 months, assuming gold prices remain elevated above $3,364/oz and Saba's activism yields positive outcomes like board expansions or discount-narrowing measures.
Entry Price: $35.50. (current/insider level).
Recommended Exit Targets:
➖ Conservative Target 1: $40.00 (13% profit, +$4.50/share)
➖ Moderate Target 2: $42.00 (18% profit, +$6.50/share)
➖ Aggressive Target 3: $45.00 (27% profit, +$9.50/share)
Stop-Loss: $32.00 (10% downside risk, -$3.50/share) – Below 20-day SMA to guard against pullbacks.
Overall Potential: 15-30% growth, with a risk-reward ratio of ~1:2 at the moderate target.
Risks include gold price volatility, failed activism (e.g., prolonged proxy fights), or broader market corrections in commodities. Position sizing should be 1-3% of portfolio given the fund's sensitivity to metal prices.
Latest Gold Trend Analysis and Strategy for August 25th:
I. Analysis of Core Market Drivers
Reason for the Recent Surge: Gold prices surged sharply on Friday (August 22nd), reaching a high of 3,377, primarily due to the convergence of three factors:
Rising expectations of rate cuts: The market is betting that the Federal Reserve will begin its rate cut cycle early.
Concerns about economic risks: Risk aversion boosts gold's appeal.
Weaker US dollar: The US dollar index fell, supporting dollar-denominated gold.
Underlying Logic: The market believes the Federal Reserve's policy focus has shifted from "fighting inflation first" to "balancing employment and inflation." This expectation is priced in by the market in advance and reflected in the gold price.
Future Focus: Whether the upward trend can continue depends entirely on whether the "rate cut expectations" are confirmed by economic data.
Key Focus:
August Non-Farm Payrolls (NFP)
August Consumer Price Index (CPI)
September Federal Reserve meeting: These three events will determine the medium- and long-term direction of gold.
II. Technical Analysis: Bullish and Bearish Perspectives
Medium- to Long-Term Perspective (Bearish):
View: The monthly chart shows consecutive doji candlestick formations, indicating a fierce battle between bulls and bears at high levels. We maintain the view that "every upward move is a preparation for a larger decline in the future."
Bearish Target Path:
Short-Term Target: Target the 3330 → 3315 → 3300 → 3270 support areas.
Ultimate Target: After breaking below 3245, target the 3150-3120 area, or even the 3000-2950 range.
Short-Term Perspective (Key Decision Points):
Current Situation: Gold prices are at a critical crossroads. The market is deciding whether the next step will be a "short-term rebound followed by a decline" or a "direct break below key support."
Key Support Zone: 3325-3320 represents the recent strength-weakness dividing line, with strong support at 3315 below.
Friday's Verification: Gold prices successfully tested 3325 support and then staged a strong V-shaped reversal, breaking through the previous high. This initially confirms the validity of this support area and indicates a shift in short-term momentum from bearish to bullish.
III. Specific Trading Strategy
Based on the strong technical rebound and breakout of the key support level, the following short-term long strategy is formulated:
Trading Direction: Short-term long on dips
Ideal Entry Area: 3352-3348
Stop-Loss: 3345 (If the price falls back and effectively breaks below this level, the breakout has failed, and long positions should be exited immediately.)
Target Prices:
First Target: 3360-3365
Second Target: 3374 (near the previous high)
Third Target: 3385
IV. Risk Warning
This strategy is based on current market news and technical analysis. The medium- to long-term bearish trend remains unchanged. This is primarily a short-term rebound strategy.
Please closely monitor the three major risk events mentioned above (non-farm payrolls, CPI, and the Federal Reserve meeting). Any unexpected data could reverse market sentiment and invalidate the strategy. Position management is crucial. Be sure to keep a light position and set a strict stop-loss.

The weekly line ends with a big sun, and go long on Monday#XAUUSD
On Friday, gold prices rose unilaterally due to Powell's remarks, and the price of gold stabilized at a high level, 🚀breaking the continuous volatility pattern this week.📊
On Friday, gold hit a high of around 3,380, which happens to be the key trend pressure line. ↘️This pressure line is formed by connecting the previous highs of 3438, 3410 and 3380, and is the short-term resistance level that we focus on in this week's volatile pattern.🌈
This is why I reminded everyone on Friday night that you can consider trying a light position short at 3375-3385, 📉and our target area on Friday is 3356-3345, which is not only the top and bottom conversion position, but also the 38.2% golden point in Fibonacci.🎯
Considering the current news impact and technical patterns, the probability of the market turning directly short next week is relatively small. 🐂
On the one hand, the unilateral bullish sentiment triggered by Powell’s remarks on Friday has not completely subsided, and the current price is still in the short-term upward trend channel, lacking a clear signal of turning bearish.📈 On the other hand, the current market has not yet fallen back to the key moving average support, and the upward support structure is still in place in the short term, making it more difficult to fall in the short term.🥅
Therefore, at the beginning of next week, we can still refer to the resistance and support areas given on Friday. 💻Those who are conservative may consider waiting for gold to return to support for steady trading.📈
🚀 BUY 3356-3345
🚀 TP 3375-33385-3400

The reason we still have EURUSD bulls in play
If you check my chart I have used the 4HR TF to show the reaction points well. The reason I am maintaining a bullish stance is because of Powell's comments on rate cut. The comments indicated a dovish tone while at the same time signaling uncertainty in the policy rate path. With these comments the dollar still remains at risk. Therefore any sell offs are just retests. The only major event this week is the QGDP which is expected to rise. A higher than expected will only push the pair for retest to the marked levels.

GOLD M15 MARKET STRUCTURE Gold Bullish Structure !
Gold Buy Zones : 3373 (CISD)
Gold Buy Zone : 3362 , 3358 (BASE BUY)
Gold Buy Zine : 3368 , 3364 (IFVG + FVG)
Manage Your Trade With Risk Management
Good Luck With Your Trading

Gold 30Min Engaged ( Reversal and break out Entry Detected )Time Frame: 30-Minute Warfare
Entry Protocol: Only after volume-verified breakout
🩸Bullish Break Out - 3373
🩸Bearish Reversal - 3386
-------
🩸Bearish Break Out - 3358
🩸Bullish Reversal - 3346
➗ Hanzo Protocol: Volume-Tiered Entry Authority
➕ Zone Activated: Dynamic market pressure detected.
The level isn’t just price — it’s a memory of where they moved size.
Volume is rising beneath the surface — not noise, but preparation.
🔥 Tactical Note:
We wait for the energy signature — when volume betrays intention.
The trap gets set. The weak follow. We execute.
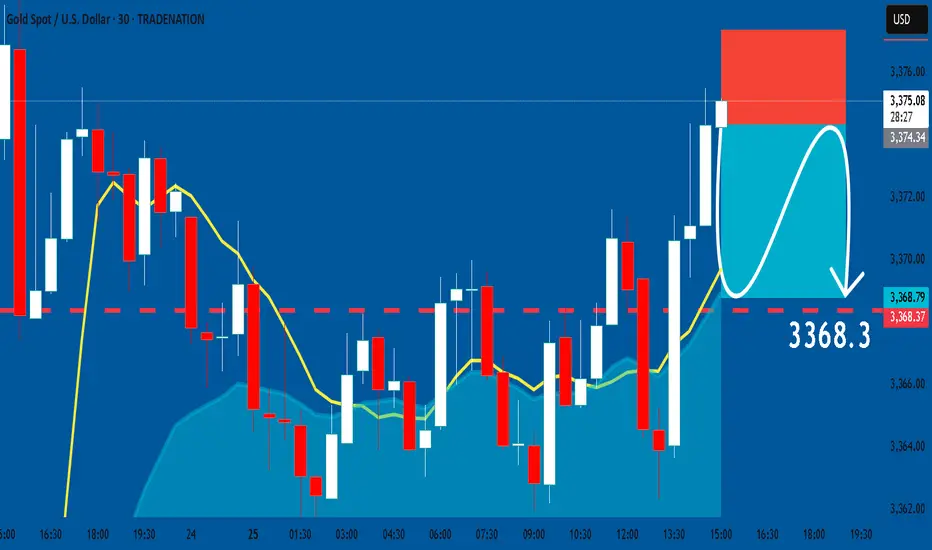
GOLD: Short Signal Explained
GOLD
- Classic bearish formation
- Our team expects pullback
SUGGESTED TRADE:
Swing Trade
Short GOLD
Entry - 3374.2
Sl - 3377.3
Tp - 3368.3
Our Risk - 1%
Start protection of your profits from lower levels
Disclosure: I am part of Trade Nation's Influencer program and receive a monthly fee for using their TradingView charts in my analysis.
❤️ Please, support our work with like & comment! ❤️
GOLD ROUTE MAP UPDATEHey Everyone,
Strong start to the week on our 1H chart route map. We first saw our bearish target at 3365 hit, followed by a no cross and a lock below the Goldturn, confirming rejection. This set up the perfect bounce, aligning with our buy-the-dip strategy and giving us a solid catch. The bullish gap 3390 still remains open for the test.
We will see levels tested side by side until one of the weighted levels break and lock to confirm direction for the next range.
We will keep the above in mind when taking buys from dips. Our updated levels and weighted levels will allow us to track the movement down and then catch bounces up.
We will continue to buy dips using our support levels taking 20 to 40 pips. As stated before each of our level structures give 20 to 40 pip bounces, which is enough for a nice entry and exit. If you back test the levels we shared every week for the past 24 months, you can see how effectively they were used to trade with or against short/mid term swings and trends.
The swing range give bigger bounces then our weighted levels that's the difference between weighted levels and swing ranges.
BULLISH TARGET
3390
EMA5 CROSS AND LOCK ABOVE 3390 WILL OPEN THE FOLLOWING BULLISH TARGETS
3422
EMA5 CROSS AND LOCK ABOVE 3422 WILL OPEN THE FOLLOWING BULLISH TARGET
3439
BEARISH TARGETS
3365 - DONE
EMA5 CROSS AND LOCK BELOW 3365 WILL OPEN THE FOLLOWING BEARISH TARGET
3347
EMA5 CROSS AND LOCK BELOW 3347 WILL OPEN THE FOLLOWING BEARISH TARGET
3324
EMA5 CROSS AND LOCK BELOW 3324 WILL OPEN THE SWING RANGE
3304
3281
As always, we will keep you all updated with regular updates throughout the week and how we manage the active ideas and setups. Thank you all for your likes, comments and follows, we really appreciate it!
Mr Gold
GoldViewFX

Gold SMC Playbook 25/08 – Liquidity Hunt at 3400 & 3325Market Context (SMC perspective)
Price is consolidating around 3367 after a strong impulsive push up and is currently reacting near minor resistance.
Clear ChoCH & BOS patterns confirm bullish intent on H1; however, liquidity pools remain below 3343 & 3325 (buy-side liquidity).
Imbalance zones identified: 3343–3341 and deeper 3325–3323 OB zone.
Key Levels
Resistance (Supply): 3372 – 3382 – 3389
Support (Demand): 3350 – 3342 – 3325
SMC Bias: Mixed – Play Both Long & Short Setups Around Liquidity
🔴 SELL Scenario (Short-term Liquidity Grab)
Entry: 3400 – 3403 (above local liquidity sweep)
Stop Loss: 3408
Targets:
TP1: 3390 (partial)
TP2: 3380
TP3: 3370
TP4: 3360 (open 3350 liquidity zone)
Rationale: Anticipate a sweep above 3400 into supply, then mitigation and sell-off.
🟢 BUY Scenario (Bullish Continuation from Demand OB)
Entry 1 (Scalp Buy): 3343 – 3341 (reactive zone) SL 3337
Entry 2 (Main OB): 3325 – 3323 (strong OB) SL 3319
Targets:
TP1: 3330
TP2: 3340
TP3: 3350
TP4: 3370 (open 3390 liquidity)
Rationale: Price may retrace to fill imbalance below 3340 and mitigate OB at 3325 before next bullish impulse.
Execution Plan (SMC flow):
Wait for liquidity sweep at highs or lows (above 3400 or below 3325) with confirmation.
Look for ChoCH & BOS on LTF (M5–M15) around OB for entry confirmation.
Trail SL to protect profits after TP1 hit; partial out and hold runner toward final liquidity target.

SILVER: Move Down Expected! Short!
My dear friends,
Today we will analyse SILVER together☺️
The in-trend continuation seems likely as the current long-term trend appears to be strong, and price is holding below a key level of 38.918 So a bearish continuation seems plausible, targeting the next low. We should enter on confirmation, and place a stop-loss beyond the recent swing level.
❤️Sending you lots of Love and Hugs❤️

XAUUSD: Market Analysis and Strategy for August 25Gold fluctuated at low levels in the Asian session last Friday. Powell's dovish speech during the New York session significantly increased the probability of a September rate cut, with the possibility of subsequent rate cuts. Gold surged from around $3,330 to above $3,378, closing the daily chart with a sharp rise. During the week, gold prices rebounded after probing a bottom. Influenced by Powell's dovish speech, gold's rise accelerated, breaking through significant resistance and currently stabilizing above the middle Bollinger band. This week, it's undoubtedly advisable to buy on pullbacks, observing the continuation of the bullish trend and the strength of any potential downside corrections. Given the current surge in expectations for rate cuts, it's advisable to wait for a confirmed pullback before buying.
For intraday trading, 3358 was a resistance level repeatedly mentioned last week. After breaking through on Friday, it continued to rise and stalled around 3378. Today's Asian session saw a slight pullback from Friday's high, with 3358 forming a top-bottom reversal point. This is the primary intraday support level, followed by 3344, which will become a key line of defense for this bullish trend. We recommend buying around 3358 and waiting for market confirmation. Profit-taking is recommended near Friday's high. If it breaks through 3378, wait for a small pullback to continue the bullish trend. If the pullback is significant, the area around 3344 will remain bullish support. For specific trading strategies, see a bullish trend above 3358, targeting 3378. A break above 3378 could target 3400-3410.
BUY: 3358near
BUY: 3344near

GOLD: Absolute Price Collapse Ahead! Short!
My dear friends,
Today we will analyse GOLD together☺️
The price is near a wide key level
and the pair is approaching a significant decision level of 3,372.49 Therefore, a strong bearish reaction here could determine the next move down.We will watch for a confirmation candle, and then target the next key level of 3,369.27.Recommend Stop-loss is beyond the current level.
❤️Sending you lots of Love and Hugs❤️

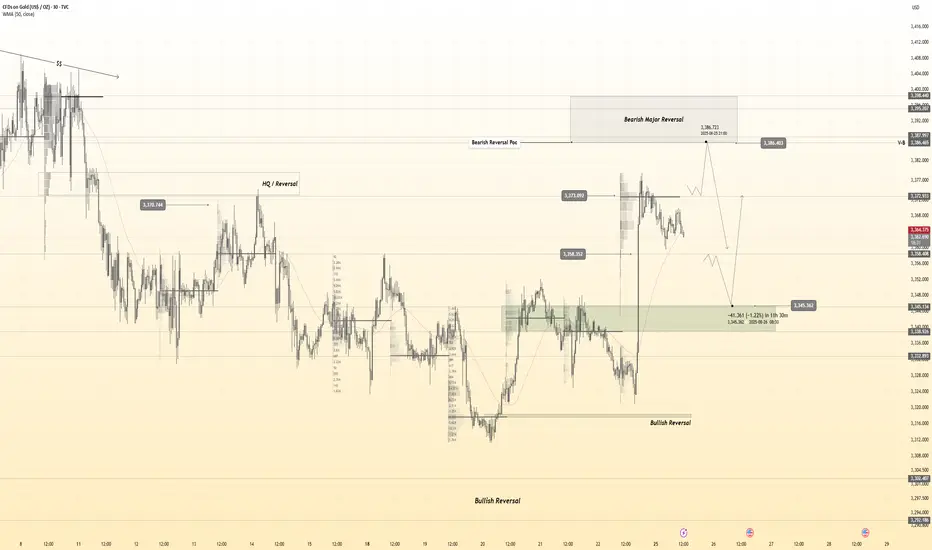
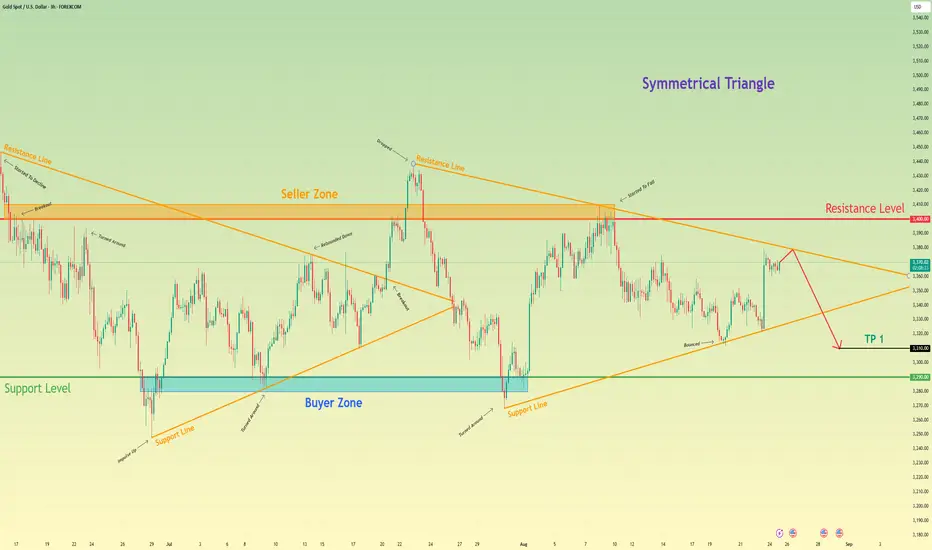
Gold will drop from resistance line of triangle to 3310 pointsHello traders, I want share with you my opinion about Gold. The market for Gold is currently defined by a large symmetrical triangle, a pattern of equilibrium that has formed after a strong rebound from the 3290 buyer zone halted the previous downward trend. This new market structure indicates a period of contracting volatility, with the price action for XAU being methodically squeezed between a descending resistance line and an ascending support line. These boundaries are anchored by the major seller zone around the 3400 resistance level and the aforementioned 3290 buyer zone. At present, the asset is at a critical inflection point, having rallied to test the descending resistance line of this triangle. The primary working hypothesis is a short scenario, based on the expectation that the 3400 seller zone will hold and that sellers will re-emerge to defend this territory. A confirmed rejection from this upper boundary would validate the integrity of the symmetrical triangle and likely initiate another major downward rotation within the pattern. This fall would target the ascending support line and the underlying horizontal support. Therefore, the TP for this rotational play is logically placed at 3310 points. Please share this idea with your friends and click Boost 🚀
XAUUSD Strong 1D MA100 rebound. Buy.Gold (XAUUSD) has been trading within an Ascending Triangle since its April 22 All Time High (ATH). Shortly after it solidified a Higher Lows trend-line as its Support with a 1D Body Candle Resistance Zone, limiting any upside break-out.
Last Wednesday it hit and rebounded on its 1D MA100 (green trend-line) for the 2nd time in 1 month, showing strong resilience and the presence of a short-term Demand Zone. The last Lower High contact was made a little above the 0.9 Fibonacci retracement level. This gives us a 3420 short-term Target, which is marginally below the Resistance Zone.
-------------------------------------------------------------------------------
** Please LIKE 👍, FOLLOW ✅, SHARE 🙌 and COMMENT ✍ if you enjoy this idea! Also share your ideas and charts in the comments section below! This is best way to keep it relevant, support us, keep the content here free and allow the idea to reach as many people as possible. **
-------------------------------------------------------------------------------
Disclosure: I am part of Trade Nation's Influencer program and receive a monthly fee for using their TradingView charts in my analysis.
💸💸💸💸💸💸
👇 👇 👇 👇 👇 👇

Silver bullish continuation supported at 3830The Silver remains in a bullish trend, with recent price action showing signs of a continuation breakout within the broader uptrend.
Support Zone: 3830 – a key level from previous consolidation. Price is currently testing or approaching this level.
A bullish rebound from 3830 would confirm ongoing upside momentum, with potential targets at:
3965 – initial resistance
4000 – psychological and structural level
4040 – extended resistance on the longer-term chart
Bearish Scenario:
A confirmed break and daily close below 3830 would weaken the bullish outlook and suggest deeper downside risk toward:
3800 – minor support
3755 – stronger support and potential demand zone
Outlook:
Bullish bias remains intact while the silver holds above 3830. A sustained break below this level could shift momentum to the downside in the short term.
This communication is for informational purposes only and should not be viewed as any form of recommendation as to a particular course of action or as investment advice. It is not intended as an offer or solicitation for the purchase or sale of any financial instrument or as an official confirmation of any transaction. Opinions, estimates and assumptions expressed herein are made as of the date of this communication and are subject to change without notice. This communication has been prepared based upon information, including market prices, data and other information, believed to be reliable; however, Trade Nation does not warrant its completeness or accuracy. All market prices and market data contained in or attached to this communication are indicative and subject to change without notice.
