GOLD - SHORT TO $2,800 (UPDATE)NFP today pushed Gold prices down. As I've shown you all plenty of times throughout the years now, fundamentals ALWAYS follows our technical bias.
Start learning to read the charts & stopping watching the news. Everything will fall into the right place for you.
Metals

Silver Extends Gains to $36.70Silver hovered near $36.70 on Thursday after rising 1.4% in the previous session, supported by easing trade tensions and stronger expectations of Fed rate cuts.
Markets are now watching key US economic releases to see whether silver can sustain its upward momentum.
Resistance is at 37.50, while support holds at 35.40.

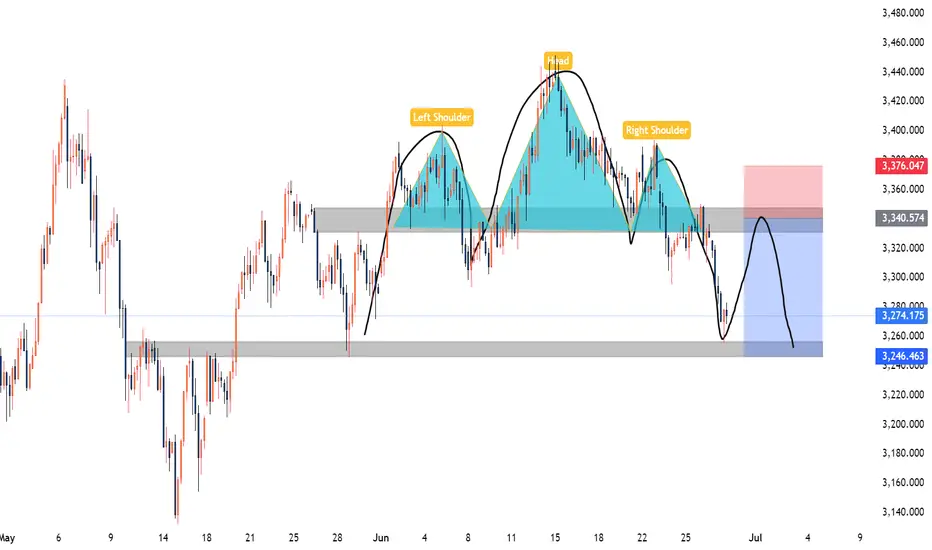
XAUUSD Weekly Analysis 30 June 4 July 2025Gold has formed a Head and Shoulders (H&S) pattern on the H4 timeframe. While the pattern is not perfectly symmetrical, it is still valid and clearly recognizable. The price has broken below the neckline, confirming a potential shift in market structure to the downside.
Analysis Insight:
The 3340–3350 area, previously a support zone, is now acting as resistance following the neckline break. A pullback to this zone may present a high-probability short opportunity for swing traders, especially if price shows rejection or bearish structure in that zone.
Trade Type: Swing
Trade Setup – Sell on Retracement:
Bias: Bearish on confirmation of retracement rejection
Entry Zone: 3340 – 3350
Stop Loss: 3376 (above right shoulder/high)
Take Profit: 3320/3300/3285/3260
Risk-Reward Ratio: Approximately 1:2
Kindly follow, share, like, support and comment.
GOLD Will Move Higher! Long!
Here is our detailed technical review for GOLD.
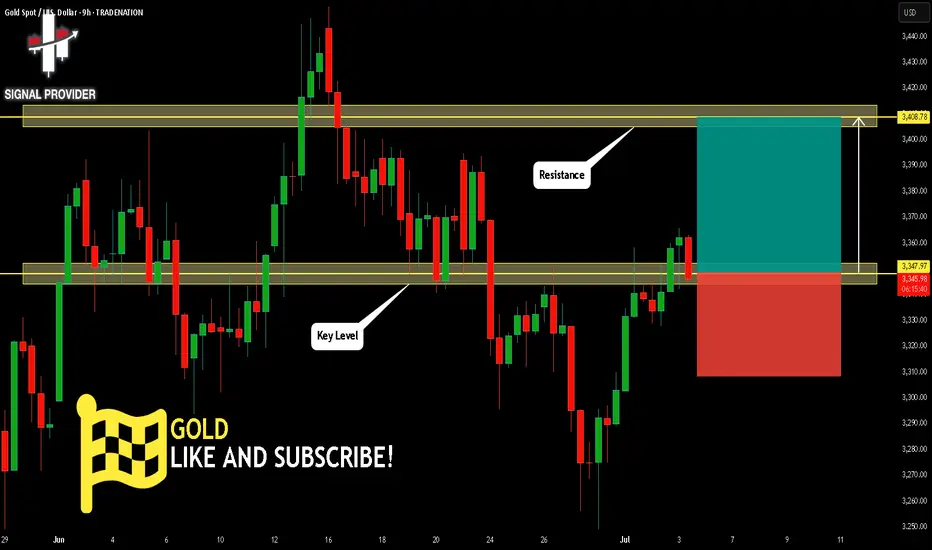
Time Frame: 9h
Current Trend: Bullish
Sentiment: Oversold (based on 7-period RSI)
Forecast: Bullish
The market is approaching a significant support area 3,347.97.
The underlined horizontal cluster clearly indicates a highly probable bullish movement with target 3,408.78 level.
P.S
The term oversold refers to a condition where an asset has traded lower in price and has the potential for a price bounce.
Overbought refers to market scenarios where the instrument is traded considerably higher than its fair value. Overvaluation is caused by market sentiments when there is positive news.
Disclosure: I am part of Trade Nation's Influencer program and receive a monthly fee for using their TradingView charts in my analysis.
Like and subscribe and comment my ideas if you enjoy them!
TRADING KNOWLEDGE – MOVING AVERAGE (MA)The Moving Average (MA) is a popular technical indicator that helps smooth out price data to better identify market trends. MA doesn't predict the future but helps traders clearly see the current direction of the market.
🔍 2 Main Types of MA:
🔔 SMA (Simple Moving Average): The average of closing prices over a set period (e.g., SMA 20 = average of the last 20 candles).
🔔 EMA (Exponential Moving Average): Similar to SMA but gives more weight to recent prices, making it more responsive to market changes.
📈 What is MA used for?
📍Trend Identification:
💡Upward sloping MA → Uptrend
💡Downward sloping MA → Downtrend
📍Trading Signals:
💡Price crossing above MA → Buy signal
💡Price crossing below MA → Sell signal
📍Combining Two MAs (Short & Long Term):
💡Short MA crosses above long MA → Buy signal (Golden Cross)
💡Short MA crosses below long MA → Sell signal (Death Cross)

XAUUSD: Market analysis and strategy on July 3Gold technical analysis
Daily chart resistance level 3400, support level 3300
4-hour chart resistance level 3382, support level 3327
1-hour chart resistance level 3364, support level 3341
After bottoming out, the lowest point of yesterday's correction, 3327, has become an important support. Today's gold is still a strategy of buying at a low level. This idea can be maintained before the release of NFP employment data. Tomorrow, the US Independence Day will be closed for one day. The NFP data will be released in advance today, and the trading market will be closed in advance.
Judging from the current market trend, today it broke through the previous high of 3357. Today's Asian session slightly rose to 3365 and then quickly fell back to 3341. The low point of the Asian session retracement of 3341 is a small support. The second is the low point of 3333 in the US session yesterday. The support point of 3333/41 can be bought when the European session falls back. The possibility of a unilateral rise in the high point of today before the NFP data is small. I expect it to fluctuate and wait patiently for a pullback to buy. Today's NY market risk is relatively high. Please try to avoid trading during news time!
Buy: 3341near
Buy: 3333near

NFP unexpectedly broke out, where will gold go?📰 News information:
1. Initial jobless claims and NFP data
2. The final decision of the Federal Reserve
📈 Technical Analysis:
The unexpectedly negative NFP data caused a sudden plunge in gold prices, which forced me to terminate the transaction urgently. Currently, gold has not fallen below the 3,300 mark. Therefore, I will still pay attention to the closing of the hourly line. If gold closes below 3,320, the downward trend will continue. On the contrary, if it closes above 3,320, gold will consolidate at a high level in the short term. Two days ago, I gave the support level of 3315-3305 below. Please be cautious in trading at the moment.
🎯 Trading Points:
For now, let’s focus on the hourly closing situation
In addition to investment, life also includes poetry, distant places, and Allen. Facing the market is actually facing yourself, correcting your shortcomings, confronting your mistakes, and strictly disciplining yourself. I hope my analysis can help you🌐.
TVC:GOLD OANDA:XAUUSD FX:XAUUSD FOREXCOM:XAUUSD PEPPERSTONE:XAUUSD FXOPEN:XAUUSD

Gold at Key Level Before NFP – Big Move Loading ?📉 Fundamental Analysis
Gold remains in a strong bullish structure, supported by multiple macroeconomic and political drivers:
ADP Employment Report Missed Expectations: With a shocking -33K reading, market sentiment shifted firmly against the US Dollar, pushing gold higher.
Fed’s Easing Outlook: Markets are now pricing in a 90% probability of a rate cut in Q3, weakening real yields and supporting demand for gold.
Trump’s “Super Bill” Momentum: Political cohesion among Republicans has re-ignited fiscal stimulus expectations, fuelling concerns over long-term US debt sustainability—another tailwind for gold as a safe haven.
🧠 Smart Money Technical Framework (H1)
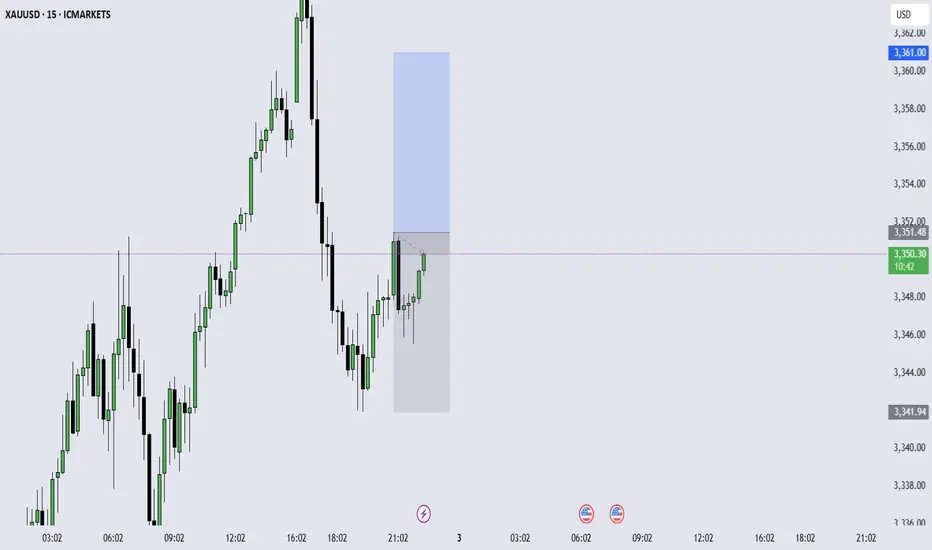
Price has moved into a Premium FVG Zone, showing signs of potential exhaustion after forming a clear CHoCH and bullish BOS. The current zone (3,375 – 3,376) aligns with a mid-risk sell region, where price may experience short-term rejection before revisiting demand zones.
Market structure suggests liquidity sweep potential towards the downside before any continuation of the larger bullish trend.
📊 Trading Strategy – Smart Money Zones & Key Levels
🔵 BUY SCALP: 3,334 – 3,333
🔴 SL: 3,329
✅ TP: 3,340 → 3,344 → 3,350 → 3,360
🔵 BUY ZONE LOW RISK: 3,317 – 3,316
🔴 SL: 3,311
✅ TP: 3,320 → 3,325 → 3,330 → 3,336 → 3,345 → 3,350 → 3,360
🔴 SELL SCALP ZONE: 3,375 – 3,376
🔴 SL: 3,380
✔️ TP: 3,370 → 3,366 → 3,360 → 3,355 → 3,350
🔴 SELL ZONE HIGH PROBABILITY: 3,388 – 3,390
🔴 SL: 3,394
✔️ TP: 3,384 → 3,380 → 3,376 → 3,370 → 3,366 → 3,360
📌 Notes:
Be cautious ahead of NFP data and the upcoming US bank holiday—expect liquidity traps and sudden volatility.
This setup is ideal for intraweek scalping and liquidity-based reversals.
All trades follow Smart Money Concepts logic: premium vs. discount zones, CHoCH + BOS confirmations, and institutional order flow anticipation.

Buying the Dip or Catching a Knife? My Gold Setup Explained.Entered a long position on XAU/USD from the 1H demand zone following sharp intraday selling into a key support level. With gold hovering near $3,300 and a significant testimony from Fed Chair Powell on deck, the setup aligns with both technical rebound potential and fundamental uncertainty that could fuel upside.
The goal here is to play the liquidity vacuum left after aggressive positioning was cleared, with tight invalidation and asymmetric reward.
Technicals:
• Entry aligned with prior price inefficiency and confluence of multiple demand zones
• 1H structure shows clear deviation below the range with immediate buy-side response
• EMA channel flattening, indicating potential compression ahead of expansion
• First target: $3,352
• Risk-managed with defined stop-loss below $3,260
Execution Note: This is not a “hold forever” trade. It’s an opportunistic reaction to unwind + sentiment imbalance.
Fundamentals
• Gold saw a 25% surge in 2024 due to safe-haven demand and dovish policy, but enters 2025 under pressure from:
▫️ A strong USD
▫️ Higher cost of carry
▫️ Speculators taking profit
• Fed policy remains the core variable:
▫️ A hawkish tone from Powell could weigh on price
▫️ Rate cuts would likely revive bullish momentum
• Central bank demand remains supportive
• Geopolitical tensions (Russia-Ukraine, Israel-Iran) could trigger safe-haven bids again.
Bearish headwinds:
• Waning bullish momentum per RSI divergence
• Reduced rate cut expectations post-election
• Powell’s testimony could revive volatility either way.
This is a short-term tactical long, not a macro bet. With sentiment temporarily overextended and key support defended intraday, this is a high R/R window to exploit Powell-related volatility.
Let’s see how price reacts into $3,350+. Any sustained strength there would open room toward $3,400, while failure would confirm a retest of $3,260s.
Note: Please remember to adjust this trade idea according to your individual trading conditions, including position size, broker-specific price variations, and any relevant external factors. Every trader’s situation is unique, so it’s crucial to tailor your approach to your own risk tolerance and market environment.

Gold trend analysis and layout before NFP data📰 News information:
1. Initial jobless claims and NFP data
2. The final decision of the Federal Reserve
📈 Technical Analysis:
Due to the Independence Day holiday this week, the NFP data was released ahead of schedule today, while the policy differences within the Federal Reserve have brought uncertainty to the market. Judging from the market trend, the 4H level shows that the gold price tested the upper track yesterday and then turned to high-level fluctuations after coming under pressure. In the short term, the structure still has bullish momentum after completing the accumulation of power. Although there was a correction in the US market yesterday, it stopped falling and rebounded near 3335, further confirming the strength. At present, the upper resistance in the European session is at 3365-3375, and the short-term support is at 3345-3335 below. Intraday trading still requires good SL to withstand market fluctuations. In terms of trading, it is recommended to mainly go long on callbacks
🎯 Trading Points:
SELL 3365-3375
TP 3350-3340-3335
BUY 3335-3330-3325
TP 3350-3360-3375
In addition to investment, life also includes poetry, distant places, and Allen. Facing the market is actually facing yourself, correcting your shortcomings, confronting your mistakes, and strictly disciplining yourself. I hope my analysis can help you🌐.
FXOPEN:XAUUSD PEPPERSTONE:XAUUSD FOREXCOM:XAUUSD FX:XAUUSD OANDA:XAUUSD TVC:GOLD

Gold is Pushing Bullish but is it really ready???This looks like a early move to move full on bullish. I feel like it might need to sweep the low from mid week before they really ready to go bullish. waiting for things to show a bit more clear during the Kill Zone.

GOLD Bullish Breakout! Buy!
Hello,Traders!
GOLD is going up now
And the price broke the
Key horizontal level
Around 3,346$ and
The breakout is confimred
So we are bullish biased
And we will be expecting
A further bullish move up
Buy!
Comment and subscribe to help us grow!
Check out other forecasts below too!
Disclosure: I am part of Trade Nation's Influencer program and receive a monthly fee for using their TradingView charts in my analysis.

Ramelius Resources (ASX: RMS) –A Tactical Re-Entry Zone?🟡 Gold-Linked Opportunity: Ramelius Resources (ASX: RMS) – A Tactical Re-Entry Zone?
Context: Ramelius Resources, a mid-tier Aussie gold producer, is showing signs of technical exhaustion after a strong rally from its 2024 lows. With gold prices consolidating and RMS pulling back to a key support zone, this could be a tactical opportunity for shareholders and swing traders alike.
📊 Technical Snapshot:
Current Price: $2.47
Trendline Support: The long-term ascending trendline remains intact, offering a potential re-entry zone for bulls.
Risk-Reward Setup: Defined green/red zones highlight a favorable R:R ratio for those targeting a rebound toward $2.80–$3.00.
🪙 Gold Correlation Insight:
The inset chart shows gold (XAU/USD) stabilizing after a volatile June. If gold resumes its uptrend, RMS could follow suit, given its strong correlation with bullion prices.
🧠 Psychological Angle:
After a 40%+ rally from the $1.78 low, some profit-taking is natural. But this pullback may shake out weak hands before a continuation move.
Watch for sentiment shifts around gold and broader risk appetite—these could be catalysts for RMS’s next leg.
#RMS #Gold #ASX #MJTrading #Forex #Trading #Investment

MR. COPPER GOES FUN. WITH DONALD TRUMP — IT IS A BULL RUNCopper prices in 2025 are up about 27 percent year-to-date, driven by a complex interplay of technical and fundamental factors, with geopolitical events such as the Trump administration's tariff policies and the escalation of geopolitical tensions in the Middle East having a significant impact.
Fundamental Outlook:
The main driver of copper prices in 2025 is the ongoing global surge in demand driven by the transition to clean energy. Copper is essential for electric vehicles (EVs), renewable energy infrastructure, and grid upgrades, all of which require extensive use of copper due to its superior electrical conductivity.
For example, EVs use about 2-4 times more copper than traditional vehicles, and renewable installations such as wind turbines contain several tons of copper each. This structural growth in demand underpins the optimistic outlook for copper in the medium to long term.
On the supply side, however, copper production is growing. The International Copper Study Group (ICSG) forecasts a global copper surplus of 289,000 tonnes in 2025, more than double the 2024 surplus. This surplus is driven by rising production, particularly from new or expanded operations in the Democratic Republic of Congo, Mongolia, Russia and elsewhere.
Capacity increases in these regions, coupled with smelter growth, could contribute to a supply glut despite strong demand.
Conversely, geopolitical tensions in the Middle East could disrupt bauxite and alumina supply chains, a region that is a strategically important supplier of raw materials.
Impact of Trump Tariffs:
The Trump administration’s threats and actions to impose tariffs on U.S. copper imports have added volatility and complexity to the market. The tariff announcement triggered a sharp sell-off in early April 2025 as concerns about the impact on US manufactured demand and global trade flows grew. London Metal Exchange (LME) copper prices fell to one-month lows following China’s retaliatory tariffs, before partially recovering after some tariff exemptions and reductions were announced.
The tariffs also distorted physical supply chains. Traders rushed to deliver copper to the US ahead of the tariffs, reducing copper availability in other regions such as China. This arbitrage resulted in a significant widening of the price differential between US CME copper contracts and LME copper prices, with US prices trading at a premium of over 10% to London. This premium reflects the tariff risk embedded in the US copper price and expectations of temporary domestic market tensions.
Technical Outlook:
Technically, copper prices have shown resilience despite the tariff shocks. Copper prices sold off after peaking in late March 2025 before the tariffs were announced, but have since begun to recover.
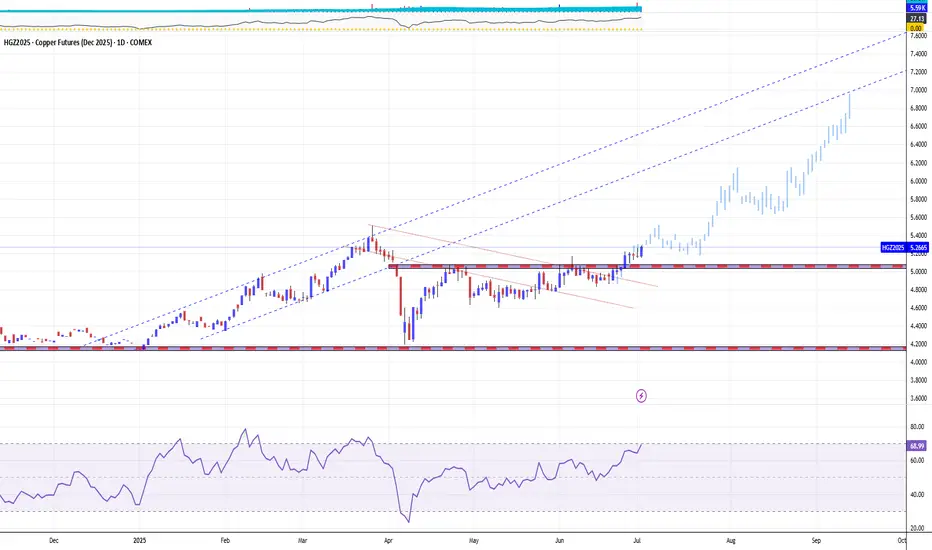
Long-term trendlines and moving averages remain supportive, with the 100-week and 200-week moving averages trending higher and forming a bullish crossover earlier in the year.
Long-term copper prices are once again attacking the 18-year resistance around $4.50/lb ($10/kg) that capped the upside in 2008 and again in the 2010s and first half of the 2020s, with a 1.5x rally in the next 1 to 3 years.
The technical main chart of the COMEX December 2025 copper futures contract COMEX:HGZ2025
points to the possibility of an upside move, all the way to the $7 mark (around $15/kg) as early as H2 2025.
Conclusion
Going forward, copper prices are expected to remain volatile but supported by long-term structural demand growth, with the impact of tariffs likely to cause episodic disruptions rather than a sustained suppression of increasingly hot prices.
--
Best wishes,
@PandorraResearch Team😎
Gold Consolidating Ahead of Next Move Gold Consolidating Ahead of Next Move – Is 3390 the Bull Target or a False Breakout Trap?
🧭 Fundamental Outlook
Gold has entered a tight consolidation phase following a wave of high-impact macroeconomic events:
The US House of Representatives has passed Trump's “Super Bill”, raising expectations of increased fiscal spending and long-term inflationary pressures. In theory, this is supportive of gold prices.
However, strong NFP and Unemployment Rate figures released recently have reinforced dollar strength in the short term, suggesting the Fed may delay rate cuts → a temporary headwind for gold.
With Independence Day in the US, liquidity across global markets is expected to drop, increasing the risk of false moves or stop-hunt volatility.
🟡 The lack of immediate upside doesn’t mean bullish momentum has disappeared. Price may simply be building energy before its next leg.
📉 Technical Overview – XAU/USD
Gold has broken out of a minor descending trendline and is now testing a key supply zone around 3344–3345, which could determine the intraday trajectory.
🔍 Key Levels
Resistance Zones: 3345 – 3362 – 3374 – 3388 – 3390
Support Zones: 3330 – 3312 – 3304 – 3302 – 3298
🟢 Bullish Scenarios (Buy Setups)
📍 Intraday Buy Zone:
3313 – 3311
Stop Loss: 3307
Take Profit: 3316 – 3320 – 3325 – 3330 – 3335 – 3340 – 3345 – 3350
📍 Deep Pullback Buy Zone:
3304 – 3302
Stop Loss: 3298
Take Profit: 3308 – 3312 – 3316 – 3320 – 3330 – 3340
These zones are ideal for trend-continuation entries, especially if supported by bullish candles or price action on lower timeframes.
🔴 Bearish Scenarios (Short-Term Only)
📍 Intraday Sell Zone:
3362 – 3364
Stop Loss: 3368
Take Profit: 3358 – 3354 – 3350 – 3346 – 3340 – 3335 – 3330
📍 High-Risk Sell Zone:
3388 – 3390
Stop Loss: 3394
Take Profit: 3384 – 3380 – 3376 – 3370 – 3365 – 3360
Bearish positions should be reserved for signs of exhaustion or rejection patterns at resistance levels.
🧠 Trading Bias for Today
With limited liquidity due to the US holiday, price may remain trapped in a sideways range between 3320 and 3340. Traders should stay nimble and avoid overexposure.
✅ Primary bias: Buy dips near major support
⚠️ Alternative view: Only short if price confirms reversal at resistance
💬 What’s Your Take on Gold Today?
Will gold break through the 3390 barrier this week?
Or are we looking at one more dip before a true bullish continuation?
👇 Share your thoughts and trading ideas in the comments!

XAUUSD: July 4, market analysis and strategyGold technical analysis
Daily chart resistance 3400, support 3300
4-hour chart resistance 3365, support 3306
1-hour chart resistance 3352, support 3322
Last night, NFP employment data caused gold prices to fall sharply by $40, and then rebounded to 3338. The energy of the shorts caused by the NFP data has been basically digested. Next, the bulls will start to exert their strength. Gold can still be bullish if it falls back today.
Yesterday, the gold price quickly fell to 3311 and then rebounded. The low point of the second retracement was 3322, which is the short-term support level. You can wait for a retracement near 3322 to buy bullish. The 1-hour resistance is 3352. Pay attention to the reaction here and look for selling opportunities.
Buy: 3322near
Sell: 3352near

GOLD: Bears Are Winning! Short!
My dear friends,
Today we will analyse GOLD together☺️
The in-trend continuation seems likely as the current long-term trend appears to be strong, and price is holding below a key level of 3,336.61 So a bearish continuation seems plausible, targeting the next low. We should enter on confirmation, and place a stop-loss beyond the recent swing level.
❤️Sending you lots of Love and Hugs❤️

Bank Holiday: Which Zone Will Hold as Liquidity Thins?XAUUSD – Awaiting Breakout as Market Stalls Post-Macro Storm
Gold remains in consolidation mode following a barrage of high-impact macro events — from Trump's Super Bill approval to unexpectedly strong NFP data. Despite these catalysts, price action has stalled as traders weigh conflicting signals. With U.S. markets closed for Independence Day, liquidity remains thin — and that opens the door for liquidity grabs and fake breakouts.
🔍 Macro Analysis – Mixed Signals for Gold
Trump’s Super Bill: Expected to fuel fiscal deficit → long-term bearish for USD → potentially bullish for Gold.
NFP & UR Data: Surprisingly strong → Fed may delay rate cuts → bearish short-term for Gold.
U.S. Holiday: Low liquidity means markets may range, fake moves are likely. Don’t chase impulsively.
🧠 Key insight: A lack of immediate bullish follow-through doesn’t invalidate the long-term upside. Market could be quietly accumulating...
📈 SMC Technical Outlook – Key Liquidity Zones in Play
Price structure on H1 shows a clean CHoCH (Change of Character) and current price action is reacting near a reclaimed demand zone.
There are two possible paths:
Rejection near PDH / FVG area → SELL opportunity.
Deep retracement towards SSL liquidity zone → Strong BUY setup.
📊 Key Levels to Watch
🔼 Major Resistance Zones:
3366 – 3368 (Scalp)
3388 – 3390 (Swing Reversal)
3362 – 3374 – 3394 (Upper Liquidity Sweep Area)
🔽 Major Support Zones:
3312 – 3310 (Scalp BUY)
3302 – 3300 (Primary BUY Zone)
3298 – 3295 (Invalidation Below)
✅ Trade Plan for Today
🟢 Buy Setups (Priority with Trend)
Scalp BUY Zone:
📍 3312 – 3310
🛡 SL: 3307
🎯 TP: 3316 – 3325 – 3335 – 3345 – 3360
Swing BUY Zone:
📍 3302 – 3300
🛡 SL: 3298
🎯 TP: 3310 – 3320 – 3340 – 3360 – 3388
These align with SMC liquidity zones and fair value gap re-tests — a strong long bias remains valid above 3298.
🔴 Sell Setups (Only If Confirmed)
Scalp SELL Zone:
📍 3366 – 3368
🛡 SL: 3371
🎯 TP: 3358 – 3348 – 3338
High SELL Zone:
📍 3388 – 3390
🛡 SL: 3394
🎯 TP: 3382 – 3375 – 3360
Use confirmation on lower timeframes. Don’t sell blindly into trend.
🔮 Bias for the Session
🟨 Primary Bias: BUY dips into 3300–3310 zone
🟥 Alternate: Short-term SELLs only from 3366–3390 zones with price rejection
💬 What Do You Think?
Is this just a trap before the real breakout to 3400+?
Or are we heading into a liquidity sweep before deeper correction?

Will the NFP impact cause the bear market to dominate?📰 News information:
1. Initial jobless claims and NFP data
2. The final decision of the Federal Reserve
📈 Technical Analysis:
In the previous post, I have stated that if the hourly line closes above 3320, gold will fall into high consolidation in the short term. Currently, gold fluctuates narrowly in the short term. I think now we just need to be patient and wait for key points to enter the market. The daily and weekly lines clearly show that the high point of the oscillation range is constantly moving up, and the center of gravity continues to rise. The current market is quietly accumulating momentum, and a new round of weekly and monthly lines are about to rise. Therefore, first of all, I will pay attention to the defensive point below 3320, and then refresh the point below is the previously mentioned 3315-3305. If the point below is touched to get effective support, you can consider going long. Bros who trade independently must strictly set TP and SL to avoid the impact of market fluctuations.
🎯 Trading Points:
BUY 3320-3315-3310
TP 3330-3340-3360
In addition to investment, life also includes poetry, distant places, and Allen. Facing the market is actually facing yourself, correcting your shortcomings, confronting your mistakes, and strictly disciplining yourself. I hope my analysis can help you🌐.
FXOPEN:XAUUSD PEPPERSTONE:XAUUSD FOREXCOM:XAUUSD FX:XAUUSD OANDA:XAUUSD TVC:GOLD

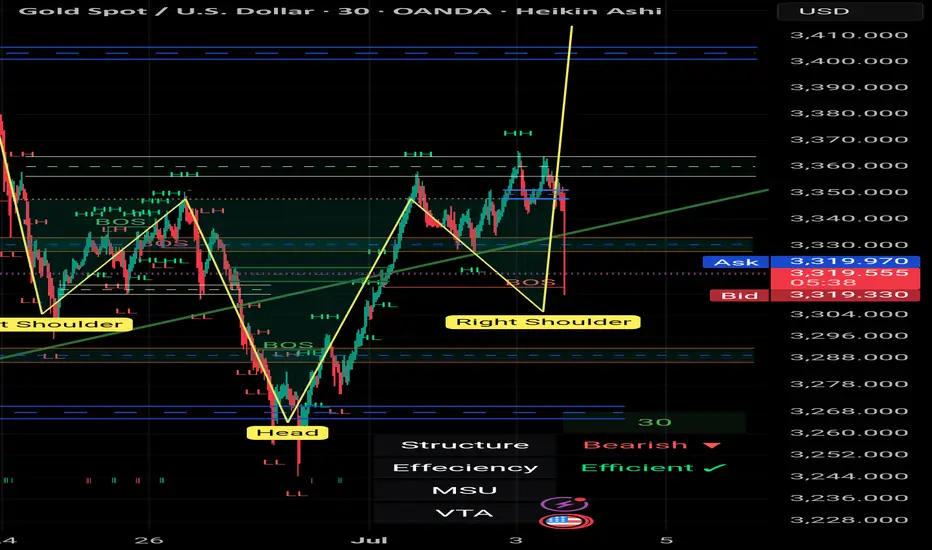
I say nothing , you say me any thing about 📌 **Gold Spot (XAU/USD) – 30m | 2h | Smart Money Perspective**
🔍 After weeks of precision tracking and structural validation, price has now tapped the **Right Shoulder** of a clean *Reverse Head & Shoulders* formation — with absolute respect to structure, liquidity, and OB zones.
💥 This wasn't just a random bounce.
It was:
- A confirmation of **previous BOS & CHoCH**
- A retest of **TLQ/ILQ liquidity zones**
- A reaction from the *Extreme OB* within a compression channel
- And a final push fueled by **inefficiency fills** on the left
🎯 The bullish intent remains strong, and if momentum follows through, we're looking at:
- **TP1** → 3345–3355 (minor OB & void fill)
- **TP2** → 3375–3390 (liquidity sweep target)
- **TP3** → 3420+ (range expansion goal)
🧠 This analysis has not just been correct.
It’s been **respected by the market.**
I take pride in every reaction the chart gives us when we respect the language of price, structure, and timing.
There’s no shortcut here — just observation, logic, and discipline.
We don’t chase the trend. We wait for it to **bow in confirmation**.
Like it just did.
— *Mohsen Mozafari Nejad* 🧭
#SmartMoney #GoldAnalysis #XAUUSD #TradingView #MarketStructure #BOS #OB #MSU #ReverseHeadAndShoulders #Forex #TechnicalAnalysis
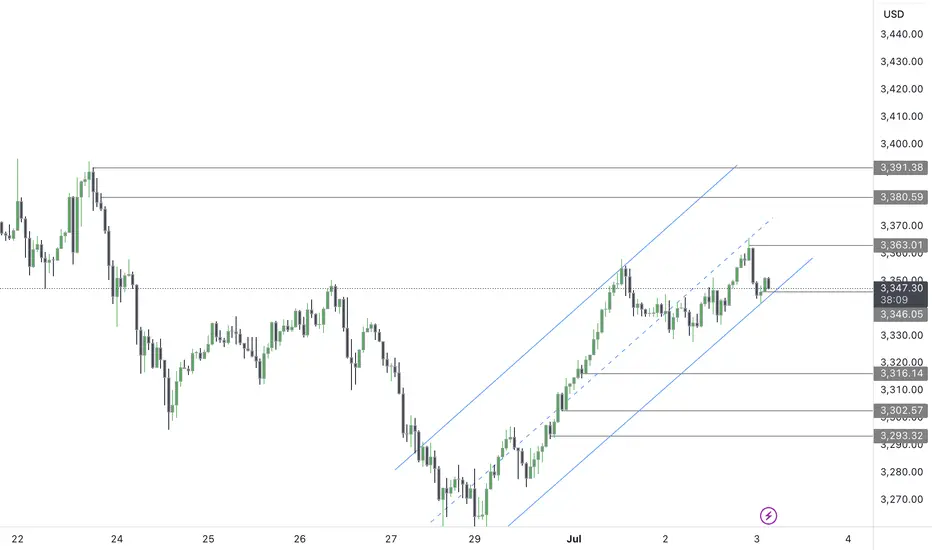
GOLD BULLS We saw gold impose a strong bullish strength since the open of this new week, and even at the beginning of the new month (JULY).
Based on this analysis, this bullish momentum has structured in a bullish trend channel which has been shown, we still have more top liquidity to mitigate as we have made a bearish retracement for a continued bullish rally to 3360's, 3380's and 3400's.
Further updates would be given as the market gains momentum
GOLD: Target Is Up! Long!
My dear friends,
Today we will analyse GOLD together☺️
The price is near a wide key level
and the pair is approaching a significant decision level of 3,347.31 Therefore, a strong bullish reaction here could determine the next move up.We will watch for a confirmation candle, and then target the next key level of 3,353,67.Recommend Stop-loss is beyond the current level.
❤️Sending you lots of Love and Hugs❤️
