SILVER: Strong Growth Ahead! Long!
My dear friends,
Today we will analyse SILVERtogether☺️
The in-trend continuation seems likely as the current long-term trend appears to be strong, and price is holding above a key level of 38.010 So a bullish continuation seems plausible, targeting the next high. We should enter on confirmation, and place a stop-loss beyond the recent swing level.
❤️Sending you lots of Love and Hugs❤️
Metals

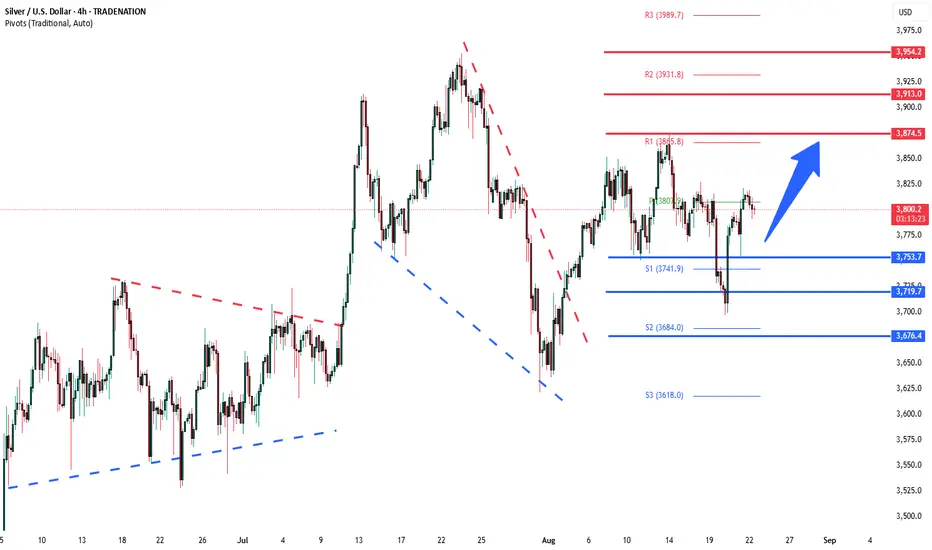
Solver range trading supported at 3753The Silver remains in a bullish trend, with recent price action showing signs of a continuation breakout within the broader uptrend.
Support Zone: 3753 – a key level from previous consolidation. Price is currently testing or approaching this level.
A bullish rebound from 3753 would confirm ongoing upside momentum, with potential targets at:
3875 – initial resistance
3913 – psychological and structural level
3954 – extended resistance on the longer-term chart
Bearish Scenario:
A confirmed break and daily close below 3753 would weaken the bullish outlook and suggest deeper downside risk toward:
3720 – minor support
3676 – stronger support and potential demand zone
Outlook:
Bullish bias remains intact while the silver holds above 3753. A sustained break below this level could shift momentum to the downside in the short term.
This communication is for informational purposes only and should not be viewed as any form of recommendation as to a particular course of action or as investment advice. It is not intended as an offer or solicitation for the purchase or sale of any financial instrument or as an official confirmation of any transaction. Opinions, estimates and assumptions expressed herein are made as of the date of this communication and are subject to change without notice. This communication has been prepared based upon information, including market prices, data and other information, believed to be reliable; however, Trade Nation does not warrant its completeness or accuracy. All market prices and market data contained in or attached to this communication are indicative and subject to change without notice.
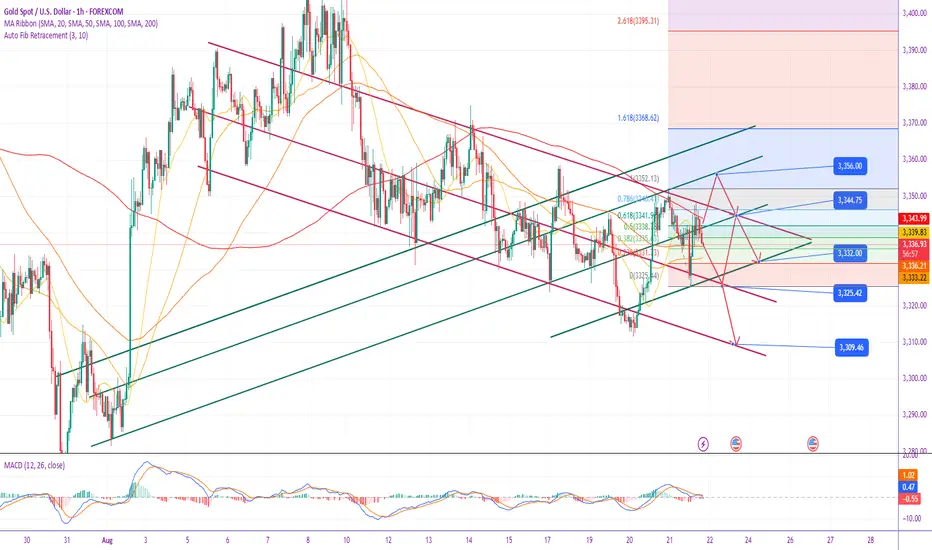
Gold corrective pullback supported at 3310The Gold remains in a bullish trend, with recent price action showing signs of a continuation breakout within the broader uptrend.
Support Zone: 3310 – a key level from previous consolidation. Price is currently testing or approaching this level.
A bullish rebound from 3310 would confirm ongoing upside momentum, with potential targets at:
3383 – initial resistance
3411 – psychological and structural level
3432 – extended resistance on the longer-term chart
Bearish Scenario:
A confirmed break and daily close below 3310 would weaken the bullish outlook and suggest deeper downside risk toward:
3293 – minor support
3280 – stronger support and potential demand zone
Outlook:
Bullish bias remains intact while the Gold holds above 3310. A sustained break below this level could shift momentum to the downside in the short term.
This communication is for informational purposes only and should not be viewed as any form of recommendation as to a particular course of action or as investment advice. It is not intended as an offer or solicitation for the purchase or sale of any financial instrument or as an official confirmation of any transaction. Opinions, estimates and assumptions expressed herein are made as of the date of this communication and are subject to change without notice. This communication has been prepared based upon information, including market prices, data and other information, believed to be reliable; however, Trade Nation does not warrant its completeness or accuracy. All market prices and market data contained in or attached to this communication are indicative and subject to change without notice.

GOLD: The Market Is Looking Down! Short!
My dear friends,
Today we will analyse GOLD together☺️
The price is near a wide key level
and the pair is approaching a significant decision level of 3,330.13 Therefore, a strong bearish reaction here could determine the next move down.We will watch for a confirmation candle, and then target the next key level of 3,325.41.Recommend Stop-loss is beyond the current level.
❤️Sending you lots of Love and Hugs❤️

XAUUSD Short GoldGold good setup to execute short order,I see gold going even more down until 3302.
Subjected to market risks.Investors welcomed

August 22nd Latest Gold Trend Analysis and Strategy:
I. Current Market Status and Key Views
Overall: Market is fluctuating within a wide range at a high level. Despite a strong rebound, no effective trend reversal has occurred, and the market remains in a consolidation pattern of bullish and bearish fluctuations.
Key Watershed: The 3350-3356 area is a key resistance level for determining whether the market can continue its upward trend and break out of the range-bound fluctuations. Until this area is effectively broken through and stabilized, the market will remain volatile.
Trading Strategy: Avoid chasing gains and selling losses; adopt a volatile strategy of selling high and buying low.
II. Technical Analysis Highlights
1-Hour Chart: A V-shaped rebound has occurred after bottoming out. Two large bullish candlesticks have almost recovered the previous losses, indicating strong buying support below. However, the price is currently approaching the upper limit of the range again.
Daily level: Closed with a large positive line, but the overall market is still running within the oscillation box. Subsequent K-line confirmation is needed.
III. Key Support and Resistance Levels
Upper Resistance:
Short-term Resistance: 3350-3356
Strong Resistance/Target: 3365-3375
Lower Support:
Short-term Support/Bull-Short Turnaround Point: 3332 (Daily support, key to maintaining the upward trend)
Strong Support/Buy Zone: 3320-3310 (Low point, ideal entry point for long orders)
IV. Today's Trading Strategy
Core Concept: Focus on long positions on pullbacks.
Long Strategy (Pullback Long):
Ideal Entry Zone: 3320-3310.
Stop-loss: Below 3305.
Target: 3340-3350; if it breaks through 3356, it could reach 3365-3375.
Short Strategy (Rebound High):
Ideal Entry Area: Upon a rebound to the 3365-3375 area, if stagflation signals (such as an upper shadow or engulfing candlestick) appear.
Stop-Loss: Upon a breakout above 3380.
Target: 3340-3330.
Aggressive Strategy:
If the price continues to consolidate above the 3332 support level during the Asian and European sessions, consider a short-term buy strategy with a small position, setting a stop-loss below 3325 and targeting around 3350.
V. Risk Warnings and Precautions
Beware of market whipsaws: The market has been volatile and volatile recently, so be wary of false breakouts and whipsaws. Never chase longs after a surge or shorts after a sharp drop.
Key break: If the price effectively falls below the 3310-3300 support, it may open up downside space and the long strategy needs to be suspended. Effective breakthrough: If the price breaks through strongly and stabilizes above 3356, the market is expected to rise further. The short-selling strategy needs to be suspended, and long orders can be followed up.
Summary: Gold is still in a volatile pattern. In terms of operation, we should remain patient, look for high-probability trading opportunities near key support and resistance levels, and strictly control risks.
DeGRAM | GOLD is moving in a downward channel📊 Technical Analysis
● Gold is trading within a descending channel, failing to break resistance at 3,345 and now leaning toward the 3,311 support.
● A confirmed breakdown below 3,311 would open the path to 3,285, with bearish momentum reinforced by repeated rejections of upper channel resistance.
💡 Fundamental Analysis
● Stronger US job market data and hawkish Fed commentary this week supported yields, weighing on gold as investors reduced safe-haven bids.
✨ Summary
Short below 3,345; breakdown targets 3,311 → 3,285. Invalidation above 3,345.
-------------------
Share your opinion in the comments and support the idea with a like. Thanks for your support!

Is Gold Losing Its Luster or Preparing to Shine Again?XAUUSD has been respecting a broad ascending channel for months, with clear touches on both resistance and support levels. Recently, however, price slipped into a smaller bearish channel inside the larger structure.
📉 The short-term bias remains bearish as long as price trades within the red channel.
📊 Key support lies near the $3,280 zone — a critical level where bulls might attempt to step in.
💡 A breakout from the bearish channel could open the way for another retest of the upper resistance zone, while failure to hold support may trigger deeper corrections.
📚 Always follow your trading plan regarding entry, risk management, and trade management.
Good luck!
All Strategies Are Good; If Managed Properly!
~Rich
Disclosure: I am part of Trade Nation's Influencer program and receive a monthly fee for using their TradingView charts in my analysis.

GOLD Sellers In Panic! BUY!
My dear subscribers,
This is my opinion on the GOLD next move:
The instrument tests an important psychological level 3329.3
Bias - Bullish
Technical Indicators: Supper Trend gives a precise Bullish signal, while Pivot Point HL predicts price changes and potential reversals in the market.
Target - 3335.26
My Stop Loss - 3326.3
About Used Indicators:
On the subsequent day, trading above the pivot point is thought to indicate ongoing bullish sentiment, while trading below the pivot point indicates bearish sentiment.
Disclosure: I am part of Trade Nation's Influencer program and receive a monthly fee for using their TradingView charts in my analysis.
———————————
WISH YOU ALL LUCK

XAUUSD: Market Analysis and Strategy for August 22nd.Gold Support and Resistance Update:
Daily Chart Resistance: 3360, Support: 3300
4-Hour Chart Resistance: 3358, Support: 3310
1-Hour Chart Resistance: 3348, Support: 3325.
Looking at the current market trend, gold hit 3352 yesterday before falling back under pressure. A second surge to 3348 in the US session failed to reach a new intraday high, and gold prices again faced resistance and fell. The decline continued in today's Asian session, currently near 3327, approaching yesterday's low of 3325. Yesterday, it was emphasized that selling on rallies around 3348 is recommended. Today, gold remains bearish, relying on resistance at yesterday's US high of 3348/52. Focus on support at 3325 and 3311 below. We expect minimal volatility before Powell's speech. Buy at the previous low of 3311. If gold prices stop falling in the 3320-26 area, buy early. Buy or sell based on the NY market after Powell's speech.
BUY: 3322near
BUY: 3311near
SELL: 3340near

Bullish bounce?The Gold (XAU/USD) is falling towards the pivot and could bounce to the 1st resistance, which acts as a pullback resistance.
Pivot: 3,307.62
1st Support: 3,267.80
1st Resistance: 3,350.96
Risk Warning:
Trading Forex and CFDs carries a high level of risk to your capital and you should only trade with money you can afford to lose. Trading Forex and CFDs may not be suitable for all investors, so please ensure that you fully understand the risks involved and seek independent advice if necessary.
Disclaimer:
The above opinions given constitute general market commentary, and do not constitute the opinion or advice of IC Markets or any form of personal or investment advice.
Any opinions, news, research, analyses, prices, other information, or links to third-party sites contained on this website are provided on an "as-is" basis, are intended only to be informative, is not an advice nor a recommendation, nor research, or a record of our trading prices, or an offer of, or solicitation for a transaction in any financial instrument and thus should not be treated as such. The information provided does not involve any specific investment objectives, financial situation and needs of any specific person who may receive it. Please be aware, that past performance is not a reliable indicator of future performance and/or results. Past Performance or Forward-looking scenarios based upon the reasonable beliefs of the third-party provider are not a guarantee of future performance. Actual results may differ materially from those anticipated in forward-looking or past performance statements. IC Markets makes no representation or warranty and assumes no liability as to the accuracy or completeness of the information provided, nor any loss arising from any investment based on a recommendation, forecast or any information supplied by any third-party.

22/08/25 Gold Swing LevelsLosses recovered
Set your alerts. Watch the 5 mins (1 min if price spiking)
22/08/25 levels are marked
Always, price action determines trade.
Trade parameters
Entry on 5 min chart
Sl: 20-40pips
TP: 2-4x SL

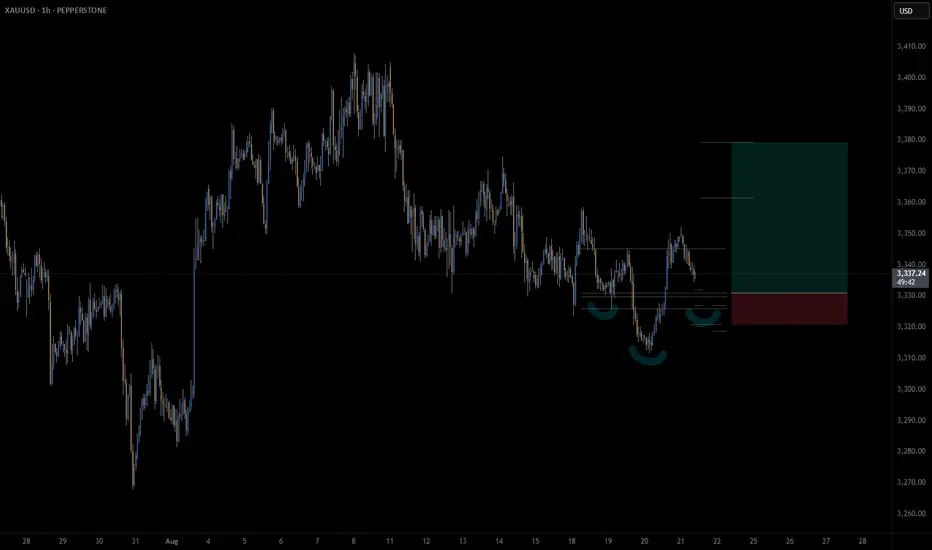
Gold - Inverse head and shoulders on hourly chartAn inverse head & shoulders is potentially forming on the hourly gold chart.
In this case, the IHS acts as a continuation pattern, as gold has been consolidating sideways for some time.
📊 Trade Plan:
Risk/Reward: 3.8
Entry: 3330.9
Stop Loss: 3320.8
Take Profit 1 (50%): 3361.5
Take Profit 2 (50%): 3379.3
💡 GTradingMethod Tip: Every moment in the market is unique. That’s why it’s crucial to predefine and accept your risk before entering a trade.
🙏 Thanks for checking out my post! Make sure to follow me to catch the next update. If you found this helpful, give it a like 👍 and share your thoughts 💬 — I’d love to hear what you think!
⚠️ Please note: This is not financial advice. This content is to track my trading journey and for educational purposes only.
Is it time to reform the EURUSD?
Hi dears
It looks like a head and shoulders pattern has formed which could be a sign of an interesting pullback.
I think we should see the dollar strengthen against its peers over the coming week.
What do you think?
If you like my analysis, just follow my page.

Gold (XAU/USD) Analysis - 22 August 2025Gold continues to trade within a high-volatility range, and today’s structure provides us with very clear execution zones validated across the Daily, 4H, and 1H timeframes. By blending price action, order flow, and institutional concepts, we can refine both the buy and sell areas that carry the highest probability of delivering asymmetric returns.
Macro Context (Daily)
The daily chart maintains a bullish undertone as higher-lows remain intact, and price continues to defend key demand blocks. That said, the upper range resistance around the $3360–$3380 area has capped recent rallies, leaving the market positioned between a strong daily demand base and significant supply overhead.
Swing Structure (4H)
On the 4H, gold is consolidating between a fresh demand block at $3318–$3324 and a supply block at $3356–$3362. This consolidation aligns perfectly with premium/discount zones of the current 4H range, giving us clarity on where institutional flows are likely to engage.
Execution Refinement (1H)
The 1H chart adds precision:
A bullish FVG and demand overlap sit at $3320, creating inducement for long entries.
Above, clear liquidity is resting just beyond $3355 and again near $3380, prime zones for potential stop-runs and reversals.
Momentum indicators (RSI/MACD) show hidden bullish divergence at demand and early exhaustion at supply — adding weight to both sides of the range.
Execution Zones
Primary Buy Zone (Golden Zone) → $3318 – $3324
Entry: $3322 | SL: $3312 | TP1: $3345 | TP2: $3360
Confluence: Daily demand OB + 4H discount zone + 1H FVG + RSI divergence.
Secondary Buy Zone → $3302 – $3308
Entry: $3306 | SL: $3296 | TP1: $3328 | TP2: $3340
Confluence: Deep retracement into 61.8% Fib + untapped 4H OB + liquidity sweep potential.
Primary Sell Zone → $3356 – $3362
Entry: $3359 | SL: $3369 | TP1: $3342 | TP2: $3325
Confluence: Daily resistance + 4H supply OB + premium zone + liquidity inducement above $3355.
Secondary Sell Zone → $3378 – $3384
Entry: $3381 | SL: $3391 | TP1: $3360 | TP2: $3335
Confluence: Major untested daily supply + 4H imbalance + stop-run liquidity.
Executive Summary
The clearest asymmetric opportunity lies in the Primary Buy Zone at $3318–$3324, which aligns across Daily, 4H, and 1H with multiple layers of confluence. This zone provides tight risk control with substantial upside toward $3360.
Until we see a decisive break of either the $3300 handle or the $3380 resistance, expect gold to remain range-bound with sharp liquidity grabs at both extremes. Institutional order flow favors a buy-the-dip bias within demand zones, while rallies into supply should be approached with tactical shorts.
Golden Zone = Buy $3318 – $3324
(best confluence: demand OB + FVG + RSI divergence + structural HL defense)

Gold Price Analysis (XAUUSD) – August 22, 2025On the H1 timeframe, gold is trading around $3,335, showing a clear tug-of-war between bulls and bears. Key observations from the chart:
Resistance Zone: $3,343 – $3,345 (aligned with the EMA200 on H1). This is a critical barrier; unless broken decisively, sellers remain in control.
Support Zone: $3,324 – $3,326. A breakdown here could trigger further declines toward $3,310 – $3,306.
EMA 20/50/100/200: The EMAs are overlapping and slightly downward sloping, suggesting that the medium-term bias still favors sellers, though buyers are trying to defend key supports.
Previous gap-up has already been filled, confirming bearish dominance after the recovery attempt.
Trading Strategies
Bearish Scenario (Primary Setup)
If price fails to break above $3,343 – $3,345, consider short positions near resistance.
Target: $3,324 – $3,310.
Stop Loss: Above $3,348.
Bullish Scenario (Alternative Setup)
If gold breaks strongly above $3,345 with high volume, a short-term bullish momentum may appear.
Target: $3,358 – $3,368.
Stop Loss: Below $3,335.
Outlook
In the short term, XAUUSD is likely to remain range-bound between $3,324 – $3,345. Bears still hold the upper hand, but a breakout above resistance could spark a sharp recovery.
- Follow these key levels closely to optimize your trading plan, and make sure to save this analysis if you find it valuable.

Gold Futures | H4 FVG Fully Filled – What’s Next Into Weekly CloEarlier this week I was watching for price to pull back into the new H4 FVG after we closed above the Daily High. Price rejected from the Asian range mid and dropped cleanly into that zone, ultimately filling the H4 FVG completely.
Now on Friday, price sits right at the Weekly Low (3775.9) and the bottom of that H4 gap. This is a key decision point going into the weekly close.
📌 Scenarios I’m Watching:
✅ Bullish: If price holds this filled H4 FVG / W-L zone, we could see a re-accumulation and a push back toward 3388–3392 rejection block and possibly the Daily High (3394.6) next week.
❌ Bearish: If price fails to hold here, the next liquidity pools below are 3367.4 (D-L) and 3362.5.
📌 Key Levels:
Daily High: 3394.6
Weekly Low: 3775.9
Daily Low: 3367.4
Into Friday close, I’ll be watching whether we get acceptance above this zone (bullish continuation setup) or rejection that opens the door to new weekly lows.
👉 What do you think? Will this area hold as support, or do we see a deeper flush before the week closes?

SILVER: Bears Are Winning! Short!
My dear friends,
Today we will analyse SILVER together☺️
The market is at an inflection zone and price has now reached an area around 38.101 where previous reversals or breakouts have occurred.And a price reaction that we are seeing on multiple timeframes here could signal the next move down so we can enter on confirmation, and target the next key level of 37.980.Stop-loss is recommended beyond the inflection zone.
❤️Sending you lots of Love and Hugs❤️

XAGUSD - ShortXAGUSD – SELL Setup
📊 H1 Timeframe Analysis by Nii_Billions
🔹 Outlook: BEARISH
Using multiple timeframe confirmation for direction.
Strategy blends technicals, fundamentals, and sentiment.
Entry, SL, and TP structured with risk management in mind.
🟢 Educational purposes only 🟢
❤️ Like & comment if this helps your trading journey.
👉 Follow for more swing trade ideas.

GOLD: Move Up Expected! Long!
My dear friends,
Today we will analyse GOLD together☺️
The price is near a wide key level
and the pair is approaching a significant decision level of 3,338.56 Therefore, a strong bullish reaction here could determine the next move up.We will watch for a confirmation candle, and then target the next key level of 3,343.52.Recommend Stop-loss is beyond the current level.
❤️Sending you lots of Love and Hugs❤️

GOLD ROUTE MAP UPDATEHey Everyone,
Quick follow up update on our 1H chart idea:
After completing both our Bullish target at 3352 and Bearish target at 3327, we saw a lock below 3327 which opened the swing range down towards 3304. Price did drop, but not the full test of 3304 before turning back up.
From there, we got the break back above 3327 and another retest of 3352. As expected, price rejected perfectly from 3352, came back down to 3327, and once again gave us a bounce. Now price is heading back up towards 3352.
At the moment, price is clearly rangebound between 3327 and 3352. To confirm the next breakout move, we will need to see the EMA5 cross and lock above or below either of these levels.
We also need to keep in mind the swing range gap left open yesterday in the 3304 region, which remains a possible target before higher moves continue.
So while we continue to buy dips, we must stay mindful that open swing ranges can extend moves further in either direction. Our updated levels and weighted levels allow us to track moves down and then catch the bounces up, as we’ve been doing.
We will continue to buy dips from our support levels, targeting 20 to 40 pips per bounce. As stated before, every level structure we share gives that range consistently, and the swing ranges give even bigger moves than the weighted levels.
BULLISH TARGET
3352 - DONE
EMA5 CROSS AND LOCK ABOVE 3352 WILL OPEN THE FOLLOWING BULLISH TARGETS
3374
EMA5 CROSS AND LOCK ABOVE 3374 WILL OPEN THE FOLLOWING BULLISH TARGET
3398
EMA5 CROSS AND LOCK ABOVE 3398 WILL OPEN THE FOLLOWING BULLISH TARGET
3422
BEARISH TARGETS
3327 - DONE
EMA5 CROSS AND LOCK BELOW 3327 WILL OPEN THE SWING RANGE
3304
3281
As always, we will keep you all updated with regular updates throughout the week and how we manage the active ideas and setups. Thank you all for your likes, comments and follows, we really appreciate it!
Mr Gold
GoldViewFX

GOLD - SHORT TO $2,880 (UPDATE)Gold is edging lower slowly but surely. Our sell position is now running roughly 800 PIPS in profit.
Once we can see a close below $3,300 we can confidently say the next sell target should easily move lower towards $3,190. This is another 1,000 PIPS move lower.

XAUUSD Gold Intraday Setup 21.08.2025Gold has broken out of its bearish channel and is now showing signs of retesting the broken trendline. Price action suggests that the 3332/34 zone (highlighted with confluence from structure support and channel retest) will be key for buyers to step in. As long as price holds above this area, bullish momentum is likely to resume.
The target at 3357 aligns with previous resistance, making it a logical upside objective. A stop-loss below 3323 protects against a deeper retracement back into the bearish structure.
Trading Plan (Buy Setup):
Entry: 3332/34
Stop-Loss: 3323
Target: 3357
