Is this the top? SPY/QQQ Plan Your Trade Update For 8-20I know it has been a while since I shared a video.
This video is designed to share the downside risks I see as a potential for the markets IF this big speculative phase unwinds like I think.
Ultimately, you guys are the ones who will be making the trading decisions. I just want you to be aware that the markets are extremely volatile right now and the data is pointing to a very clean Excess Phase Peak (EPP) pattern.
As you are all aware, the EPP pattern suggests that a breakdown in price is likely where price may attempt to target the FLAG LOW.
If that happens, be prepared for a -15% to -20% breakdown in price before the end of 2025 - possibly seeing an even bigger price collapse.
In my opinion, this breakdown is the result of a broad unwinding of excesses related to the Biden economy (free money) and a move towards more reasonable US economic policies.
Overall, this pullback is necessary for the Wave 1 of Wave 5 structure to complete. Once this pullback is complete, the bigger rally phase (Wave 3 of Wave 5) will begin. And get ready for a big rally phase with Wave 3.
So, I hope this video helps you learn how to identify and plan for some of the biggest price swings in the SPY/QQQ, and prepare for even bigger moves in Gold/Silver and Bitcoin.
Get some.
#trading #research #investing #tradingalgos #tradingsignals #cycles #fibonacci #elliotwave #modelingsystems #stocks #bitcoin #btcusd #cryptos #spy #gold #nq #investing #trading #spytrading #spymarket #tradingmarket #stockmarket #silver
Metals

Confirmation of the continue of the selling side. Ready for SELL✏️ As analyzed yesterday, OANDA:XAUUSD has decreased when looking for selling momentum and target zone 1 has been reached when touching the support zone 3312. This price decrease will soon reach 3285 soon but need to pay a little attention to the statement of FOMC. SELL strategy is the most optimal strategy at the moment for Gold. BUY point must wait for confirmation around 3385 from buyers who want to participate in the market.
📉 Key Levels
SELL trigger: retest resistance 3330 with price rejection from sellers
SELL DCA trigger: break support zone 3312
Leave your comments on the idea. I am happy to read your views.
GOLD ROUTE MAP UPDATEHey Everyone,
Quick follow up update on our 1H chart idea:
After completing both our Bullish target at 3352 and Bearish target at 3327, we now have a lock below 3327 which opened the swing range down towards 3304. We did get the drop, but not the full test of 3304 before price turned back up.
Right now, we are seeing a break back above 3327 and heading towards a retest of 3352 once again. This is in line with our ongoing plan to buy dips, but we must also keep in mind that the swing range remains open. This means any swings can still clear the gap left in that 3304 region before moving higher.
So, while we continue to buy dips, we need to be mindful that open swing ranges can extend moves in either direction.
We will keep the above in mind when taking buys from dips. Our updated levels and weighted levels will allow us to track the movement down and then catch bounces up.
We will continue to buy dips using our support levels taking 20 to 40 pips. As stated before each of our level structures give 20 to 40 pip bounces, which is enough for a nice entry and exit. If you back test the levels we shared every week for the past 24 months, you can see how effectively they were used to trade with or against short/mid term swings and trends.
The swing range give bigger bounces then our weighted levels that's the difference between weighted levels and swing ranges.
BULLISH TARGET
3352 - DONE
EMA5 CROSS AND LOCK ABOVE 3352 WILL OPEN THE FOLLOWING BULLISH TARGETS
3374
EMA5 CROSS AND LOCK ABOVE 3374 WILL OPEN THE FOLLOWING BULLISH TARGET
3398
EMA5 CROSS AND LOCK ABOVE 3398 WILL OPEN THE FOLLOWING BULLISH TARGET
3422
BEARISH TARGETS
3327 - DONE
EMA5 CROSS AND LOCK BELOW 3327 WILL OPEN THE SWING RANGE
3304
3281
As always, we will keep you all updated with regular updates throughout the week and how we manage the active ideas and setups. Thank you all for your likes, comments and follows, we really appreciate it!
Mr Gold
GoldViewFX

Gold (XAU/USD) Analysis – 1H ChartGold is currently trading around 3,341 USD and has shown a sharp intraday recovery from recent lows. The key resistance to watch is at 3,366 USD.
A rejection from this level could trigger a pullback toward 3,328 USD and potentially lower.
A confirmed breakout above 3,366 USD, however, could open the way for further bullish momentum in the short term.
For now, price action remains range-bound, and confirmation from either side is needed before a clear trend develops.

GOLD What Next? SELL!
My dear followers,
This is my opinion on the GOLD next move:
The asset is approaching an important pivot point 3346.3
Bias - Bearish
Safe Stop Loss - 3351.6
Technical Indicators: Supper Trend generates a clear short signal while Pivot Point HL is currently determining the overall Bearish trend of the market.
Goal - 3336.2
About Used Indicators:
For more efficient signals, super-trend is used in combination with other indicators like Pivot Points.
Disclosure: I am part of Trade Nation's Influencer program and receive a monthly fee for using their TradingView charts in my analysis.
———————————
WISH YOU ALL LUCK

NASDAQ (CASH100) – Buy the Dip or Trend ReversalThe Cash100 has been trending in an upward channel since May 2025.
Today, price has broken through diagonal support.
For confirmation that the upward channel is over, I will be looking for these signals:
✅ First signal: a 4H close below diagonal support.
✅ Second signal: a retest of the diagonal. If price fails to reclaim,
I’ll start looking for short setups if both signals above confirm.
What do you think — is the uptrend finally breaking, or will buyers step back in? 👀
Thanks for checking out my post! Make sure to follow me to catch the next update. If you found this helpful, give it a like 👍 and share your thoughts 💬 — I’d love to hear what you think!
Please note: This is not financial advice. This content is to track my trading journey and for educational purposes only.

SILVER: Will Go Up! Long!
My dear friends,
Today we will analyse SILVER together☺️
The in-trend continuation seems likely as the current long-term trend appears to be strong, and price is holding above a key level of 37.683 So a bullish continuation seems plausible, targeting the next high. We should enter on confirmation, and place a stop-loss beyond the recent swing level.
❤️Sending you lots of Love and Hugs❤️

GOLD: The Market Is Looking Down! Short!
My dear friends,
Today we will analyse GOLD together☺️
The market is at an inflection zone and price has now reached an area around 3,341.83 where previous reversals or breakouts have occurred.And a price reaction that we are seeing on multiple timeframes here could signal the next move down so we can enter on confirmation, and target the next key level of 3,332.51.Stop-loss is recommended beyond the inflection zone.
❤️Sending you lots of Love and Hugs❤️

GOLD Technical Outlook: Bearish Below 3343, Eyeing 3332 → 3320Gold Futures Overview
Gold futures edged slightly higher but remain trapped in a tight consolidation range. The market is caught between conflicting macro signals — real yields, dollar strength, and uncertainty around the Fed’s next steps — while geopolitical risks continue to provide medium-term support.
Inflation remains the key risk factor: if it proves persistent, the Fed may be forced to maintain higher rates for longer, limiting gold’s upside.
🔹 Technical Outlook
In the short term, momentum is bearish as long as price trades below 3343, targeting 3332. A sustained break beneath this level would extend losses toward 3320 and 3313.
On the flip side, a confirmed 1H close above 3346 would shift momentum, opening the way toward 3355–3365, with potential extension to 3375.
Support: 3332, 3320, 3313
Resistance: 3355, 3365, 3375

XAUUSD – Waiting for the Market to Show Its Hand1. Yesterday’s Setup
In my yesterday’s analysis, I mentioned that while I am bullish overall, I could not ignore the pressure Gold was putting on the 3330 support. I also noted that for bulls to regain control, a break above 3345 was needed.
The market reacted with textbook precision: price rallied exactly to 3345 before breaking down through 3330, reaching a low of 3311. Currently, we see a normal rebound, but inside a bearish short-term structure.
________________________________________
2. The Key Question
Is this just a continuation of the downtrend, or a trap before the real bullish move?
________________________________________
3. Why I’m Not Convinced by the Bears
• The recent drop doesn’t look impulsive—it’s overlapped and choppy, more like a stepway accumulation phase.
• The pattern is contained inside a falling wedge, a structure that usually favors upside breaks.
• Bears had their chance yesterday, but the follow-through looks weak.
________________________________________
4. Trading Plan
At this moment, I’m out of the market, waiting for confirmation.
• Buy zone: around 3300–3305 for a potential re-entry long.
• Bullish confirmation: if price climbs back above yesterday’s high (3345), it would negate the breakdown and confirm a false break.
• With price now at 3322, I prefer to stay patient, watching how it reacts at the key levels.
________________________________________
5. Final Note 🚀
Gold is now right in the middle of my interest range. For me, it’s not about predicting—it’s about waiting for the market to reveal the next high-probability setup.
Disclosure: I am part of TradeNation's Influencer program and receive a monthly fee for using their TradingView charts in my analyses and educational articles.

20/08/25 Gold Swing LevelsSet your alerts. Watch the 5 mins (1 min if price spiking)
20/08/25 levels are marked
Always, price action determines trade.
Trade parameters
Entry on 5 min chart
Sl: 20-40pips
TP: 2-4x SL

SILVER Will Go Lower From Resistance! Sell!
Take a look at our analysis for SILVER.
Time Frame: 8h
Current Trend: Bearish
Sentiment: Overbought (based on 7-period RSI)
Forecast: Bearish
The market is approaching a key horizontal level 3,759.7.
Considering the today's price action, probabilities will be high to see a movement to 3,630.5.
P.S
We determine oversold/overbought condition with RSI indicator.
When it drops below 30 - the market is considered to be oversold.
When it bounces above 70 - the market is considered to be overbought.
Disclosure: I am part of Trade Nation's Influencer program and receive a monthly fee for using their TradingView charts in my analysis.
Like and subscribe and comment my ideas if you enjoy them!

Gold Trading Strategy XAUUSD 20/8/2025Gold Trading Strategy XAUUSD 20/8/2025: Gold falls to lowest level since early this month, continues to be under pressure from potential talks, watching the FED minutes.
Fundamental news: Spot gold prices fell sharply, hitting their lowest intraday level since August 1. Gold prices fell as US President Donald Trump, Ukrainian President Zelensky and European leaders discussed potential talks with Russia. Safe-haven demand eased as security speculation in Kiev sparked optimism that the war could end.
Technical analysis: Gold prices broke out of a bullish pattern and formed a bearish channel on the H1 timeframe. Currently, the MA lines combined with the liquidity zone are the resistance zones of gold prices. However, gold prices can recover strongly when approaching the support area of 3300, the fluctuation range of gold prices today will be 3300 - 3350.
Important price zones today: 3335 - 3340, 3350 - 3355 and 3300 - 3305.
Today's trading trend: SELL.
Recommended orders:
Plan 1: SELL XAUUSD zone 3338 - 3340
SL 3343
TP 3335 - 3325 - 3315 - 3300.
Plan 2: SELL XAUUSD zone 3350 - 3352
SL 3355
TP 3347 - 3337 - 3327 - 3300.
Plan 3: BUY XAUUSD zone 3300 - 3302
SL 3297
TP 3305 - 3315 - 3335 - 3350.
Wish you a safe, successful and profitable trading day.🥰🥰🥰🥰🥰

XAU/USD/ Bearish Trend Read The captionSMC Trading point update
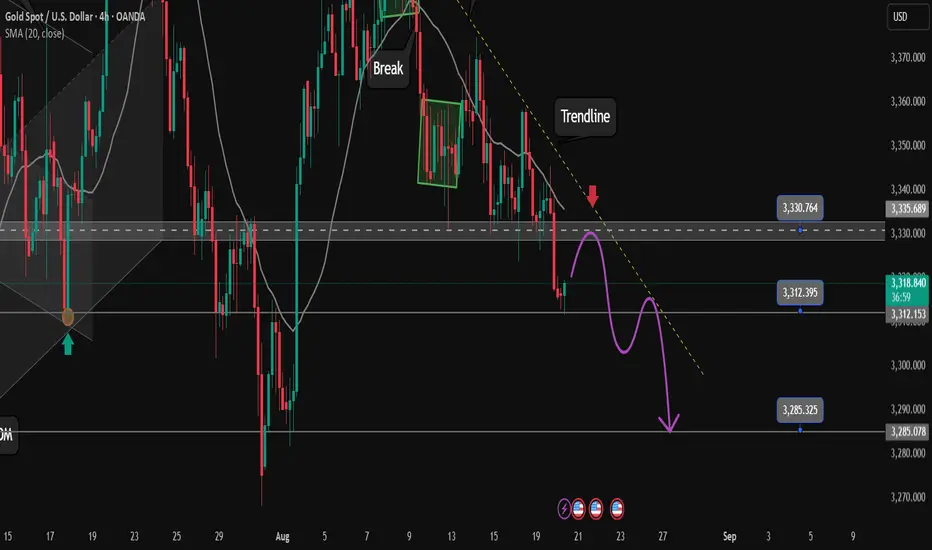
Technical analysis of analysis Gold (XAU/USD), 2H timeframe:
Trend Context: Price is moving inside a descending channel, showing continued bearish pressure.
Key Resistance Zone: The yellow highlighted area around $3,340 – $3,347 is acting as a supply zone / resistance, aligned with the 200 EMA, reinforcing bearish bias.
Rejection Signals: Multiple rejections (red arrows) confirm sellers are defending this zone.
Bearish Setup: Price is expected to reject from resistance and continue lower within the channel.
Target Point: The projection suggests a decline towards $3,302, aligning with previous swing levels and channel support.
RSI: Currently mid-level (~51), showing no strong momentum shift yet, but still leaves room for downside pressure.
Mr SMC Trading point
Summary Idea:
Gold is respecting the bearish channel and supply zone. As long as price stays below $3,347, the setup favors a bearish continuation targeting $3,302.
Please support boost 🚀 this analysis)

Gold Trading Strategy XAUUSD 20/8/2025Gold Trading Strategy XAUUSD 20/8/2025:
Gold falls to lowest level since early this month, continues to be under pressure from potential talks, watching the FED minutes.
Fundamental news: Spot gold prices fell sharply, hitting their lowest intraday level since August 1. Gold prices fell as US President Donald Trump, Ukrainian President Zelensky and European leaders discussed potential talks with Russia. Safe-haven demand eased as security speculation in Kiev sparked optimism that the war could end.
Technical analysis: Gold prices broke out of a bullish pattern and formed a bearish channel on the H1 timeframe. Currently, the MA lines combined with the liquidity zone are the resistance zones of gold prices. However, gold prices can recover strongly when approaching the support area of 3300, the fluctuation range of gold prices today will be 3300 - 3350.
Important price zones today: 3335 - 3340, 3350 - 3355 and 3300 - 3305.
Today's trading trend: SELL.
Recommended orders:
Plan 1: SELL XAUUSD zone 3338 - 3340
SL 3343
TP 3335 - 3325 - 3315 - 3300.
Plan 2: SELL XAUUSD zone 3350 - 3352
SL 3355
TP 3347 - 3337 - 3327 - 3300.
Plan 3: BUY XAUUSD zone 3300 - 3302
SL 3297
TP 3305 - 3315 - 3335 - 3350.
Wish you a safe, successful and profitable trading day.🥰🥰🥰🥰🥰

Gold Trading Strategy XAUUSD 20/8/2025Gold Trading Strategy XAUUSD 20/8/2025: Gold falls to lowest level since early this month, continues to be under pressure from potential talks, watching the FED minutes.
Fundamental news: Spot gold prices fell sharply, hitting their lowest intraday level since August 1. Gold prices fell as US President Donald Trump, Ukrainian President Zelensky and European leaders discussed potential talks with Russia. Safe-haven demand eased as security speculation in Kiev sparked optimism that the war could end.
Technical analysis: Gold prices broke out of a bullish pattern and formed a bearish channel on the H1 timeframe. Currently, the MA lines combined with the liquidity zone are the resistance zones of gold prices. However, gold prices can recover strongly when approaching the support area of 3300, the fluctuation range of gold prices today will be 3300 - 3350.
Important price zones today: 3335 - 3340, 3350 - 3355 and 3300 - 3305.
Today's trading trend: SELL.
Recommended orders:
Plan 1: SELL XAUUSD zone 3338 - 3340
SL 3343
TP 3335 - 3325 - 3315 - 3300.
Plan 2: SELL XAUUSD zone 3350 - 3352
SL 3355
TP 3347 - 3337 - 3327 - 3300.
Plan 3: BUY XAUUSD zone 3300 - 3302
SL 3297
TP 3305 - 3315 - 3335 - 3350.
Wish you a safe, successful and profitable trading day.🥰🥰🥰🥰🥰

GOLD BEARS ARE STRONG HERE|SHORT
GOLD SIGNAL
Trade Direction: short
Entry Level: 3,330.62
Target Level: 3,305.39
Stop Loss: 3,347.39
RISK PROFILE
Risk level: medium
Suggested risk: 1%
Timeframe: 1h
Disclosure: I am part of Trade Nation's Influencer program and receive a monthly fee for using their TradingView charts in my analysis.
✅LIKE AND COMMENT MY IDEAS✅

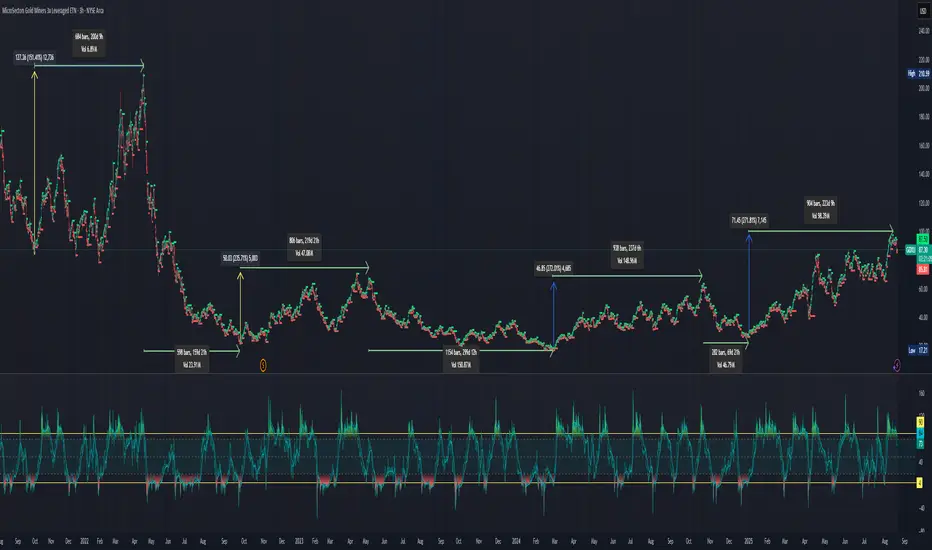
SHORT: Short term GDXU 2X pull back, is it now time to go GDXDI've laid out the major run ups and pull backs. The last 3 run ups have lasted 219 - 237 days. If the last peak was put in by GDXU it would put it at 225 days. I'm looking at this as a potential repeating pattern. Note the GDXU run ups based on a % gain from the bottom, assuming, the most recent peak was the final high in this run up. The run ups were +241%, +270%, and +279%. The run up also reasonable for the peak.
Big question, what about the draw downs. The last 2 have been -54%, -42%, and-60%. In GDXD, the inverse gold miners ETF 2X levered resulted in a gain of +90%, +58%, and +95%. The run up on the inverse side lasted 53, 20, and 22 days. GDXD is currently up +13% in the last 7 days.
Take aways, reduce/eliminate position in long GDXU and wait for a better buy in position and potential upside in the inverse gold miners etf.
Gamification People don't trade for money, they trade for other reasons without realising.
Many new traders, start with a point to prove. Although in the crypto space it seems to be "how to turn $100 into a Lambo" The issue is you know the majority of the comments will be from people that are way overleveraged on money they don't have.
Then you have individuals who are successful in another field, and they come to trade, thinking it's easy and they can win here as well.
The market has a way of humbling people quickly.
Gamification is more to do with people who "need to be in the market" - more trades equals more wins and more profits.
The issue is, well at least for most. Is that they dive in without really learning how to manage risk, actually no clue how to manage money properly not just the risk.
I wrote this post back in 2021 - Click it to open.
The psychology part of trading is the biggest thing most people seem to fail to understand.
It isn't just about risk management, it's about how you manage your emotions, the ability to not jump into revenge trades and beyond all of that it's about reading the markets with an appreciation of what the gamers are looking for.
Have you ever lined up a trade, you have your TP and SL mapped out, you have a clear plan - you assume your trading with an edge and you see an expected move like this?
Yet, as soon as you enter you get a run.
You see, when you are too focused on the game, you fail to read the story. Instead, you play each level as it's own map.
I covered a topic of relevance here;
This is about how you can structure the ranges, mechanically and take away the emotions and the guesswork.
When you fail to spot the signs, it's like missing a power up in a game.
The market often leaves behind footprints; these footprints help build a bias and in turn, give you more confirmation for each setup.
In this post, I explained that many new traders go seeking a silver bullet; they look for more data, indicators, screens, and instruments to trade.
I can't stress enough - less is more!!!!
Trading isn't about hoping you can turn your last $500 dollars into a retirement fund. It's about winning big and losing small. Then you refine and adjust so the win rate increases and doing it all again next week, next month, next year.
Now look at that image above and see the obvious when you zoom out.
As clear as day you can see an impulsive move, followed by a corrective move.
Instead of playing the game, try learning the map first.
This will help 100% with your win rate, that will ease your emotional anxiety and put you on the right path.
There are tools available today such as prop firms where you can reduce/limit your exposure, learn to trade as if it's a skill and not a game, and you will surprise yourself!
Stay safe! Have a great week!
Disclaimer
This idea does not constitute as financial advice. It is for educational purposes only, our principal trader has over 25 years' experience in stocks, ETF's, and Forex. Hence each trade setup might have different hold times, entry or exit conditions, and will vary from the post/idea shared here. You can use the information from this post to make your own trading plan for the instrument discussed. Trading carries a risk; a high percentage of retail traders lose money. Please keep this in mind when entering any trade. Stay safe.

XAUUSD: Market Analysis and Strategy for August 20Gold Support and Resistance Update:
Daily Chart Resistance: 3358, Support: 3300
4-Hour Chart Resistance: 3345, Support: 3310
1-Hour Chart Resistance: 3327, Support: 3318.
The 4-Hour MACD is currently forming a low-level death cross with high volume, and the STO indicator indicates oversold conditions, indicating that gold prices are consolidating at low levels. A short-term rebound will not exceed the resistance level of the middle line and the moving average. Keep an eye on the resistance level of 3332-3341. However, the moving average resistance level will shift downwards over time. Currently, focus on the MA10 resistance level at 3327. On the daily chart, yesterday's decline continued the market's downward trend. On the 1-Hour Chart, prices are trading below the MA60/MA120 daily moving averages. The MACD is trading below the zero axis, indicating strong downward momentum and increasing bearish strength. The RSI is trading below the middle axis, and the KDJ pattern favors a continued decline, indicating a bearish short-term trend. During the NY session, focus on resistance at 3330/3345 and support at 3300/3292. My personal recommendation: sell on rallies!
SELL: near 3327
SELL: near 3343
BUY: near 3300

SILVER BEARS ARE GAINING STRENGTH|SHORT
SILVER SIGNAL
Trade Direction: short
Entry Level: 3,807.9
Target Level: 3,771.0
Stop Loss: 3,832.4
RISK PROFILE
Risk level: medium
Suggested risk: 1%
Timeframe: 3h
Disclosure: I am part of Trade Nation's Influencer program and receive a monthly fee for using their TradingView charts in my analysis.
✅LIKE AND COMMENT MY IDEAS✅

The dividing line 3330-3340 is not broken and rebounds to short#XAUUSD
After repeated fluctuations in the white session last night, gold fell below 3320 in the NY session and closed with weak fluctuations. 📊This morning, gold hit a low near 3311,📉 which aligns with our short-term outlook.✅
Judging from the monthly chart, the decline of gold in recent weeks has not been smooth, and each time it has been accompanied by a relatively strong rebound. 📈Today, there is a rebound near the 3311 line below. This point deserves our attention.👀 Previously, NFP achieved a big rise after breaking through here.🚀 At the same time, this point is also the area of the daily 100-day moving average.🐂
The first time it hits this point, it is bound to usher in a bullish resistance, and this is indeed the case.⚖️ Once it falls below this point, the next step will be the 3300 integer mark, 🥅and it may even hit the previous low, which is also the lower track of the daily line around 3280.↘️
Although the current market is relatively strong in short-term selling, we should not be overly bearish in the short term.↘️ After all, the impact of the news has not completely dissipated. The Federal Reserve will also release the meeting minutes in the evening NY session, 📰so we still need to be vigilant that the bulls may counterattack at any time.📈
In the short term, pay attention to the upper 3330-3340 bull-bear dividing line. If you encounter resistance and pressure in this range, you can consider shorting in batches with light positions, looking towards 3315-3300, and defending 3345. If the rebound effectively breaks through 3345, gold may fluctuate again.📊
🚀 SELL 3330-3340
🚀 TP 3315-3300
