Multi-Asset Market Analysis & Trade IdeasAnalysis Date : September 10, 2025
Trading Analyst : Institutional Intelligence Framework
Methodology : Dual Renko Chart System with Enhanced Volume Profile Analysis
Executive Summary
Current market analysis reveals exceptional institutional opportunities across equity indices with significant commodity sector divergence. The enhanced institutional intelligence framework identifies unprecedented buying dominance in major equity markets while revealing dangerous extensions in traditional safe-haven assets.
Portfolio Allocation Strategy : 75-85% equity allocation with minimal commodity/currency exposure based on institutional positioning intelligence.
Primary Opportunities (70-85% Total Allocation)
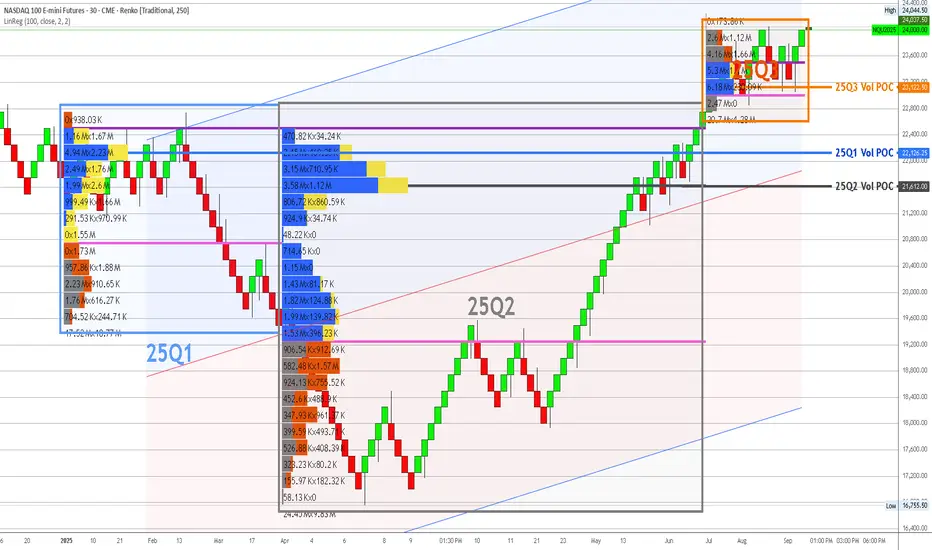
1. NASDAQ 100 (NQ) - 25-30% ALLOCATION
Classification : PRIMARY OPPORTUNITY - Institutional Backing
YTD View:
Institutional Intelligence :
Q3 Volume Analysis : 26.8:1 buying dominance (6.18M UP vs 230.69K DOWN)
Current Position : 23,963 (+3.4% above Q3 POC 23,186)
Support Structure : Exceptional multi-quarter institutional foundation
Risk Assessment : LOWEST RISK - strongest institutional conviction identified
Trade Recommendations :
Bullish Scenario (65% probability) :
Entry : /MNQ at current levels or any pullback to 23,500-23,600
Position Size : Maximum 2.5% account risk per position
Target 1 : 24,500 (close 50% position)
Target 2 : 25,000 (close 25% position)
Target 3 : 25,500+ (trail remaining 25%)
Stop Loss : 23,000 (below Q3 institutional support)
Neutral Scenario (25% probability) :
Range : 23,200-24,200 consolidation
Strategy : Scale into positions on weakness toward 23,400
Management : Hold core position, trade edges of range
Re-evaluation : Weekly basis for breakout confirmation
Bearish Scenario (10% probability) :
Trigger : Break below 23,000 (institutional support failure)
Action : Exit all positions immediately
Re-entry : Require fresh institutional accumulation evidence
Risk Control : Maximum 2% loss on allocation
2. S&P 500 (ES) - 25-30% ALLOCATION
Classification : PRIMARY OPPORTUNITY - Strong Institutional Support
3-QTR View:
YTD View:
Institutional Intelligence :
Q3 Volume Analysis : 5.21:1 buying dominance (11.3M UP vs 2.17M DOWN)
Current Position : 6,550 (+2.7% above Q3 POC 6,375)
Support Structure : Consistent institutional accumulation across quarters
Risk Assessment : LOW RISK - exceptional institutional backing
Trade Recommendations :
Bullish Scenario (70% probability) :
Entry : /MES at current levels or pullback to 6,450-6,500
Position Size : Maximum 2.5% account risk per position
Target 1 : 6,650 (close 50% position)
Target 2 : 6,750 (close 25% position)
Target 3 : 6,850+ (trail remaining 25%)
Stop Loss : 6,300 (below Q3 institutional support)
Neutral Scenario (20% probability) :
Range : 6,400-6,600 consolidation
Strategy : Accumulate on weakness, trim on strength
Management : Maintain core position size
Monitoring : Weekly institutional level respect
Bearish Scenario (10% probability) :
Trigger : Break below 6,300 (institutional support violation)
Action : Systematic position reduction
Stop Loss : 6,250 (complete exit level)
Re-entry : Wait for institutional re-engagement signals
3. DOW JONES (YM) - 20-25% ALLOCATION
Classification : HIGH CONVICTION - YTD POC Validation
3-QTR View:
YTD View:
Institutional Intelligence :
Q3 Volume Analysis : 11.5:1 buying dominance (455.32K UP vs 83.17K DOWN)
YTD POC Alignment : Perfect alignment with Q1 POC at 45,150
Current Position : 45,651 (+1.1% above institutional consensus)
Risk Assessment : VERY LOW RISK - optimal positioning
Trade Recommendations :
Bullish Scenario (75% probability) :
Entry : /MYM at current levels (optimal positioning confirmed)
Position Size : Maximum 2.5% account risk per position
Target 1 : 46,200 (close 40% position)
Target 2 : 46,800 (close 30% position)
Target 3 : 47,500+ (trail remaining 30%)
Stop Loss : 44,800 (below YTD/Q1 POC consensus)
Neutral Scenario (20% probability) :
Range : 45,000-46,000 consolidation around institutional consensus
Strategy : Hold core position, add on dips to 45,200
Management : Optimal risk/reward positioning maintained
Advantage : Minimal downside to institutional support
Bearish Scenario (5% probability) :
Trigger : Break below 45,000 (YTD POC violation)
Action : Reduce position by 50%
Ultimate Stop : 44,500 (complete exit)
Assessment : Highly unlikely given institutional validation
Secondary Opportunities (15-20% Total Allocation)
4. WTI CRUDE OIL (CL) - 15-20% ALLOCATION
Classification : SOLID OPPORTUNITY - Strong Institutional Foundation
3-QTR View:
YTD View:
Institutional Intelligence :
Q3 Volume Analysis : 1.94:1 buying dominance (1.38M UP vs 710.76K DOWN)
Current Position : 63.27 (within Q3 institutional accumulation zone)
Support Structure : Massive Q2 institutional accumulation at 57.50
Risk Assessment : LOW RISK - multiple institutional support layers
Trade Recommendations :
Bullish Scenario (60% probability) :
Entry : /MCL at current levels or pullback to 62.50-63.00
Position Size : Maximum 2% account risk per position
Target 1 : 67.00 (close 50% position)
Target 2 : 69.00 (close 25% position)
Target 3 : 71.00+ (trail remaining 25%)
Stop Loss : 61.50 (below Q3 institutional support)
Neutral Scenario (30% probability) :
Range : 62.00-65.00 consolidation within institutional zone
Strategy : Scale into positions on weakness
Management : Patient accumulation approach
Support : Strong institutional backing provides downside protection
Bearish Scenario (10% probability) :
Trigger : Break below 61.00 (institutional support failure)
Action : Exit positions systematically
Re-entry : 58.00 area (Q2 POC support)
Risk Management : Tight stops due to support proximity
Defensive Positions (8-12% Total Allocation)
5. NATURAL GAS (NG) - 8-12% ALLOCATION
Classification : MODERATE RISK - Declining Institutional Engagement
3-QTR View:
YTD View:
Institutional Intelligence :
Q3 Volume Analysis : Mixed activity with reduced institutional participation
Q1 Peak : 10.6:1 buying dominance (697K UP vs 65K DOWN) - historical high
Current Concern : 65% volume decline from Q1 peaks
Risk Assessment : MODERATE - institutional disengagement evident
Trade Recommendations :
Bullish Scenario (45% probability) :
Entry : Current levels only with tight risk controls
Position Size : Maximum 1.5% account risk per position
Target 1 : 3.40 (close 60% position)
Target 2 : 3.60 (close remaining 40%)
Stop Loss : 2.90 (below Q3 POC support)
Neutral Scenario (35% probability) :
Range : 3.00-3.20 consolidation
Strategy : Avoid new positions, monitor for re-engagement
Management : Maintain defensive positioning
Watch : Volume quality for institutional return
Bearish Scenario (20% probability) :
Trigger : Break below 2.90 (Q3 support failure)
Action : Complete position liquidation
Assessment : Institutional abandonment acceleration
Avoidance : No re-entry until fresh accumulation evidence
Risk Management Positions (8-13% Total Allocation)
6. EURO FUTURES (6E) - 5-8% ALLOCATION
Classification : DEFENSIVE ONLY - Dangerous Extension
3-QTR View:
YTD View:
Institutional Intelligence :
YTD POC Analysis : 1.0525 (aligned with Q1 POC)
Current Position : 1.1769 (+12.9% above institutional consensus)
Extension Risk : DANGEROUS - trading far beyond smart money positioning
Risk Assessment : HIGH RISK - profit-taking territory
Trade Recommendations :
Bullish Scenario (25% probability) :
Entry : AVOID new long positions
Existing Positions : Systematic profit-taking recommended
Target : 1.1850 maximum (close all positions)
Risk : Overextension beyond institutional support
Neutral Scenario (35% probability) :
Range : 1.1650-1.1800 at dangerous extension levels
Strategy : Range trading only with tight stops
Position Size : Maximum 1% account risk
Management : Defensive positioning required
Bearish Scenario (40% probability) :
Trigger : Any breakdown below 1.1700
Target : Return to institutional consensus (1.0525)
Action : Short opportunities on strength
Strategy : Mean reversion to YTD POC likely
7. GOLD FUTURES (GC) - 3-5% ALLOCATION
Classification : EXTREME CAUTION - Maximum Extension
3-QTR View:
YTD View:
Institutional Intelligence :
Extension Analysis : 12.2% above all institutional positioning
Q2 Peak Activity : 11.5:1 buying dominance at 3,430 levels
Current Position : 2,676 (extremely overextended)
Risk Assessment : MAXIMUM RISK - correction vulnerability
Trade Recommendations :
Bullish Scenario (15% probability) :
Entry : AVOID all new long positions
Existing : Immediate profit-taking recommended
Risk : Extreme overextension unsustainable
Management : Defensive exit strategy only
Neutral Scenario (25% probability) :
Range : 2,650-2,700 at unsustainable levels
Strategy : No positioning recommended
Assessment : Range trading too risky given extension
Monitoring : Watch for breakdown signals
Bearish Scenario (60% probability) :
Target : 3,400-3,500 (return to institutional zones)
Correction Magnitude : 12-15% decline likely
Strategy : Short opportunities on any strength
Entry : /MGC shorts on rallies above 2,690
Stop : 2,720 (tight risk control)
Target : 3,450 (institutional accumulation zone)
Risk Management Protocols
Position Sizing Framework
Maximum Risk Per Trade : 2% of account value
Maximum Sector Exposure : 6% (energy, metals, currencies)
Portfolio Heat : Maximum 15% total risk across all positions
Cash Reserve : 5-12% for opportunities and margin requirements
Stop Loss Hierarchy
Tactical Stops : 2-3 Renko blocks on execution charts
Strategic Stops : Below/above institutional POC levels
Emergency Stops : Below major quarterly support levels
Time Stops : Exit if no progress within 15 trading days
Profit Taking Protocol
Systematic Approach :
Target 1 : Close 40-50% of position at 2:1 risk/reward
Target 2 : Close 25-30% of position at 3:1 risk/reward
Target 3 : Trail remaining 20-25% with institutional level stops
Correlation Management
Equity Exposure : Maximum 75-85% combined (NQ+ES+YM)
Commodity Exposure : Maximum 25-30% combined (CL+NG)
Currency Exposure : Maximum 10% (6E only)
Safe Haven Exposure : Maximum 5% (GC defensive only)
Market Scenario Planning
Scenario A: Continued Equity Strength (60% probability)
Characteristics : Institutional accumulation continues, economic resilience
Winners : NQ, ES, YM (maximize equity allocation)
Losers : GC, 6E (extension corrections)
Strategy : Aggressive equity positioning, defensive commodity stance
Scenario B: Market Consolidation (25% probability)
Characteristics : Range-bound trading around institutional levels
Winners : YM (optimal positioning), CL (institutional support)
Neutral : NQ, ES (trade ranges)
Strategy : Reduce position sizes, focus on institutional level trading
Scenario C: Risk-Off Environment (15% probability)
Characteristics : Institutional support failure, flight to quality
Winners : Cash, defensive positioning
Losers : All risk assets
Strategy : Emergency protocols, systematic position reduction
Trigger : Break below major institutional support levels
Weekly Monitoring Checklist
Daily Assessment
Institutional POC level respect across all markets
Volume quality and institutional engagement trends
Position sizing within risk parameters
Stop loss proximity to institutional levels
Weekly Review
Portfolio allocation vs. target percentages
Risk/reward ratios for all open positions
Institutional volume profile evolution
Correlation analysis across positions
Performance tracking vs. benchmarks
Monthly Evaluation
Quarterly volume profile updates
YTD POC alignment reassessment
Strategy performance attribution
Risk management protocol effectiveness
Market regime change identification
Key Success Factors
Institutional Intelligence Priority
Decision Hierarchy :
Institutional volume profile positioning (strategic)
YTD POC alignment validation (tactical)
Technical indicator confirmation (execution)
Risk management protocols (defensive)
Discipline Requirements
Systematic adherence to position sizing formulas
Emotional detachment from individual trade outcomes
Institutional level respect over short-term price action
Professional risk management with systematic protocols
Performance Expectations
Win Rate Target : 55-65% (institutional backing advantage)
Risk/Reward Minimum : 2:1 average across all trades
Maximum Drawdown : <8% of trading capital
Consistency : Positive monthly returns 65%+ of time
Disclaimer : All trading involves risk of loss. Past performance does not guarantee future results. Position sizes and risk management protocols must be adjusted based on individual account size and risk tolerance. This analysis is for educational purposes and should not be considered personalized investment advice.
Document Status : Active trading framework requiring weekly updates and quarterly reassessment.
Metals
GOLD ROUTE MAP UPDATEHey Everyone,
This is the 1H chart route map we tracked this week - played out beautifully to completion.
After hitting 3658, we saw no further EMA5 cross and lock, which led to the rejection. As expected, the lower Goldturns acted as support, giving us the planned dip-buying opportunities.
First, 3638 held as support with multiple bounces.
Then we got a cross-and-lock break below 3638, which opened 3613.
That target was hit and provided a support bounce back into 3638 today.
Right now, price action is playing between 3613 and 3638. An EMA5 cross and lock at either level will determine the next range.
We will keep the above in mind when taking buys from dips. Our updated levels and weighted levels will allow us to track the movement down and then catch bounces up.
We will continue to buy dips using our support levels taking 20 to 40 pips. As stated before each of our level structures give 20 to 40 pip bounces, which is enough for a nice entry and exit. If you back test the levels we shared every week for the past 24 months, you can see how effectively they were used to trade with or against short/mid term swings and trends.
As always, we will keep you all updated with regular updates throughout the week and how we manage the active ideas and setups. Thank you all for your likes, comments and follows, we really appreciate it!
Mr Gold
GoldViewFX

GOLD: Strong Bullish Sentiment! Long!
My dear friends,
Today we will analyse GOLD together☺️
The market is at an inflection zone and price has now reached an area around 3,632.97 where previous reversals or breakouts have occurred.And a price reaction that we are seeing on multiple timeframes here could signal the next move up so we can enter on confirmation, and target the next key level of 3,643.34.Stop-loss is recommended beyond the inflection zone.
❤️Sending you lots of Love and Hugs❤️

Gold (XAUUSD) Technical Outlook
🟢 Bullish Scenario:
Key level: 3612
If the price holds above 3612, the bullish momentum is likely to continue towards:
🎯 First target: 3656
🎯 Second target: 3675
🎯 Third target: 3697 (if 3656 breaks strongly)
🔴 Bearish Scenario:
If the price breaks and sustains below 3612, the downside move may extend towards:
🎯 First support: 3595 (a strong support zone)
🎯 If this level breaks and price sustains below ➝ further decline towards:
🎯 Second target: 3546
📌 Summary:
3612 = key decision level
3656, 3675, 3697 = upside targets
3595, 3546 = downside targets

CPI in Focus – Gold’s Sell Setup ActivatedGold is showing signs of weakness after failing to sustain above 3674. Any pullback toward 3635 – 3650 can provide a good sell opportunity, with confirmation below 3617 accelerating downside. Bears will eye 3599 – 3581 as the next key levels, while major support lies at 3540.
Today’s US CPI data will be the key driver — if inflation comes in hotter than expected, it could strengthen the dollar and pressure gold lower. On the other hand, a softer CPI print may support gold with a bounce toward 3635–3650 before fresh selling pressure resumes.
🔑 Key Levels to Watch
- Resistance: 3640 – 3650
- Support: 3618 - 3600
📌 Sell Zone & Sell Trigger:
- Sell Zone: 3640 – 3650 area
- Sell Trigger: If price retests 3635 – 3650 and rejects with bearish candles → short entries valid or Confirmation break below 3617 will add more bearish pressure.
Note
Please risk management in trading is a Key so use your money accordingly. If you like the idea then please like and boost. Thank you and Good Luck!

GOLD Trading Opportunity! SELL!
My dear followers,
I analysed this chart on GOLD and concluded the following:
The market is trading on 3635.2 pivot level.
Bias - Bearish
Technical Indicators: Both Super Trend & Pivot HL indicate a highly probable Bearish continuation.
Target - 3624.7
Safe Stop Loss - 3641.7
About Used Indicators:
A super-trend indicator is plotted on either above or below the closing price to signal a buy or sell. The indicator changes color, based on whether or not you should be buying. If the super-trend indicator moves below the closing price, the indicator turns green, and it signals an entry point or points to buy.
Disclosure: I am part of Trade Nation's Influencer program and receive a monthly fee for using their TradingView charts in my analysis.
———————————
WISH YOU ALL LUCK

Gold Trading Strategy XAUUSD 11/9/2025Gold Trading Strategy XAUUSD 11/9/2025: Gold is stable, traders prepare ahead of important US CPI data, conditions and technical positions to watch.
Fundamental news: Spot gold prices were generally stable in today's Asian trading session, currently around $3630/ounce. Gold prices are in a wait-and-see mode, closely watching the all-time high before the release of US CPI data for August. Weak US PPI inflation data, fueling speculation that the Federal Reserve will continue its easing cycle at its upcoming meeting in September.
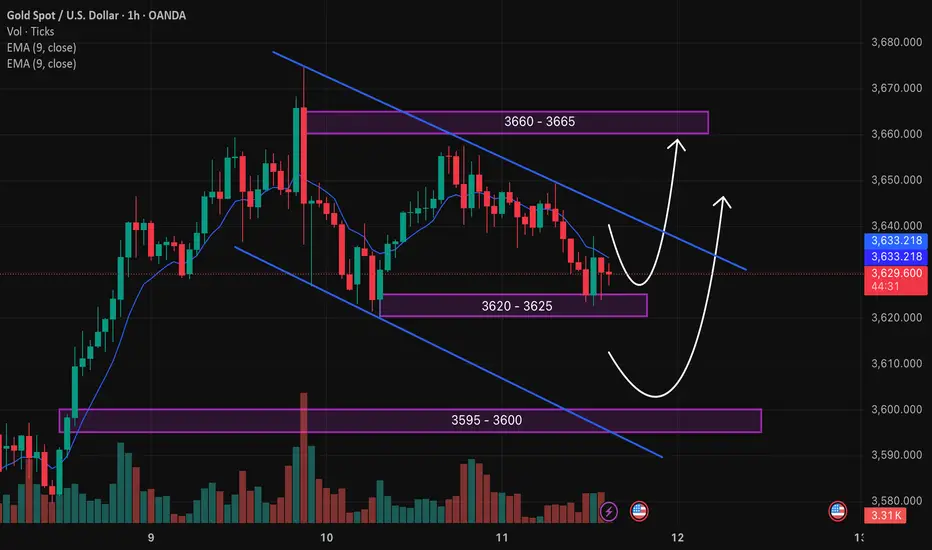
Technical analysis: After making the latest ATH at 3675, gold prices are correcting and forming a short-term downtrend channel in the H1 frame, however, the 3620 - 3625 area is still a good support zone for gold prices. Currently, there will be 2 scenarios with the highest probability of occurrence: Case 1: Gold price will form an upward price pattern around the 3620 - 3625 area and increase sharply, we will wait for the reaction when the price meets resistance at 3660 - 3665. Case 2: Gold price continues to follow the downtrend channel to the lower support area of 3595 - 3600 and then increase again. We will trade based on these 2 scenarios and still prioritize trading according to the main trend.
Important price zones today: 3620 - 3625, 3595 - 3600 and 3660 - 3665.
Today's trading trend: BUY.
Recommended orders:
Plan 1: BUY XAUUSD zone 3620 - 3622
SL 3617
TP 3625 - 3635 - 3645 - 3665 - OPEN.
Plan 2: BUY XAUUSD zone 3598 - 3600
SL 3595
TP 3603 - 3610 - 3630 - 3660 - OPEN.
Plan 3: SELL XAUUSD zone 3663 - 3665
SL 3668
TP 3660 - 3650 - 3640 - 3630 (small volume).
Wish you a safe, effective and profitable trading day.🌟🌟🌟🌟🌟

Gold Trading Strategy XAUUSD 11/9/2025Gold Trading Strategy XAUUSD 11/9/2025: Gold is stable, traders prepare ahead of important US CPI data, conditions and technical positions to watch.
Fundamental news: Spot gold prices were generally stable in today's Asian trading session, currently around $3630/ounce. Gold prices are in a wait-and-see mode, closely watching the all-time high before the release of US CPI data for August. Weak US PPI inflation data, fueling speculation that the Federal Reserve will continue its easing cycle at its upcoming meeting in September.
Technical analysis: After making the latest ATH at 3675, gold prices are correcting and forming a short-term downtrend channel in the H1 frame, however, the 3620 - 3625 area is still a good support zone for gold prices. Currently, there will be 2 scenarios with the highest probability of occurrence: Case 1: Gold price will form an upward price pattern around the 3620 - 3625 area and increase sharply, we will wait for the reaction when the price meets resistance at 3660 - 3665. Case 2: Gold price continues to follow the downtrend channel to the lower support area of 3595 - 3600 and then increase again. We will trade based on these 2 scenarios and still prioritize trading according to the main trend.
Important price zones today: 3620 - 3625, 3595 - 3600 and 3660 - 3665.
Today's trading trend: BUY.
Recommended orders:
Plan 1: BUY XAUUSD zone 3620 - 3622
SL 3617
TP 3625 - 3635 - 3645 - 3665 - OPEN.
Plan 2: BUY XAUUSD zone 3598 - 3600
SL 3595
TP 3603 - 3610 - 3630 - 3660 - OPEN.
Plan 3: SELL XAUUSD zone 3663 - 3665
SL 3668
TP 3660 - 3650 - 3640 - 3630 (small volume).
Wish you a safe, effective and profitable trading day.🌟🌟🌟🌟🌟
BEARISH TREND After a bullish rally to the 3670's, we noticed a bearish stance in the market resulting in a drainer in the bullish momentum. Gold assumes a minor bearish pullback/retracement.
This bearish path leads to the 3590's just as shown in the analysis or may go below .
Note that this bearish sentiment is short term as we expect a bullish continuation after the bearish retracement.

XAUUSD Analysis – September 11, 2025 (H1 timeframe)Gold continues to respect its bullish structure after breaking out of the ascending channel and is currently unfolding a potential short-term Elliott Wave (3)–(5) pattern. Price is consolidating around $3,630–$3,640 after a corrective pullback.
Technical Outlook
Trendline: The bullish channel remains intact; no breakdown of structure yet.
Key Resistance: $3,685–$3,700 (previous Wave (1) top). A clean breakout above this zone may open the door toward $3,720–$3,740.
Immediate Support: $3,615–$3,605 (Wave (2) low). Holding above keeps the bullish scenario valid; a breakdown may drag price back to $3,585.
EMA 50 & 100 (H1): Both acting as dynamic support, confirming bullish bias.
RSI (H1): Cooling down from overbought, creating fresh upside room.
Fibonacci retracement: Wave (2) corrected neatly around the 38.2% retracement, reinforcing the continuation scenario.
Trading Strategy
Buy zone: $3,615–$3,620, with stop-loss below $3,600.
Take profit 1: $3,685–$3,700.
Take profit 2 (if breakout holds): $3,720–$3,740.
If price breaks below $3,600, step aside and wait for new signals.
The main bias remains bullish. Focus on trading the impulsive waves and watch closely how price reacts at $3,615 support and $3,685 resistance.

GOLD: The Market Is Looking Down! Short!
My dear friends,
Today we will analyse GOLD together☺️
The market is at an inflection zone and price has now reached an area around 3,647.80 where previous reversals or breakouts have occurred.And a price reaction that we are seeing on multiple timeframes here could signal the next move down so we can enter on confirmation, and target the next key level of 3,634.87.Stop-loss is recommended beyond the inflection zone.
❤️Sending you lots of Love and Hugs❤️

Gold | H2 Double Top | GTradingMethodHello Traders 👋
🧐 Market Overview:
I’ll be honest — I’m feeling a little hesitant about entering another Gold trade. The last few setups have gone against my system more than I would like. But trading is always a game of probability — clusters of losses are part of the process.
The key is staying disciplined. Over the long run, probability is in my favour, and that’s why I have to take this trade. My system is flagging a potential double top on the H2 chart, and the so far setup aligns with my rules.
Some of the variables I look for:
- Negative rsi divergence
- decreasing volume on the second top
- Need candle to close in range to take the trade
📊 Trade Plan:
Risk/Reward: 3.7
Entry: 3666
Stop Loss: 3689
Take Profit 1 (50%): 3592
Take Profit 2 (50%): 3565
💡 GTradingMethod Tip:
Even the best systems go through losing streaks. The edge comes not from avoiding them, but from executing consistently and letting probability work itself out over time.
🙏 Thanks for checking out my post!
Make sure to follow me for more setups and share your thoughts — will this H2 double top play out, or does Gold still have momentum to push higher?
📌 Disclaimer:
This is not financial advice. This content is to track my trading journey and for educational purposes only.

Will weakening US labor market signal fuel gold demand?
Gold demand has risen as mounting labor market concerns drive investors toward safe havens. The BLS revised job growth down by 911k over the past year, showing only 847k jobs added versus the previously reported 1.758 mln, far weaker than the 682k consensus, signaling a clear slowdown. JPMorgan CEO Dimon noted deteriorating consumer sentiment and labor market weakness as signs of a softening US economy. However, he added that while the Fed is likely to cut rates, the impact on the broader economy may be limited.
XAUUSD continues its uptrend, consolidating near record highs. The widening gap between both EMAs indicates the potential extension of bullish momentum. If XAUUSD breaches above the resistance at 3650, the price may advance toward the psychological resistance at 3700. Conversely, if XAUUSD breaks below the support at 3580, the price could retreat toward the next support at 3500.

Goldman lays out the case for $5,000 gold – here’s how it happenGoldman Sachs has warned that gold prices could surge to $5000/oz if the Trump administration succeeds in undermining the independence of the U.S. Federal Reserve.
A politicized Fed is seen as likely to cut rates extremely aggressively (Treasury Secretory Scott Bessent and Trump have called for an interest rate of 1.5% and 1.0%, respectively) to stimulate short-term growth, raising the risk of higher inflation.
Such a move could drive investors away from traditional safe havens like the U.S. dollar and government bonds. In a report released this week, Goldman noted that if just 1% of the privately held U.S. Treasury market shifted into gold, prices could rise by about 40% from current levels.

GOLD: Bulls Are Winning! Long!
My dear friends,
Today we will analyse GOLD together☺️
The in-trend continuation seems likely as the current long-term trend appears to be strong, and price is holding above a key level of 3,643.66 So a bullish continuation seems plausible, targeting the next high. We should enter on confirmation, and place a stop-loss beyond the recent swing level.
❤️Sending you lots of Love and Hugs❤️

GOLD Every Rise Has Its Sunset- From 2000 to today, gold has surged by an impressive 1000%, a remarkable performance for the world's leading asset.
- Keep in mind, every ascent is bound to face a descent someday.
- I’ll skip the deep dive into politics and fundamentals, but the picture is clear: with Trump winning the election, peace could make a comeback. Gold typically rises when fears of war spike, but as those fears ease, its value tends to drop.
- As always, the chart tells the story. Take a look at the Fibonacci levels— a prime buying opportunity is likely to emerge in the $1200 to $800 range.
- i will post in comments my older Gold Analysis.
Happy Tr4Ding !

GOLD ROUTE MAP UPDATEHey Everyone,
Another PIPTASTIC day on the charts for us with our 1H chart playing out as analysed with our final target completed today.
After completing 3593, 3613 and then 3638, we stated that we would now look for ema5 cross and lock above 3638 to open 3658. We got the lock and confirmation followed with the target hit - PERFECTION!!
We are now seeing rejection on this level and will use the lower Goldturns for support and bounce. If the range above opens further please review our daily chart and weekly chart updates with higher range levels to continue to track the movement until we update a new 1h chart.
We will continue to buy dips using our support levels taking 20 to 40 pips. As stated before each of our level structures give 20 to 40 pip bounces, which is enough for a nice entry and exit. If you back test the levels we shared every week for the past 24 months, you can see how effectively they were used to trade with or against short/mid term swings and trends.
The swing range give bigger bounces then our weighted levels that's the difference between weighted levels and swing ranges.
BULLISH TARGET
3593 - DONE
EMA5 CROSS AND LOCK ABOVE 3593 WILL OPEN THE FOLLOWING BULLISH TARGETS
3613 - DONE
EMA5 CROSS AND LOCK ABOVE 3613 WILL OPEN THE FOLLOWING BULLISH TARGET
3638 - DONE
EMA5 CROSS AND LOCK ABOVE 3638 WILL OPEN THE FOLLOWING BULLISH TARGET
3658 - DONE
BEARISH TARGETS
3562
EMA5 CROSS AND LOCK BELOW 3562 WILL OPEN THE FOLLOWING BEARISH TARGET
3528
EMA5 CROSS AND LOCK BELOW 3528 WILL OPEN THE SWING RANGE
3492
3470
EMA5 CROSS AND LOCK BELOW 3470 WILL OPEN THE SECONDARY SWING RANGE
3438
3408
As always, we will keep you all updated with regular updates throughout the week and how we manage the active ideas and setups. Thank you all for your likes, comments and follows, we really appreciate it!
Mr Gold
GoldViewFX

Gold – Still One of Wall Street’s Highest Conviction TradesGold – Still One of Wall Street’s Highest Conviction Trades
Almost every major Wall Street bank currently lists long Gold as one of their strongest conviction calls – and the reasoning makes sense. There are three fundamental drivers that continue to support the bullish case:
I. Persistent U.S. Inflation → Gold remains in strong demand as a hedge.
II. Potential Fed Rate Cuts → Likely USD weakness could further lift Gold due to its negative correlation .
III. Reserve Diversification → A gradual shift towards Gold as a USD alternative in global central bank and hedge fund portfolios.
I’m not typically a trend trader, nor do I trade Gold frequently (my focus is mean reversion in FX), but I do find these arguments compelling.
From a tactical perspective, I wouldn’t chase the current highs. Price recently broke out of a triangle formation, and the Williams %R is at levels that historically preceded pullbacks. If I had to establish exposure, I’d prefer to wait for a retracement into the 38.2%–61.8% Fibonacci zone, scaling in gradually with multiple small longs.
To be clear – I don’t see an attractive short setup here. But patience may offer better risk–reward on the long side.
What’s your view? Do you agree with the fundamental case, or do you see a different setup?
Stay safe & happy trading,
Meikel

GBP/USD | Pound at 1.3535 – Watching for Deeper Drop! (READ)By analyzing the GBP/USD chart on the 4-hour timeframe, we can see that the price is trading around 1.3535. If it closes and holds below 1.3553, we can expect more downside.
The possible bearish targets are 1.3513, 1.3480, and 1.3473. The key demand zones are 1.3480–1.3500 and 1.3448–1.3460.
Please support me with your likes and comments to motivate me to share more analysis with you and share your opinion about the possible trend of this chart with me !
Best Regards , Arman Shaban

short goldtrying ICT's CBDR (central bannk dealing range) for the first time in half a decade to see how it goes. short gold

XAU/USD: Momentum Slows After New All-Time High, Correction LikeXAU/USD has reached a new all-time high within its established upward channel, but is now showing signs of price deceleration near the 3,660 resistance zone—a key area where bullish momentum appears to be fading.
The formation of smaller candles in this profit-taking zone signals exhaustion, and a potential rejection at this level could trigger a correction toward 3,590, with a deeper pullback toward 3,470 possible if sellers take control.
Structurally, the market appears to be completing an A-B-C correction from this extended zone, suggesting that a broader retracement phase may be unfolding before any renewed bullish continuation.

Gold | 30min Head and Shoulders | GTradingMethodHello Traders!
There is a potential head and shoulders in the making.
🧐 Market Overview:
One of the key indicators I watch when trading double tops is negative RSI divergence. On the Gold chart, price has been printing higher highs while RSI has been putting in lower highs — a classic sign of weakening buying momentum.
It’s important to note: negative RSI divergence does not guarantee a correction. It’s simply one element within our robust trading system that helps us build higher-probability setups.
📊 Trade Plan:
Risk/Reward: 3.5
Entry: 3655.1
Stop Loss: 3664.7
Take Profit 1 (50%): 3624
Take Profit 2 (50%): 3614
💡 GTradingMethod Tip:
Always remember — divergence is a signal, not a certainty. Use it in confluence with structure, patterns, and risk management for the best results.
🙏 Thanks for checking out my post!
Make sure to follow me to catch the next idea and please share your thoughts — do you think this head and shoulders will play out, or is Gold still too strong?
📌 Disclaimer:
This is not financial advice. This content is to track my trading journey and for educational purposes only.

Silver Pullback Ahead? A Buying Opportunity in the MakingSilver is in an uptrend channel both in the short term and the medium term. Significant bullish pressure is coming from gold, rising technology investment that boosts demand for silver, persistent inflation risks, and the Fed being on the verge of cutting rates. Fundamentally, everything supports silver, and upward pressure is likely to continue.
However, in the short term, upward momentum has started to ease despite the push from gold, which could be an early signal of a small correction. The upward move is still expected to continue, but if the green trendline and the 40.50 support both fail, there is a zone between 39.10 and 40.50 with previous low trading volume that could be filled by a selloff. Such low-volume zones often behave similarly to gaps, though not always.
In either case, silver has stronger potential over the medium term, and any sudden selloffs are likely to remain buying opportunities.
