XAUUSD Intraday Analysis – H1 Chart 12/8Technical Overview:
On the H1 chart, gold (XAUUSD) is trading around 3,346 USD after a decline from the recent high near 3,394 USD. Price is now reacting at the strong support zone 3,340 – 3,335 USD, which previously acted as a key demand area before a bullish breakout.
Key Technical Levels:
Major Support: 3,340 – 3,335 USD (recent low, aligned with prior accumulation zone).
Near-term Resistance: 3,360 – 3,370 USD (short-term supply zone).
Major Resistance: 3,390 – 3,394 USD (previous swing high).
Short-term Structure: Price is showing signs of forming a double bottom around support, with selling pressure slowing down
RSI (if applied) is approaching oversold territory → potential rebound setup.
EMA Outlook: If price holds above 3,340 and reclaims short-term EMAs, a strong bullish recovery could follow.
Trading Strategy Ideas:
Primary Long Setup
Entry: 3,340 – 3,335 USD.
Stop Loss: Below 3,328 USD.
Take Profit 1: 3,360 USD.
Take Profit 2: 3,390 USD.
Alternative Short Setup
Condition: A clean break below 3,335 USD with strong volume.
Stop Loss: Above 3,345 USD.
Target: 3,320 USD.
Outlook:
If the 3,335 USD support holds, gold could stage a rebound toward 3,360 and 3,390 USD. Traders should closely watch price action in this zone for confirmation before entering positions.
Follow for more high-quality trading strategies.
Metals

Is Gold Ready to Break Out from 5-Month Consolidation?Gold has remained in a consolidation phase since April 2025, following its record high of 3500, trading within a narrowing range between 3450 resistance and 3260 support. With tariff-related news easing, price action has softened slightly but continues to hold within the consolidation zone near 3350, awaiting confirmation from the CPI print to either reinforce dollar weakness and rate cut expectations or reverse the current narrative.
Technically, a clean hold above 3400 and 3450 could extend the rally beyond the 3500 record, toward the 3780 level first, and the 4000 checkpoint second.
To the downside, a close below 3260 would open further risk toward 3130 and 2980, potentially offering another long-term accumulation zone.
Written by Razan Hilal, CMT

GOLD (XAU/USD) – 2H Price Action & SMC Outlook# 🟡 GOLD (XAU/USD) – 2H Price Action & SMC Outlook
**Date:** 2025/08/12
**Timeframe:** 2H (Heikin Ashi)
**Style:** Smart Money Concept (SMC) + Fair Value Gap (FVG)
---
## 📊 Market Context
Gold is currently testing the **FVG support area** around **3,349 – 3,350**, with a visible **CHOCH** structure forming on the chart. The reaction from this level will be critical in determining the next directional move.
---
## 📈 Bullish Scenario (Primary)
1. **Condition:**
- Price respects the FVG zone (**3,349.9**)
- CHOCH breaks to the upside
- Clean break and close above **3,401.2**
2. **Expected Move:**
- Retest of the breakout zone for liquidity grab
- Extension towards **3,440** as the main target
3. **Targets:**
- 🎯 TP1: **3,401.2** (break confirmation)
- 🎯 TP2: **3,440** (major resistance & supply)
4. **Invalidation:**
- A close below **3,345** would weaken the bullish case and expose lower demand.
---
## 📉 Bearish Scenario (Alternative)
1. **Condition:**
- Price fails to break **3,401.2**
- Strong rejection from the descending trendline
2. **Expected Move:**
- Return to the FVG zone at **3,349.9**
- If broken, possible continuation towards **3,320 – 3,325**
---
## ⚠️ Analysis Validity
This analysis remains valid while **FVG support holds** and a **bullish CHOCH breakout** occurs.
Failure to hold the FVG could trigger deeper retracements.
---
#XAUUSD #GoldAnalysis #SMC #FVG #CHOCH #TradingView

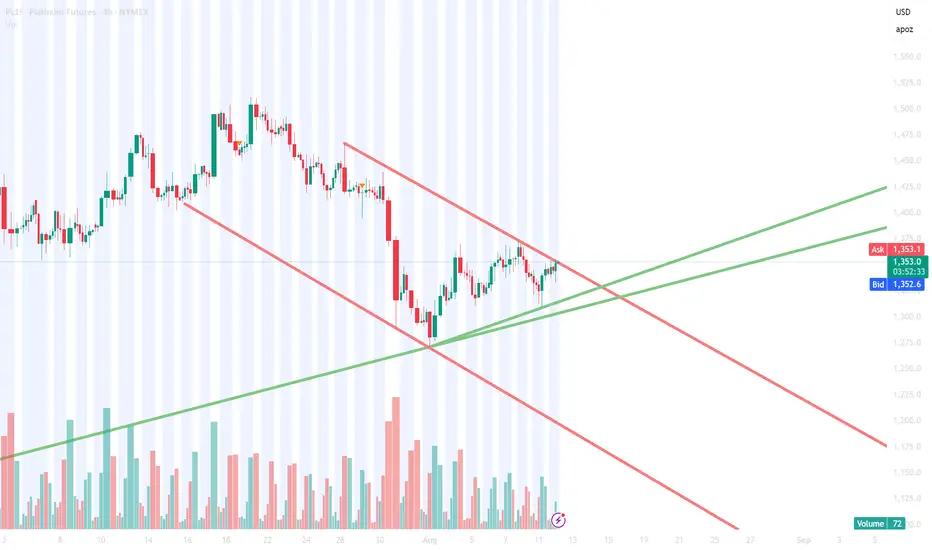
Platinum (PL)Tight stop hoping fo a real break out -Taking a long position in Platinum, anticipating a breakout to the upside from the current channel. Managing the position with a tight stop loss.
XAUUSD Gold Trading Strategy August 12, 2025XAUUSD Gold Trading Strategy August 12, 2025:
Gold prices were under pressure on Monday (August 11) and recovered in the morning trading session today (August 12). US President Trump clearly stated that he would not impose import tariffs on gold, dispelling previous market concerns about disruptions to the global gold supply chain.
Fundamental news: Investors are paying attention to the Federal Reserve's interest rate outlook. Gold is entering a correction phase after tariff concerns are resolved, and price movements may be more influenced by Dollar and inflation data.
Technical analysis: Gold prices continue to correct downwards following the trend from last week, with MA lines still acting as resistance. Currently, the RSI H1 frame is approaching the oversold zone, and there is a high possibility that gold will recover this weekend. Resistance and high liquidity areas such as 3354 - 3359 and 3370 - 3375 will be very good trading areas.
Important price zones today: 3354 - 3359, 3370 - 3375 and 3318 - 3323.
Today's trading trend: SELL.
Recommended orders:
Plan 1: SELL XAUUSD zone 3357 - 3359
SL 3362
TP 3354 - 3344 - 3334 - 3324.
Plan 2: SELL XAUUSD zone 3373 - 3375
SL 3378
TP 3370 - 3360 - 3340 - 3320.
Plan 3: BUY XAUUSD zone 3318 - 3320
SL 3315
TP 3323 - 3333 - 3343 - 3363 (small vol).
Wish you a safe, successful and profitable trading day.🌟🌟🌟🌟🌟

Gold Prices Slide as Geopolitical Calm Sparks Market DivergenceIn a surprising turn of events, gold prices experienced a sharp decline on Monday, reflecting shifting investor sentiment driven by easing geopolitical concerns and evolving market dynamics. The precious metal fell approximately 1.65% overnight, with the current trading price around $3,399 as of this writing. This downtrend marks a significant departure from recent stability, highlighting the complex interplay of global events and market positioning.
Geopolitical Factors and US Dollar Dynamics
The primary catalyst behind the recent slump has been the easing of geopolitical tensions, particularly surrounding the ongoing Ukraine conflict. Investors are increasingly optimistic about the prospects of diplomatic resolution, bolstered by the upcoming US-Russian summit scheduled for Friday. Many market participants believe that this high-level meeting could pave the way for de-escalation and possibly bring an end to the prolonged war, reducing the perceived need for safe-haven assets like gold.
Simultaneously, a surge in US Dollar buying has contributed to gold's decline. As the dollar strengthens, the relative attractiveness of gold diminishes since it is priced in dollars, making it more expensive for holders of other currencies. This dynamic has compounded the downward pressure on gold prices, further amplifying the current bearish momentum.
Market Positioning: Divergence Between Retail and Institutional Traders
A noteworthy aspect of the current market landscape is the divergence observed between different trader groups. Non-commercial traders, often institutional investors and hedge funds, have increased their long positions on gold. This suggests a continued belief in the metal’s potential as a safe haven or a strategic asset. Conversely, retail traders appear to be shifting towards short positions, possibly reacting to the recent price decline or attempting to capitalize on a short-term correction.
This divergence signals a potential imbalance in market sentiment and could hint at an upcoming volatility spike. Typically, such divergences between large institutional positions and retail sentiment can precede significant price movements, either a reversal or a deeper correction.
Technical Outlook and Upcoming Data Releases
Looking ahead, technical analysts are eyeing the possibility of a further spike down in gold prices before any potential rebound. The current trend suggests a bearish movement, but a volatile market environment could see a sharp correction or a "spike down" between today and the end of the week.
Adding to the market's uncertainty are upcoming macroeconomic data releases, notably the Core Consumer Price Index (CPI) month-over-month and the overall CPI figures. These indicators are critical as they influence expectations regarding Federal Reserve policies and can significantly impact dollar strength and precious metals’ prices. A surprise in these data points could either reinforce the bearish trend or trigger a reversal, especially if inflation figures diverge from consensus estimates.
Trading Strategy: Looking for a Long Setup
Despite the current bearish tone, there is a strategic opportunity for traders to position themselves for a potential rebound. Given the divergence and upcoming data releases, many are eyeing a long setup—buying opportunities that could capitalize on a short-term correction or a reversal once market fears subside.
Traders should monitor key support levels around current prices and watch for confirmation signals in price action and volume. A strong bounce or reversal pattern following the release of inflation data could present an ideal entry point for long positions, aligning with the broader view of a potential spike down followed by a recovery.
Conclusion
Gold remains a dynamic asset influenced by geopolitical developments, currency movements, and trader positioning. While the recent decline signals caution, the divergence in trader sentiment and upcoming economic data provide traders with a strategic landscape ripe for potential opportunities. As always, careful analysis and risk management are paramount in navigating these volatile markets.
✅ Please share your thoughts about GC1! in the comments section below and HIT LIKE if you appreciate my analysis. Don't forget to FOLLOW ME; you will help us a lot with this small contribution.

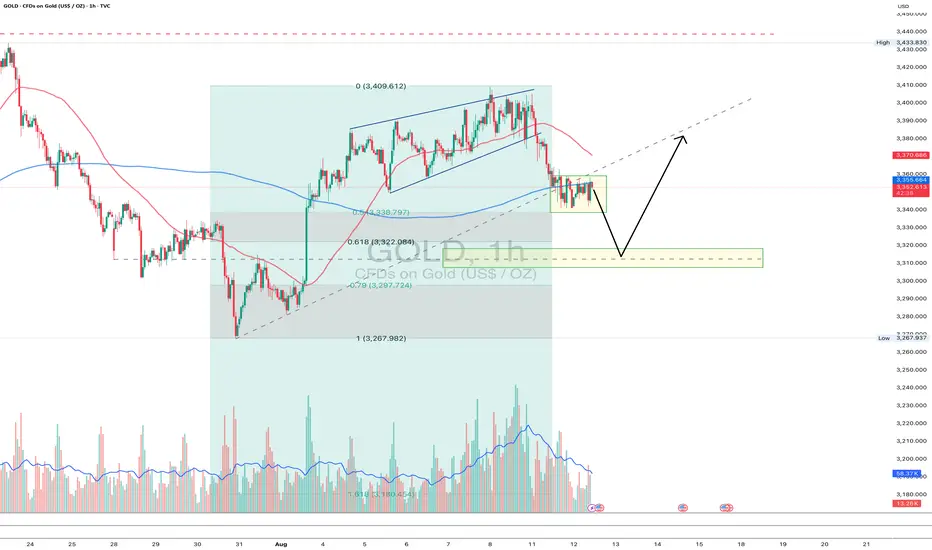
Gold Price Analysis August 12Gold – Testing the strength of the bullish wave structure
Today's session, gold prices are fluctuating in the Fibonacci 0.5 – 0.618 zone, raising the question: is the current uptrend still strong enough to sustain?
Previously, a strong increase from 3282 to 3406 completed wave 3. Currently, the downward pressure at the beginning of the week is considered a correction phase in wave 4.
The 3330 zone plays a "key" role in the bullish wave structure. If this level is broken, the market may end the uptrend and head towards the previous historical highs (ATH).
Trading strategy
BUY when there is a clear buying signal at 3330
BUY when the candle closes above 3357 (Fibonacci 0.618)
🎯 Target: 3383 – beyond 3431

DeGRAM | GOLD rebound from the support line📊 Technical Analysis
● XAUUSD is consolidating within a narrowing wedge, holding above the 3,309–3,320 support zone while repeatedly testing the upper boundary.
● A breakout above 3,366 would confirm bullish momentum toward 3,435, with dips likely finding buyers at mid-channel support.
💡 Fundamental Analysis
● Softer US PPI data and declining Treasury yields have renewed interest in non-yielding assets like gold.
● Rising central bank gold purchases in July strengthen medium-term demand prospects.
✨ Summary
Buy above 3,366; target 3,435. Setup remains valid while holding above 3,309.
-------------------
Share your opinion in the comments and support the idea with a like. Thanks for your support!

XAU USDxau usd we are expecting kind a move according to our analysis.... right now price is ranging on sideways so we will plan accordingly as per direction which we havr marked

Gold 1H - test of 0.618 and possible reversalOn the hourly gold chart, price continues to correct after breaking out of the broadening channel. Current consolidation is forming below the 0.5 Fibo (3338), and the structure suggests a high probability of a drop toward the key 0.618 Fibo support zone at 3322–3310. This level also aligns with a previous major reversal point, adding to its significance. If the market reaches this zone and prints a reversal pattern, technical conditions will be set for a potential bullish move back toward 3370 and higher.
From a fundamental standpoint, gold trades in an environment of uncertainty, with the market assessing the Fed’s monetary policy outlook and reacting to shifts in inflation expectations. The absence of strong USD pressure leaves room for a recovery if large-scale buying appears near 3322.
Tactical plan: watch for price action in the 3322–3310 zone - a confirmed bullish signal could trigger longs targeting 3370 and 3400. A break below 3310 invalidates the bullish setup. As often happens with gold, the most interesting moves start right where most traders run out of patience.
GOLD hesitates, inflation data day in focusOANDA:XAUUSD came under pressure on Monday (August 11) and recovered slightly this morning, Tuesday (August 12). US President Trump made it clear that he would not impose tariffs on gold imports, erasing earlier market concerns about disruptions to the global gold supply chain. Investors are now turning their attention to US inflation data, due to be released this week, to gauge the Federal Reserve's interest rate outlook.
Tariff doubts dissipated
Trump tweeted: "There will be no tariffs on gold!" without providing further details. The announcement brought relief to the global gold market.
As a global gold transit and refining hub, Switzerland was once considered the "biggest victim" but Trump's latest statement essentially eliminated that risk.
Investor focus shifts to inflation
As the tariff uncertainty fades, traders will turn their attention to other market factors, the most important of which is the Federal Reserve's interest rate outlook.
• If US inflation data comes in higher than expected, this could give the Federal Reserve reason to pause its rate cut in September, which would put pressure on gold prices;
• But if the data is mild or even weak, this is expected to support gold prices as market expectations of lower interest rates are further reinforced.
Market Outlook
In the short term, gold is entering a correction phase after tariff concerns are resolved, and price movements may be more influenced by US dollar and inflation data.
If inflation remains low and the US Federal Reserve (Fed) sends a dovish signal, gold prices are expected to maintain high support levels; however, if inflation exceeds expectations and the US dollar strengthens, gold prices may face the risk of a deeper correction.
In the medium to long term, gold remains valuable as a safe haven and an asset allocation channel amid global economic uncertainty and the possibility of low interest rates.
The market expects core CPI to rise to 3.0% year-on-year in July, up from 2.9% in June. The pass-through of tariff costs could spur a rebound in goods inflation.
• If the data beats expectations, the Federal Reserve could delay a rate cut.
• Conversely, a weaker reading would increase the odds of a rate cut in September, with futures currently implying an 87% chance.
Technical Outlook Analysis OANDA:XAUUSD
Gold recovered, operating around the EMA21, showing that the overall market sentiment is still hesitant to wait for a breakthrough impact from the fundamental side.
In the short term, gold is under technical pressure from the EMA21, and the 0.236% Fibonacci retracement level, and for gold to have all the conditions for a continued bullish expectation, it needs to break above the said Fibonacci retracement level, after which the short-term target is the raw price point of 3,400 USD.
If gold continues to break the raw price point of 3,400 USD and operates above this level, the possibility of a new bullish cycle will be opened with the next target at 3,430 USD - 3,450 USD.
On the other hand, gold is still above $3,300, which does not allow the conditions for a bearish cycle to appear. That means as long as gold remains above the original price point of $3,300 and the 0.382% Fibonacci retracement level, it can still increase in the short term.
In case gold sells below $3,300, it will be eligible for a bearish cycle, the target then will be $3,246 in the short term, more than the 0.50% Fibonacci retracement level.
On the momentum front, the RSI hovers around the 50 mark, indicating a hesitant market sentiment, but an upward bend from 50 would be a positive signal for upside potential.
For the day, the overall outlook remains bullish and the key points to watch are listed below.
Support: $3,340 – $3,310 – $3,300
Resistance: $3,371 – $3,400
SELL XAUUSD PRICE 3377 - 3375⚡️
↠↠ Stop Loss 3381
→Take Profit 1 3369
↨
→Take Profit 2 3363
BUY XAUUSD PRICE 3298 - 3300⚡️
↠↠ Stop Loss 3294
→Take Profit 1 3306
↨
→Take Profit 2 3312

Gold prices have been hit hardGold prices have been hit hard, following a sharp rally over the weekend as traders await further clarity from the Trump administration on its gold import tax policy.
The commodity had been exempted from the tax since April, but investors are still waiting for clearer signals on its long-term direction.
Joseph Cavatoni, senior market specialist for North America at the World Gold Council, said that different segments of the gold market are operating stably while waiting for further information.
According to Jim Wyckoff, senior analyst at Kitco Metals, the market rallied last week on the uncertainty surrounding tariffs, but is now seeing a sell-off as investors await more clarity from the White House.
On the economic data front, the US will release the consumer price index (CPI) on Tuesday and the producer price index (PPI) on Thursday. Wyckoff said that inflation data this week is particularly important after the weak jobs report. If the numbers come in higher than expected, the US Federal Reserve (Fed) could pause its interest rate cut plan in September, which would put downward pressure on gold prices.
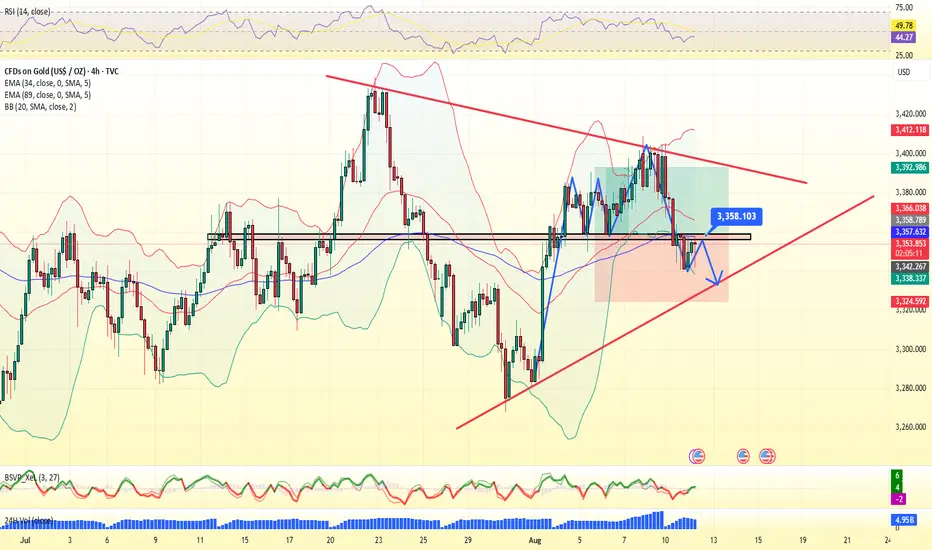
XAUUSD - Drowning in RedHello everyone, what do you think about OANDA:XAUUSD ?
The other day, we discussed the movement of gold within the wedge pattern and the potential for it to test the 3350 USD support before bouncing back. That target was met, however, the sharp and sudden decline caused gold to lose its momentum momentarily.
Yesterday, gold dropped straight from 3398 USD to 3342 USD, a loss of more than 55 USD in less than a single session. The drop on Monday pushed the price of gold below a critical level. Moreover, the oscillators on the chart above are showing a bearish trend, supporting the scenario of further price decline.
The current support level is at 3350 USD, and price movement is following the Dow Theory. However, a convincing break below this level would act as a new trigger for bearish traders, potentially accelerating the decline towards the intermediate support at 3,315 USD, and then heading towards the round figure of 3,300 USD.
Do you think XAUUSD can bounce back from the 3350 USD support level? Feel free to share your thoughts!

Analysis for the CPI News
Good Morning Traders,
Here is my analysis for the CPI News, as you seen the waterfall of gold, price has filled the FVG according to the D1 time frame, there is SSL, the price can hit the SSL and can fly during the news impact, here is our trade entry, Stop loss and Target.
Good Luck Mates!!

Another opportunity to sell gold Market is now ranging in a bearish pennant/ flag and price is expected to breakout and continue selling after making the classic 5 touch in these kinds of patterns

XAU move sideways, awaiting US CPI todayGold prices declined amid the extended US-China tariff truce, yet they remain highly volatile ahead of today's US CPI data.
The market anticipates the July US CPI to rise to 2.8% from May's 2.7%, with Core CPI also expected to increase to 3.0% from 2.9%. Higher inflation could reduce the odds of a Fed rate cut, strengthening the dollar and pressuring gold. Conversely, a larger-than-expected inflation increase could fuel stagflation concerns, potentially supporting gold prices.
Another factor that could support gold is the meeting between US President Trump and Russian President Putin this week in Alaska. A lack of a final agreement to end the war in Ukraine could prompt the US to increase sanctions on Russian goods, which could further exacerbate gold prices.
Technically, XAUUSD is trading in a tight range, holding above the 3345 support level and below its EMAs (21, 78), suggesting a continuation of sideways movement. A breach below 3345 could see the price retest next support at 3285, while a sustained hold above this level could prompt a correction towards the 3402 resistance.
By Van Ha Trinh - Financial Market Strategis at Exness
