SELL XAUUSDIn todays session we are monitoring GOLD for bearish opportunities. Our entry is at 3607, London has made a high above Asia and we expect a drop towards Asia low and 3550 zone. Stops are above 3627.53. Use proper risk management.
Metals

XAUUSD Stable uptrend eyes quick rise to $3695Gold (XAUUSD) has been trading within a short-term Channel Up on the 1H time-frame lately, fueled mainly by its 1H MA20 (red trend-line), with the 1H MA50 (blue trend-line) acting as the last Support.
Right now it is holding the 1H MA20 and as long as it does, we expect it to repeat at least a +1.87% Bullish Leg, similar to the last two. Our immediate Target is $3695.
-------------------------------------------------------------------------------
** Please LIKE 👍, FOLLOW ✅, SHARE 🙌 and COMMENT ✍ if you enjoy this idea! Also share your ideas and charts in the comments section below! This is best way to keep it relevant, support us, keep the content here free and allow the idea to reach as many people as possible. **
-------------------------------------------------------------------------------
💸💸💸💸💸💸
👇 👇 👇 👇 👇 👇

Gold Price (XAUUSD) Intraday Analysis – September 9, 2025On the H4 timeframe, gold has been moving strongly within an uptrend channel, consistently forming higher highs and higher lows. At present, price is testing the key resistance zone around 3660 – 3680 USD/oz, which overlaps with the upper boundary of the ascending channel. This is a critical area where profit-taking pressure may appear, increasing the probability of a corrective pullback.
Technical Breakdown
Main Trend: Short-term bullish, but momentum is weakening near resistance.
EMA 50 & EMA 200: Both EMAs are sloping upward, confirming bullish structure. However, rejection near resistance could trigger a correction back toward dynamic support.
RSI (14): Currently entering overbought territory, signaling potential exhaustion of buyers.
Fibonacci Retracement: Measuring the latest bullish leg, retracement levels to watch are 0.382 = 3540, 0.5 = 3500, and 0.618 = 3460 – all acting as key support zones.
Price Action: Bearish rejection candles or engulfing patterns near 3660 – 3680 will strengthen the case for a pullback.
Key Levels
Resistance: 3660 – 3680
Near-term Support: 3540 – 3500
Deeper Support: 3460 – 3420
Major Long-term Support: 3260 – 3300 (trend reversal zone if broken)
Trading Strategies
Short-term Sell Setup
Entry Zone: 3660 – 3680 if bearish confirmation occurs.
Targets: 3540 – 3500.
Stop Loss: Above 3700.
Buy-the-Dip Setup
Entry Zone: 3500 – 3460 if price retraces into support.
Targets: 3600 – 3660.
Stop Loss: Below 3440.
- Outlook: Gold is likely to face selling pressure around 3660 – 3680, with a corrective move expected before bulls can regain control. Traders should wait for confirmation signals to avoid falling into a “fake breakout” trap, as seen in previous market structures.

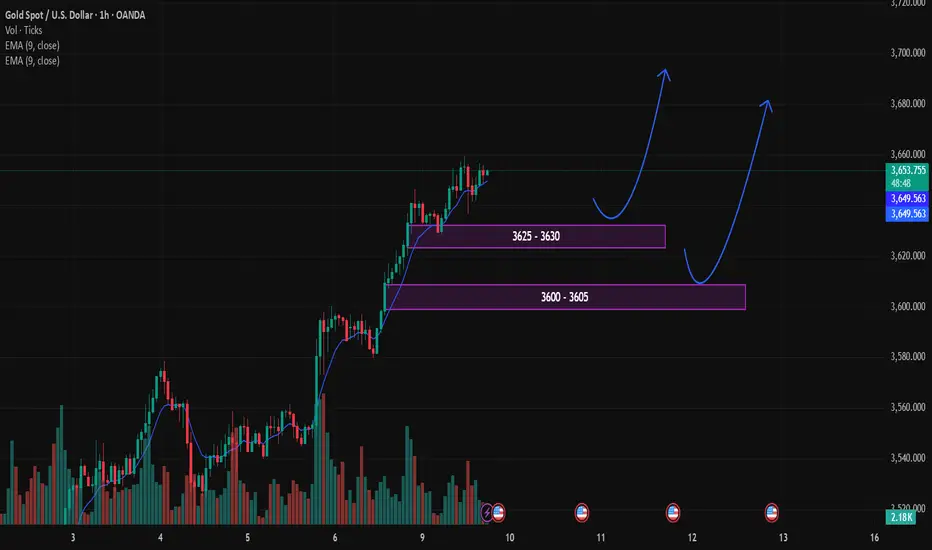
XAUUSD Gold Trading Strategy September 9, 2025XAUUSD Gold Trading Strategy September 9, 2025: Gold continues to rise, renewing its all-time high at $3,660/oz.
Fundamental news: Spot gold prices have surged and surged in the short term during today's Asian trading session (September 9), hitting a new record high of $3,660/ounce and showing no signs of stopping. CME's FedWatch tool shows that traders are now pricing in an 88% chance that the Fed will cut interest rates by 25 basis points this month and a 12% chance of a 50 basis point cut. Before the non-farm payrolls data, the probability of the Fed cutting 50 basis points in September was 0.
Technical analysis: Gold prices continue to rise strongly and show no signs of stopping. Currently, the price is still sticking to the MA20 on the H1 frame, we can trade short in this area. However, the priority will still be the support areas combined with the FVG area. If the gold price continues to increase and stay above the 3600 mark, this week the price may approach 3700 or 3800 with a very high possibility. This strong increase in gold, the areas that can be targeted may be 4300 - 4500.
Important price zones today: 3625 - 3630 and 3600 - 3605.
Today's trading trend: BUY.
Recommended orders:
Plan 1: BUY XAUUSD zone 3625 - 3627
SL 3622
TP 3630 - 3640 - 3660 - 3700.
Plan 2: BUY XAUUSD zone 3600 - 3602
SL 3597
TP 3605 - 3615 - 3650 - 3680 - OPEN.
Wishing you a safe, effective and profitable trading day.🌟🌟🌟🌟🌟
GOLD– Market Outlook
🔼 Bullish Scenario:
• If the price holds above 3635, the upward momentum is expected to continue.
• Target: 3675 (main resistance level).
• If 3675 breaks, the price may rise further and enter the bullish zone.
🔽 Bearish Scenario:
• If the price stabilizes below the retracement level, a temporary correction may start.
• Target: 3595 (strong support).
• If the price breaks below 3595 and closes under it (especially on the 1h or 4h timeframe):
→ The next bearish target will be 3546.
⚠️ However, if 3595 holds and is not broken, the price will likely bounce and resume the bullish trend.
⸻

SILVER Will Go Up! Long!
Here is our detailed technical review for SILVER.
Time Frame: 1h
Current Trend: Bullish
Sentiment: Oversold (based on 7-period RSI)
Forecast: Bullish
The market is on a crucial zone of demand 4,131.3.
The oversold market condition in a combination with key structure gives us a relatively strong bullish signal with goal 4,170.3 level.
P.S
Overbought describes a period of time where there has been a significant and consistent upward move in price over a period of time without much pullback.
Disclosure: I am part of Trade Nation's Influencer program and receive a monthly fee for using their TradingView charts in my analysis.
Like and subscribe and comment my ideas if you enjoy them!

Gold: News Tailwinds, Trend Stays Strong – Target 3,670 → 3,700Hello everyone, let’s analyse OANDA:XAUUSD today.
Current news provides strong support for gold. Expectations of a Fed rate cut remain firm, with notable inflows into gold ETFs over the past month, especially low-cost, long-term strategic funds. Meanwhile, weak Asian macro data (Japan’s GDP, China’s trade) has added to safe-haven demand.
On the 2H chart, the uptrend remains clear: price holds above the rising Ichimoku cloud, with demand FVGs stacked like “steps” below. The recent top sits around 3,645–3,650, while supports are layered at 3,628–3,618, 3,605–3,595, and deeper at 3,580–3,565 (cloud edge).
I lean towards gold consolidating just under 3,650 before breaking towards 3,670–3,685; if momentum holds, price could stretch to 3,700–3,715. This view only weakens if 2H candles close below 3,595 (signalling a dip to 3,580–3,565), and turns negative if 3,565 breaks (risking a slide to 3,540–3,525).
Key drivers to watch are US CPI/PPI and the 10Y yield; continued yield decline would make a break above 3,650 even more convincing.
Do you think gold can reach 3,700? Leave me a comment and let me know!

XAUUSD: Market Analysis and Strategy for September 9thGold Technical Analysis
Daily chart resistance: 3700, support: 3539
Four-hour chart resistance: 3660, support: 3612
One-hour chart resistance: 3660, support: 3630
Spot gold is trading around $3655/oz. Weak US labor market data reinforced expectations of a Federal Reserve rate cut next week, pushing gold prices to a new all-time high of $3646 on Monday. In the short term, gold prices are expected to continue their upward trend to around $3700-3730. The weak US NFP report triggered a continued decline in the US dollar. Market pricing remains strong, with a 92% probability of a September rate cut by the Federal Reserve, and three rate cuts this year. Gold's long-term bullish structure remains intact.
Gold Trading Recommendations: Based on current market analysis, support is focused on the one-hour level at 3630 and the four-hour level at 3612. Maximum support for a pullback is near 3612 in the four-hour level (watch for closing prices). Upward pressure is expected to focus on potential resistance in the 3660-3700 range. The short-term bull-bear divide is near 3630. If the one-hour level stabilizes above this level, continue to buy on dips.
BUY: 3630near
BUY: 3612near
BUY: 3637near

DON'T MISS a potential CRAZY RUN!!! Unfolding RIGHT NOW!!!When I m opening this chart I m always seeing hudge potential and upside.
This, right here, is a key moment in it's development: it either goes crazy or starts ranging some more.
Let's see!
Let me know if, and why, you agree or disagree with this!

SILVER TRADE SETUP CHECK NOW📉 SILVER TRADE IDEA (SILVER )
🔎 Based on technical analysis, I’m watching this Buy zone:
Potential Entry Zone: 41.13 – 41.10
Invalidation Level (Stop Loss): 41.00
Target Zones (TPs):
✔️ TP1 – 41.40
✔️ TP2 – 41.60
✔️ TP3 – 41.70
💡 This is just my personal view based on chart structure & price action. Always manage risk properly.
⚠️ Disclaimer: This is not financial advice. For educational and informational purposes only.

GOLD → As prices continue to rise, so do the risks...FX:XAUUSD continues to rise, setting new highs. New ATH 3659. Focus on current consolidation, as the structure remains bullish...
Gold hit a new record high, surpassing $3,650, amid a weakening dollar and growing expectations of aggressive Fed policy easing. However, overbought conditions and profit-taking risks may limit further growth.
The USD is at 7-week lows due to fears of stagflation and deteriorating employment data. The probability of a rate cut on September 17 is 89.4% (25 bps), with a chance of 50 bps. Markets are expecting more than two cuts in 2024.
Risks for gold: “Sell the fact”: If the NFP revision turns out to be weak (as expected), investors may start to take profits.
Technically, gold remains bullish, but a near-term correction is likely due to technical factors and a possible reaction to the data. The long-term trend remains bullish thanks to a weak USD and the Fed's dovish policy.
Resistance levels: 3657, 3675, 3700
Support levels: 3636, 3628, 3620
Gold is consolidating. At the moment, the fundamental background is stable, and no news is expected today except for those that are impossible to predict (comments, rumors, etc.). Before further growth, gold may test the support area and the liquidity hidden behind it.
Best regards, R. Linda!

GOLD SHORT FROM RESISTANCE
GOLD SIGNAL
Trade Direction: short
Entry Level: 3,648.06
Target Level: 3,604.20
Stop Loss: 3,676.90
RISK PROFILE
Risk level: medium
Suggested risk: 1%
Timeframe: 2h
Disclosure: I am part of Trade Nation's Influencer program and receive a monthly fee for using their TradingView charts in my analysis.
✅LIKE AND COMMENT MY IDEAS✅

GOLD → Strong bullish trend. What are the targets?FX:XAUUSD continues to rally on positive fundamentals that emerged at the end of last week. The market is pricing in an almost 100% cut in interest rates, which is weakening the dollar and supporting the metal...
Gold is holding close to its record high of $3,600 after extremely weak US employment data for August. This has reinforced expectations of a 25 bp Fed rate cut this month.
This week, attention is focused on the release of US inflation data (CPI and PPI). Inflation data in the US will confirm or adjust expectations for Fed policy easing. If inflation remains high, this could delay aggressive rate cuts and cause a correction in gold. For now, the bullish trend continues.
Resistance levels: 3615, 3634, 3650
Support levels: 3600, 3578
Technically, a strong bullish trend. Growth may continue after price consolidation above 3614-3615 or after a slight correction to support at 3600 relative to the current local rally.
Best regards, R. Linda!

Gold | H1 Head and Shoulders | GTradingMethodGood morning Traders 👋
Gold... Could you please give us a head & shoulders to short? 🧐
I’m keeping a close watch here for potential shorting opportunities. An H1 head & shoulders setup would be the first prize.
After such a strong run over the past few days, surely gold owes us a relief rally at some stage...?
What do you think — are we lining up for a short, or does gold have more gas left in the tank?

xauusd buy now 3647 Absolutely, bontas. Here's a clean and professional breakdown of your XAUUSD buy setup for TradingView or any content platform:
🟡 XAUUSD Trade Idea – Buy Setup
- Entry: Buy @ 3647.00
- Stop Loss (SL): 3642.00
- Take Profit 1 (TP1): 3650.80
- Take Profit 2 (TP2): 3653.80
📊 Trade Rationale
- Price is reacting off a minor intraday support zone near 3645, showing bullish momentum.
- Tight SL below recent wick lows protects against false breakouts.
- TP1 aligns with short-term resistance; TP2 targets extended move toward fib extension zone.

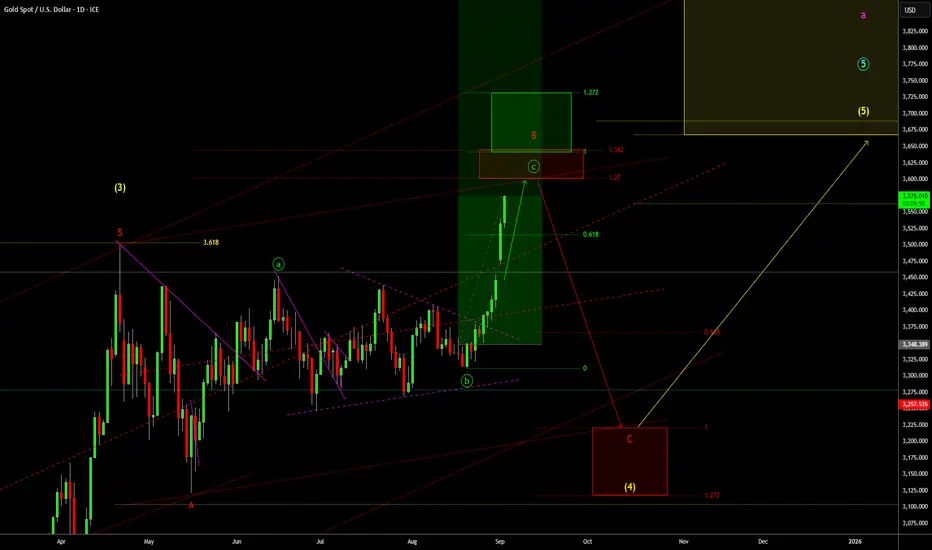
Gold Daily Short Term Outlook - Running Flat CorrectionI will more than happy for TVC:GOLD to blow past this typical running flat correction zone between 3600-3643 and head higher. However if it stalls at this zone and reverses then this is one possibility of how the wave (4) correction could to play out, one that ill be watching closely.
Gold Outlook: Consolidation Before the Next Rally?👋 Hello traders, what’s your view on OANDA:XAUUSD ?
Gold continues to move within a medium-term ascending channel , and the current Rising Wedge pattern shows that buyers are still in control. Recently, price has repeatedly bounced off the lower support trendline, confirming that strong demand is maintaining the uptrend.
At the moment, gold is testing the $3,600 level – both a technical and psychological barrier. I expect some short-term consolidation within this wedge before another push higher.
👉 As long as price holds above key support zones and remains inside the channel, the bullish scenario remains intact. A successful breakout above $3,600 could open the way towards $3,620 – $3,640 , then $3,700 , and if momentum accelerates, even $3,900 in the medium term is on the table.
📌 The primary trend is still bullish . Buyers just need one more catalyst to ignite the next strong wave.
What do you think? Can gold break past $3,600 and move higher? Share your thoughts in the comments!

XAUUSDXAUUSD If the price fails to break above 3664, the short-term price is likely to decline. Consider selling in the red zone (high-risk trade as the main trend of gold is still strong uptrend).
🔥Trading futures, forex, CFDs and stocks carries a risk of loss.
Please consider carefully whether such trading is suitable for you.
>>GooD Luck 😊
❤️ Like and subscribe to never miss a new idea!

Hellena | GOLD (4H): SHORT to support area of 3558.Colleagues, gold is in an active upward impulse of big wave “1” and if until now I was only talking about long positions, now it is time to think about the correction in wave “2”.
Wave “1” (red) consists of five waves and, to all appearances, wave “5” (blue) has either completed or is about to complete.
This means that I expect a corrective movement to the 3558 support area. I believe that this is the minimum retracement level, and the price may reach lower values, but we will work for the result, which we will achieve soon.
Manage your capital correctly and competently! Only enter trades based on reliable patterns!

Gold XAUUSD Intraday Move 09.09.2025Gold at All-Time Highs
Gold is trading at all-time highs with no technical resistance above this level. In such conditions, the most reliable approach is to follow the prevailing trend.
Strategy
Focus on buying retracements/pullbacks.
Always trade with proper risk management and stop-loss placement.
Be prepared for sharp, fast pullbacks that often occur within seconds or minutes during strong rallies.
Note
Discipline and capital protection are key. The market structure favors continuation, but entries should be taken only on retracements with clearly defined risk.

ZGM | CAN GOLD HIT 3755 ? We Are Seeing The Bull Run Month In Gold
So The H1 Timeframe Gold Telling A Very Bullish Market Move Coming In History That Gold Have Create A High Strong Bullish Channel That We Are Expecting Gold That The Gold Are Continuously Bullish

Gold Price Analysis – Bullish Trend Holds Above 3,440Gold is currently respecting its uptrend structure, with the price bouncing strongly from the 3,359 – 3,370 support zone and holding above the black ascending trendline. This shows buyers are actively defending the higher-low structure. Price is now around 3,474, very close to a short-term resistance zone near 3,480 – 3,500. If bulls manage to hold above 3,440 – 3,450, the bullish momentum is expected to continue, potentially pushing price toward the 3,624 extension level, which aligns with the next Fibonacci projection. On the downside, if the price fails to hold the support, it could revisit 3,370 or deeper levels near 3,256 (Fib 0.382).
At this moment, the trend is clearly bullish, as gold is forming higher lows and higher highs while moving along the upward channel.
📊 Key Levels to Watch
- Immediate Resistance: 3,480 – 3,500
- Major Upside Target: 3,624
- Immediate Support: 3,440 – 3,450
- Key Buy Support Zone: 3,359 – 3,370
- Deeper Support (if breakdown): 3,256 – 3,200
Buyers are in control as long as price holds above 3,440 and the ascending trendline.
Buy Zone: 3,445 – 3,454
Buy Trigger: A bounce/rejection from this zone with bullish candles or a confirmed breakout above 3,480 (with strong volume).
Note
Please risk management in trading is a Key so use your money accordingly. If you like the idea then please like and boost. Thank you and Good Luck!

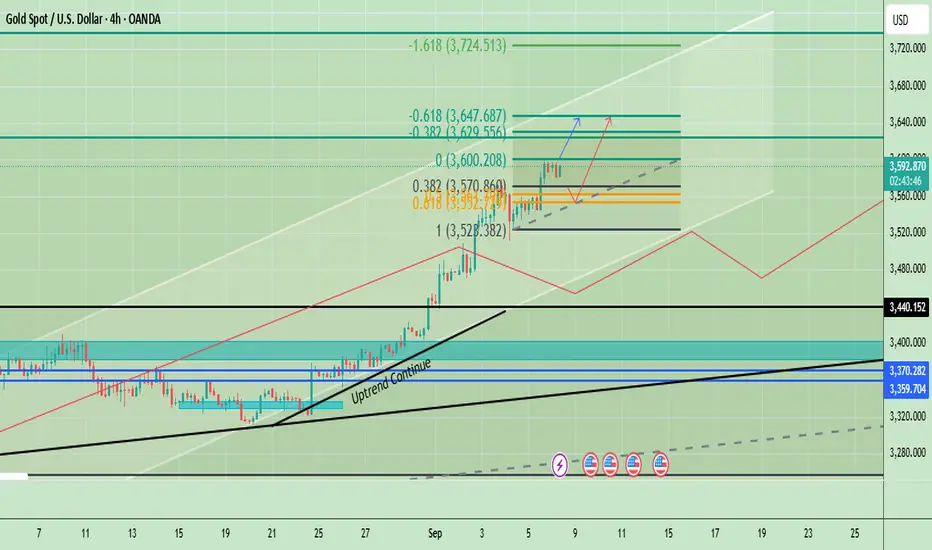
Gold Price Analysis | Fed Rate Cut Hopes & CPI Data in FocusGold is consolidating just below the $3,600 resistance zone, which is a critical pivot. The uptrend structure remains intact, and short-term retracements into the $3,570–$3,552 zone can provide a strong buy opportunity. A decisive break above $3,600 would trigger further bullish momentum toward $3,629, $3,647, and potentially $3,724. On the downside, a daily close below $3,528 would weaken momentum, while a drop under $3,440 would signal trend exhaustion.
Macro fundamentals support this bullish bias: weak U.S. labor data has boosted expectations for Fed rate cuts in September, while the upcoming CPI release on September 11 will be the key event. Softer CPI would confirm easing conditions and strengthen gold’s rally, while a hotter CPI could trigger a short-term pullback into support.
🔑 Key Levels
- Immediate Resistance: $3,600, $3,629 – $3,647
- Support / Buy Zone: $3,570 – $3,552, $3,528 (structural swing low support).
✅ Best Setup:
- Buy Zone: $3,570–$3,552
- Buy Trigger: Bounce from support or breakout above $3,600
- Upside Targets: $3,629 → $3,647 → $3,724
- Invalidation: Below $3,528
Note
Please risk management in trading is a Key so use your money accordingly. If you like the idea then please like and boost. Thank you and Good Luck!