Will gold prices continue to rise on September 8th?
I. Fundamental Analysis
The release of the US non-farm payroll data for August, released on Friday (September 5th), caused a significant market turmoil and provided strong fundamental momentum for gold's rise.
The data was extremely weak: only 22,000 new non-farm payrolls were added, far below the expected 75,000. More notably, the June data was significantly revised downward to -13,000, indicating that the labor market's weakness is not a fluke but rather a trend of stalling. At the same time, the unemployment rate rose to 4.3%, the highest level since 2021, further confirming that the momentum of the US economy is slowing down.
Expectations of a Fed rate cut have sharply increased: Such weak data has significantly strengthened market bets on a Fed rate cut. Currently, the market generally believes a September rate cut is a foregone conclusion, with the probability of a 25 basis point cut approaching 100%, and even discussions of a 50 basis point cut are emerging. This strong expectation of easing is the core driver of gold prices.
Potential Risks and Uncertainties: While the prospect of a rate cut is positive, investors should remain vigilant to potential uncertainties. Inflationary pressures have not yet been fully overcome. If the CPI data released next week unexpectedly rises, it could constrain the Fed's easing efforts. Furthermore, the outlook for the US election and related tariff rhetoric could create new inflationary uncertainties, limiting gold's short-term upside potential.
Fundamental Conclusion: The non-farm payroll data has solidified strong market expectations for a rate cut, creating an overall environment that is extremely bullish for gold. Any weak or dovish economic data would boost gold prices, while an unexpected rebound in inflation could trigger short-term volatility.
II. Technical Analysis
Trend Positioning: Gold is currently in a strong, unilateral upward trend, with the overall technical structure intact and targeting all-time highs.
Key Support (Long-Term Support):
The 5-day moving average has now moved up to the 3545-3550 area. This is the first key support level maintaining the extremely strong short-term trend. As long as gold prices close above this moving average, the upward trend will remain intact. Even if there is a false move to break down this position during the trading session (to lure a short), there is no need to panic as long as the price can be recovered in the end.
4-Hour Bollinger Band Middle Line: Currently moving up to around 3555. This level is the watershed between short-term bullish and bearish strength. If the middle line holds, prices will maintain a relatively strong upward trend. A break below it could trigger a deeper correction, but this will provide a better opportunity to "get on board" for further gains.
Key Resistance:
The upper short-term target resistance level is 3600-3610, a key area to overcome in the near term. A break above will open up further upside potential.
Technical Conclusion: The technical pattern resonates with the fundamentals, indicating a clear bullish trend. Operationally, the key strategy should be to follow the trend, focusing on looking for opportunities to buy at low levels.
III. Trading Strategy for Next Week
Key Strategy: Focus on buying on dips to lows, and be cautious about rallies to higher levels.
Long Strategy (Main Strategy):
Ideal Long Range: 3560-3570. If gold prices pull back into this range and show signs of stabilization (such as a pin bar or bullish engulfing candlestick on the 4-hour chart), this could be considered a good dip-buying opportunity.
Aggressive long position: around 3555 (4-hour middle candlestick). As long as this support holds, it can be considered an entry point during a strong rally.
Stop-loss: Recommended stop-loss: Below key support, around 3540.
Targets: First target: 3600; second target: 3610 or above.
Short strategy (secondary strategy):
Only when gold prices first rebound to the strong resistance zone of 3600-3610 and show clear signs of resistance (such as a long upper shadow or bearish engulfing candlestick), consider a short-term short position with a small position, entering and exiting quickly to capitalize on a technical pullback.
Remember: Shorting against the trend is risky, so strictly control your position size and stop-loss (place the stop-loss above 3615). The core strategy remains to go long with the trend.
Risk Warning: Pay close attention to next week's US CPI data, as its results could trigger a market repricing of the extent of the Fed's interest rate cuts, causing significant gold price fluctuations. Investors are advised to manage their positions prudently and exercise effective risk control.
Metals

XAU/USD | Gold at Record Highs – Can NFP Stop the Rally?By analyzing the gold chart on the 12-hour timeframe, we can see that the price continued its rally today, reaching $3,578 and printing a new all-time high (ATH)! After hitting this level, gold made a slight pullback to $3,510. Right now, the price has bounced back and is trading around $3,550.
So far, there are no clear signs on the higher timeframes that gold is ready to reverse from here. For that, we would need to see stronger bearish moves. The current momentum still supports further upside unless proven otherwise. That’s why it’s better to stay patient and wait for a real break or shift in market structure before looking for attractive trade setups.
Also, tomorrow we have the NFP report, which could trigger a drop in gold if the data comes in stronger than expected. Until then, we’ll wait — and if you guys strongly support this post, I’ll share my updated personal analysis a few hours before the release. Stay tuned!
Please support me with your likes and comments to motivate me to share more analysis with you and share your opinion about the possible trend of this chart with me !
Best Regards , Arman Shaban

XAUUSD SELL NOW 3625🔴 XAUUSD – Short Setup at 3625 | Tactical Bearish Play
Gold (XAUUSD) is currently testing a key resistance level around 3625, where price action has repeatedly shown signs of exhaustion. After a strong bullish leg, the market is now stalling, with momentum indicators flashing early warnings of a potential reversal. This setup offers a clean intraday short opportunity with tight risk and favorable reward.
📌 Trade Parameters
- Entry: 3625
- Stop Loss: 3630 (above resistance wick and intraday high)
- Take Profit: 3610 (near support zone and previous demand area)
- Risk/Reward Ratio: 3:1
📊 Technical Confluence
- Bearish Candlestick Formation: Multiple rejection wicks on 15M and 1H charts
- RSI Divergence: RSI failing to make new highs while price pushes upward
- MACD Histogram: Fading bullish momentum, signaling potential crossover
- Volume Analysis: Decreasing volume on bullish candles, indicating buyer fatigue
- Trendline Resistance: Price reacting to descending trendline from previous swing highs
💬 Trade Narrative
Gold has rallied into a resistance zone but failed to break above 3625 with conviction. The current price structure suggests a short-term correction is likely, especially if price breaks below 3618. This trade is designed for intraday execution, capitalizing on momentum loss and technical rejection. If price breaches 3630 with strength, the setup is invalidated and risk is contained.
Fundamentally, gold remains sensitive to macroeconomic data and interest rate expectations. With mixed signals from global markets and rising yields, short-term volatility favors tactical plays like this one.
📣 Trader’s Note:
Watch for confirmation on lower timeframes before scaling in. If price accelerates below 3615, consider trailing stop to lock in profits. This setup is ideal for disciplined traders who prioritize precision and risk management.

XAUUSD: Market Analysis and Strategy for September 8th.Gold Technical Analysis
Daily chart resistance: 3650, support: 3510
Four-hour chart resistance: 3650, support: 3577
One-hour chart resistance: 3620, support: 3589
Gold News Analysis: Gold entered a bullish consolidation phase during the European session on Monday (September 8th), breaking above 3600 and currently trading around $3616/oz. Last Friday's US NFP employment report showed only 22,000 jobs added in August, significantly below market expectations. Furthermore, revisions to previous data showed a decrease of 13,000 jobs in June, the first monthly decline since December 2020, indicating deteriorating US labor market conditions. The market is currently gauging the magnitude and likelihood of a Federal Reserve rate cut in September. Furthermore, market participants believe the Fed is more likely to cut three times before the end of the year, which is driving gold prices higher. The market now looks forward to the latest US inflation data later this week for fresh momentum.
Gold Trading Recommendations: Based on current market analysis, support is expected to be near the 3589-3600 level on the one-hour chart, with the highest retracement support near 3577 on the four-hour chart. Upward pressure is expected to be near the 3620-50 level. The 3600/3589 level is the short-term dividing line between bulls and bears. If the one-hour chart stabilizes at this level, continue to buy on dips and be bullish.
BUY: 3600near
BUY: 3589near
BUY: 3577near

Gold Hits Record $3,625 – Bulls Eye 3,636/3,650Gold – Overview
Gold surged to a record high at $3,625, following weaker U.S. hiring data that fueled demand for the safe-haven asset. Momentum remains strong, with traders watching if there’s more room to the upside.
Technical Outlook:
📈 Bullish scenario: As long as price trades above 3,612, momentum favors a move toward 3,636. A confirmed stabilization above 3,637 would extend the rally toward 3,650.
📉 Bearish scenario: A confirmed 1H close below 3,612 would trigger a correction, targeting 3,600 → 3,580.
Key Levels:
Pivot: 3,618
Resistance: 3,636 – 3,650
Support: 3,612 – 3,600 – 3,580
Bias: Bullish above 3,612; bearish correction only if price closes below this leve
previous idea:

GOLD (XAUUSD): Updated Support & Resistance Analysis
As a bull run continues on Gold,
here is my updated support and resistance analysis.
Resistance 1: 3645 - 3655 area based on 3650 psychological level
Resistance 2: 3695 - 3705 are based on 3700 psychological level
Support 1: 3559 - 3580 area
Support 2: 3511 - 3520 area
Support 3: 3489 - 3500 area
The price is now heading toward Resistance 1.
It looks like it will be reached soon.
❤️Please, support my work with like, thank you!❤️
I am part of Trade Nation's Influencer program and receive a monthly fee for using their TradingView charts in my analysis.

S&P500 | 100 year bullish channel | GTradingMethodHello Traders - Happy Monday!
I thought this was a very interesting perspective on S&P500.
What they don’t want you to see... 👀
The S&P has been moving inside a bullish channel for nearly 100 years (since 1925).
Right now, price is breaking out of that channel but is it fakeout?
If it’s a fakeout, the implications are huge: we could be looking at a 70% drop back to the bottom of the channel.
⚠️ Chart is on the monthly timeframe with a logarithmic scale.
What do you think — breakout or fakeout? Very keen to hear all your thoughts
#TradingLife

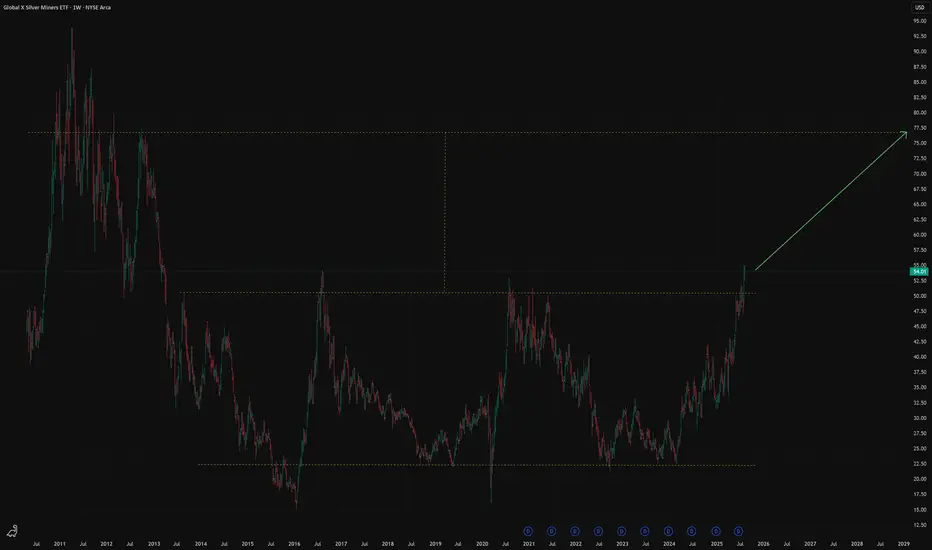
SIL ETF US- Silver Miners Mid Term ideaFollow us and don't miss a next idea on global markets
According to Mining Visuals Silver deficit is expected of 118 million ounces. At the same time strong industrial demand - driven by solar, electronics and green technologies.
Historically, mining stocks outperform the growth rates of the metals themselves. This hypothesis is confirmed by the fact that, starting in 2024, ETF SIL (silver miners) has outperform the metal itself.
From a technical point of view, ETF SIL has emerged from a long-term consolidation and there is a high probability of growth to the $80.
Gold (XAU/USD) –> Two Scenarios Hello guys!
Gold has been moving strongly inside an ascending channel on the 1H chart, showing consistent bullish momentum. Price is currently testing a key resistance area around $3,585 – $3,590. From here, one of two scenarios is most likely to play out:
Scenario 1: A short-term pullback toward $3,563 support, followed by a bounce that could fuel another leg higher. target will be near $3,630 – $3,650.
Scenario 2: A short-term pullback toward $3,580 support, pushing price toward the upper channel resistance near $3,630 – $3,650.
Both scenarios remain bullish as long as gold trades above $3,560. Only a clean break below this level would weaken the structure.
Overall, gold is set for further upside; the path depends on whether we see a retest first or an immediate breakout.
Disclaimer: As part of ThinkMarkets’ Influencer Program, I am sponsored to share and publish their charts in my analysis.

Silver uptrend sideways consolidation supported at 4067The Silver remains in a bullish trend, with recent price action showing signs of a consolidation within the broader uptrend.
Support Zone: 4067 – a key level from previous consolidation. Price is currently testing or approaching this level.
A bullish rebound from 4067 would confirm ongoing upside momentum, with potential targets at:
4181 – initial resistance
4224 – psychological and structural level
4260 – extended resistance on the longer-term chart
Bearish Scenario:
A confirmed break and daily close below 4067 would weaken the bullish outlook and suggest deeper downside risk toward:
4042 – minor support
4014 – stronger support and potential demand zone
Outlook:
Bullish bias remains intact while the Silver holds above 4067. A sustained break below this level could shift momentum to the downside in the short term.
This communication is for informational purposes only and should not be viewed as any form of recommendation as to a particular course of action or as investment advice. It is not intended as an offer or solicitation for the purchase or sale of any financial instrument or as an official confirmation of any transaction. Opinions, estimates and assumptions expressed herein are made as of the date of this communication and are subject to change without notice. This communication has been prepared based upon information, including market prices, data and other information, believed to be reliable; however, Trade Nation does not warrant its completeness or accuracy. All market prices and market data contained in or attached to this communication are indicative and subject to change without notice.

Gold uptrend continuation breakout support at 3573The Gold remains in a bullish trend, with recent price action showing signs of a breakout within the broader uptrend.
Support Zone: 3573 – a key level from previous consolidation. Price is currently testing or approaching this level.
A bullish rebound from 3573 would confirm ongoing upside momentum, with potential targets at:
3645 – initial resistance
3670 – psychological and structural level
3705 – extended resistance on the longer-term chart
Bearish Scenario:
A confirmed break and daily close below 3573 would weaken the bullish outlook and suggest deeper downside risk toward:
3542 – minor support
3510 – stronger support and potential demand zone
Outlook:
Bullish bias remains intact while the Gold holds above 3573. A sustained break below this level could shift momentum to the downside in the short term.
This communication is for informational purposes only and should not be viewed as any form of recommendation as to a particular course of action or as investment advice. It is not intended as an offer or solicitation for the purchase or sale of any financial instrument or as an official confirmation of any transaction. Opinions, estimates and assumptions expressed herein are made as of the date of this communication and are subject to change without notice. This communication has been prepared based upon information, including market prices, data and other information, believed to be reliable; however, Trade Nation does not warrant its completeness or accuracy. All market prices and market data contained in or attached to this communication are indicative and subject to change without notice.

XAUUSD Short: Correction Phase Will ContinueHello, traders! The prior market structure for XAUUSD was a bearish descending channel. This trend was decisively reversed by a bullish initiative from the pivot point low near the demand zone 2, which triggered a breakout and established the current bullish market phase, shifting control to the buyers.
Currently, the price auction is being guided by a well-defined ascending channel. A strong impulse has carried XAUUSD to the upper boundary of this channel, which represents dynamic resistance. The market is now testing this ceiling after a sustained rally, a key area where sellers may emerge to initiate a corrective phase against the dominant uptrend.
The primary scenario anticipates a short-term corrective move from the channel's resistance. The expectation is that the upper boundary will hold, leading to a rejection and a downward rotation back towards the channel's median. A failure to break higher would confirm that a temporary pause in the uptrend is likely. The take-profit is therefore set at 3555 points, targeting an intermediate liquidity level. Manage your risk!

Gold Roadmap | Short termGold ( OANDA:XAUUSD ) created a new All-Time High(ATH) almost every day this week.
How long do you think this upward trend in Gold will continue?
Reasons for Gold's upward trend this week:
Announcement of the US economic indexes.
Geopolitical issues that occurred in the world(China meeting, possible tension between Venezuela and the US, etc.)
Gold is currently moving between the Potential Reversal Zone(PRZ) and the Support zone($3,580-$3,572) .
In terms of Elliott Wave theory , Gold appears to be completing microwave 5 of the main wave 3 .
I expect Gold to start rising again from the Fibonacci levels and touch the Potential Reversal Zone(PRZ) .
Note: If Gold breaks the Support zone($3,580-$3,572) and Support lines, we can expect further declines.
Gold Analyze (XAUUSD), 15-minute time frame.
Be sure to follow the updated ideas.
Do not forget to put a Stop loss for your positions (For every position you want to open).
Please follow your strategy; this is just my idea, and I will gladly see your ideas in this post.
Please do not forget the ✅ ' like ' ✅ button 🙏😊 & Share it with your friends; thanks, and Trade safe.

Silver | H4 Double Top | GTradingMethod
🧐 Market Overview:
All my variables have been met.
Some of the variables I look for are as follows:
- RSI divergence
- Lower volume on top 2 (In this case JOLTS came out, which causes an exception to the volume rule)
- Attack candle closes in range
Opened a short position on Silver.
📊 Trade Plan:
Risk/Reward: 3.9
🎯 Entry: 41.29
🛑 Stop Loss: 41.67
💰 Take Profit 1 (50%): 39.93
💰 Take Profit 2 (50%): 39.34
💡 GTradingMethod Tip:
Sometimes news events (like JOLTS) can disrupt normal volume behavior. That’s why it’s key to use multiple variables together, not rely on just one signal.
🙏 Thanks for checking out my post!
Make sure to follow me to catch the next idea and please share your thoughts — I’d love to hear them.
📌 Please note:
This is not financial advice. This content is to track my trading journey and for educational purposes only.

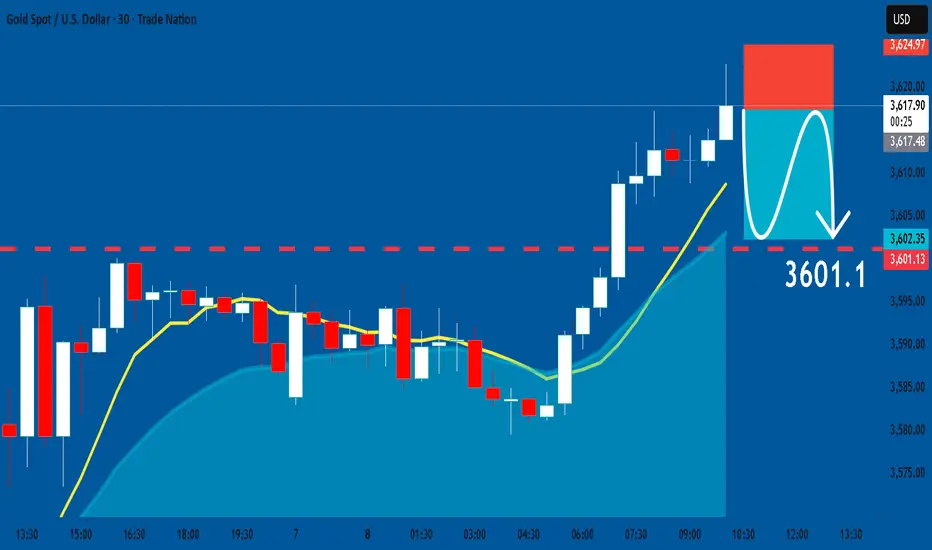
GOLD: Short Signal Explained
GOLD
- Classic bearish formation
- Our team expects pullback
SUGGESTED TRADE:
Swing Trade
Short GOLD
Entry - 3617.4
Sl - 3624.9
Tp -3601.1
Our Risk - 1%
Start protection of your profits from lower levels
Disclosure: I am part of Trade Nation's Influencer program and receive a monthly fee for using their TradingView charts in my analysis.
❤️ Please, support our work with like & comment! ❤️
Gold Price Outlook – Key Levels & Buy TriggerGold (XAUUSD) is holding its bullish structure within the upward channel, currently trading near 3531 after testing key support. The main buy zone lies between 3511–3524, where Fibonacci support and channel trendline align. A confirmed bounce and close above 3537 would trigger fresh buying momentum, targeting 3578, followed by 3619 and 3644. The overall trend remains bullish as long as 3511 holds, while a break below 3470 would weaken the outlook.
🔑 Key Levels to Watch:
- Immediate Support: 3511 – 3524. A strong confluence with the channel support makes this the main buy zone.
- Immediate Resistance: 3537, 3578
- Major Upside Targets: 3619, 3644
Invalidation: 3470 (previous swing low). If broken, the trend may weaken toward 3450.
Buy Zone: 3511 – 3524 (Fibonacci 0.618 & 0.5 retracement + channel support).
Buy Trigger: Bullish rejection or H1 close above 3537 confirming strength for upside continuation.
Note
Please risk management in trading is a Key so use your money accordingly. If you like the idea then please like and boost. Thank you and Good Luck!

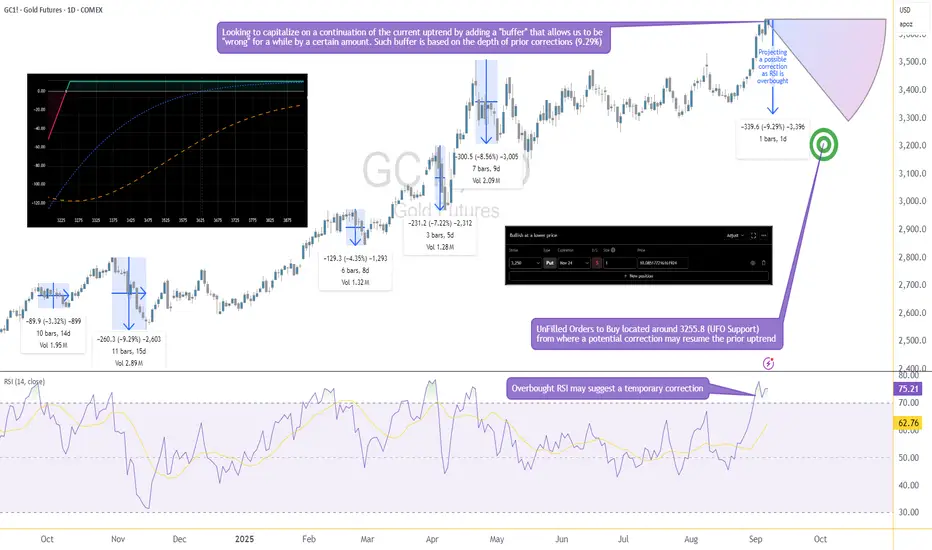
Options Blueprint Series [Basic]: Gold Income or Bargain Entry?The Setup: A Pullback with a Plan
Gold has been riding a strong bullish wave, yet momentum indicators suggest it's time for a breather. RSI is now overbought, and if history repeats, we could see a healthy correction of up to 9.29%, in line with prior pullbacks. This projects price near 3255, where we also find a cluster of UnFilled Orders (UFOs) acting as a potentially relevant support. It’s a key price area where buyers may step in again.
Rather than try to perfectly time the correction or the bottom, we’re applying a more forgiving approach: selling a PUT far below current price—generating income while leaving room to be wrong by over 375 points.
This is not a hedge. This is a standalone income strategy that accepts risk but frames it intelligently using technical context and options structure.
The Strategy: Selling the 3250 PUT on GC
We're using a simple but powerful strategy—selling a naked PUT—which can generate income or result in ownership of Gold at a deep discount if price dips.
Underlying Asset: GCZ2025 – using Gold Futures Options (Nov 24 2025 Expiration)
Strategy: Sell 1x 3250 PUT
Premium Collected: 10.09 points ≈ $1,009
Breakeven Price: 3240
Max Profit: $1,009 (if Gold stays above 3250 until expiration)
Max Risk: Unlimited below breakeven
There are two possible outcomes here:
Gold stays above 3250 → we keep the full premium.
Gold drops below 3250 → we get assigned and become long GC at 3250. From there, we’re exposed to downside risk in Gold, with a breakeven at 3240.
The position benefits from time decay and stable to rising prices, but it does carry the full downside exposure of long Gold futures if the trade moves against us.
We want to be very clear here—this is a naked trade with undefined risk. That doesn’t make it reckless if done with sizing discipline and technical alignment, but it’s not a beginner-friendly strategy.
Gold Contract Specs
Understanding the size and risk of what you're trading is critical—especially with naked options.
✅ GC – Gold Futures (Full Size)
Symbol: GC
Contract Size: 100 troy ounces
Tick Size: 0.10 = $10
Point Value: 1 point = $100
Initial Margin (as of Sep 2025): ~$15,000 per contract (subject to change)
Underlying for the Option: GC Futures
✅ MGC – Micro Gold Futures
Symbol: MGC
Contract Size: 10 troy ounces
Tick Size: 0.10 = $1
Point Value: 1 point = $10
Initial Margin: ~$1,500 per contract (subject to change)
Why does this matter?
Because if GC collapses below 3250 and you're assigned long, you’ll be exposed to full-size futures. That’s $100 per point of movement. A 50-point drop? That's $5,000 in unrealized loss.
That’s where MGC becomes your best ally. Micro Gold futures offer a scalable way to hedge. If price begins moving down or breaks below the support zone, one could short MGC against the Short GC 3250 PUT to cap further losses or rebalance directional exposure with reduced size and margin impact.
The Technical Confluence: Where Structure Meets Strategy
The 3250 strike isn’t just a random number—it’s calculated. Historical RSI-based corrections in Gold have shown recent worse-case scenarios around 9.29%, and projecting that from recent highs lands us precisely near the 3255 zone. This level also aligns with a clear UFO support, where institutional buyers have likely left behind unfilled orders.
That confluence—statistical retracement, technical indicator, and order flow support—gives the 3250 strike an interesting probability structure. Selling a Put beneath it means we are placing our bet below the “floor” and getting paid while we wait.
If Gold never corrects that far, we profit.
If it does, we might get long near a historically meaningful level.
There’s no need to catch the top. There’s no need to nail the bottom.
Just structure the trade where the odds are already potentially skewed in your favor.
Trade Plan: Reward, Risk & Realism
This trade isn’t about precision entry or leveraged glory—it’s about risk-defined logic with a cash-flow twist. Here's the full breakdown:
🧠 Trade Parameters
Strategy: Sell 1x Gold Futures 3250 PUT Options
Premium Collected: 10.09 points = $1,009
Point Value (GC): $100/point
Breakeven Price: 3240 (3250 – 10)
Expiration: Nov 24, 2025
🟩 If Gold Stays Above 3250
You keep the full premium → $1,009 profit
🟥 If Gold Falls Below 3250
You may be assigned 1 GC contra<ct long at 3250
Unrealized losses begin below breakeven (3240)
Losses can be significant if Gold falls aggressively
⚠️ Reward-to-Risk?
Reward is capped at $1,009
Risk is unlimited below breakeven
The trade only makes sense if you're prepared to own Gold, or hedge dynamically via MGC or using any other technique
This isn’t a “set-and-forget” income play—it’s a calculated entry into a structured exposure with a fallback plan.
Risk Management: No Margin for Error
Selling naked options isn’t “free money.” It’s responsibility wrapped in premium. Here's what must be considered:
❗ Undefined Risk
When you sell a naked PUT, you're exposed to the full downside. If Gold drops $100 below your strike, that’s a $10,000 loss. Don’t sell naked options unless you’re ready—and capitalized—to buy the underlying or actively hedge it.
🔄 Use MGC to Hedge
If Gold breaks below 3250, using Micro Gold Futures (MGC) offers a surgical way to hedge risk without overleveraging. A simple short MGC can offset GC losses proportionally, depending on how aggressive the move becomes.
🧮 Precision Matters
Avoid entering trades too early or too large.
Place an “invalidation” point: if price violates the support zone with conviction, reduce or hedge exposure.
Never sell premium just because it’s “high”—sell where structure backs the trade.
📊 Discipline Trumps Direction
This strategy is valid only if risk is respected. The market doesn’t owe anyone consistency—but a structured, risk-controlled approach keeps you in the game long enough to see it.
When charting futures, the data provided could be delayed. Traders working with the ticker symbols discussed in this idea may prefer to use CME Group real-time data plan on TradingView: www.tradingview.com - This consideration is particularly important for shorter-term traders, whereas it may be less critical for those focused on longer-term trading strategies.
General Disclaimer:
The trade ideas presented herein are solely for illustrative purposes forming a part of a case study intended to demonstrate key principles in risk management within the context of the specific market scenarios discussed. These ideas are not to be interpreted as investment recommendations or financial advice. They do not endorse or promote any specific trading strategies, financial products, or services. The information provided is based on data believed to be reliable; however, its accuracy or completeness cannot be guaranteed. Trading in financial markets involves risks, including the potential loss of principal. Each individual should conduct their own research and consult with professional financial advisors before making any investment decisions. The author or publisher of this content bears no responsibility for any actions taken based on the information provided or for any resultant financial or other losses.
Ivanhoe Mines - a 50% discount opportunity !The share price of this mining monster has suffered a 50% price decline in the last 6 months.
One of the main reasons for the share price decline is the suspension of underground operations at the Kakula mine due to seismic activity. This suspension has led to a withdrawal of production and cost guidance for 2025, causing investor uncertainty and a subsequent drop in share price 1,2,3 Additionally, the company has faced challenges with its smelter, including a fire that damaged onsite generators and caused a three-month delay in commissioning. These issues, combined with power constraints and grid instability in the Democratic Republic of Congo (DRC), have contributed to a more conservative production outlook.
However there are lots of positive catalysts for Ivanhoe Mines: the upcoming rise in precious metal prices, especially the wake up of the severely undervalued PLATINUM prices.
Platreef PGM project in South Africa contains 7 million ounces of gold (0.25 gpt) and 50 million ounces of AuEq. About 90% of annual production (1 million ounces) will consist of PGMs (platinum group metals), making it the largest PGM mine in the world ! Platreef is expected to have low all-in production costs, though more precise figures will become available after the ramp-up phase, scheduled for the second half of 2025.
Platreef PGM, Kakula-Kamoa (massive copper mine, the largest high grade mine globally) and Kipushi (a high-grade zinc operation); With all three of their mines expected to be in production, 2025 could be a pivotal year for them.
Chart wise, the price is still rising in a long term rising wedge. Price just found support on the lower resistance and is bouncing strongly. OBV on balance volume is still on a steady rise. I own Ivanhoe Mines since I got in at sub 1$ (thanks to Rick Rule's reccomandation - God may bless him). and I am not willing to let go before we reach 50$, which is my long term target.

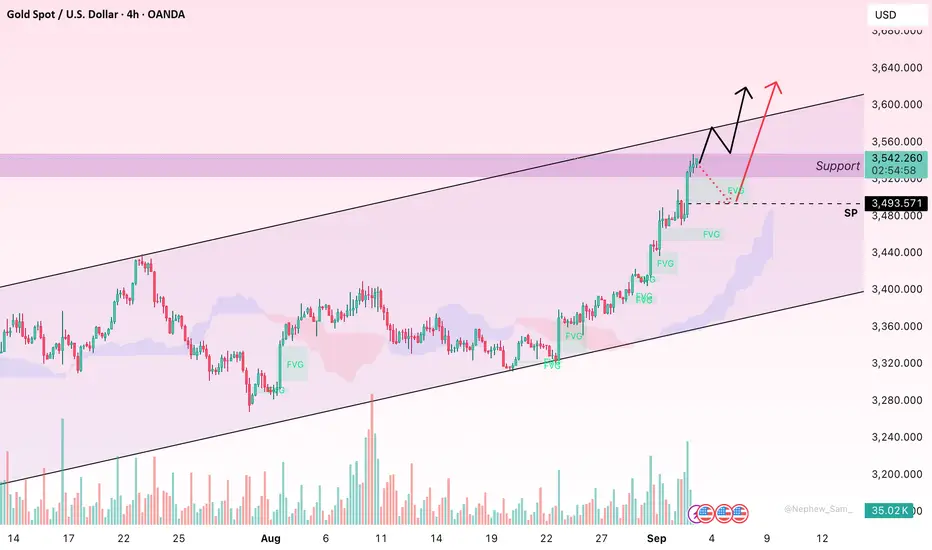
Gold Breaks New Highs, Momentum Still Favouring BullsHello friends, the past week has been quite rewarding for gold as it surged through major resistance levels and printed fresh highs. On the H4 chart, the trend looks very clear: price action is holding firmly above the Ichimoku cloud, with Tenkan sitting comfortably above Kijun, and the cloud slope widening further. Multiple Fair Value Gaps (FVGs) remain unfilled below, showing that buying momentum is powerful and liquidity is being left behind — a signature of a strong rally, not just a short-term move.
In terms of price action, the immediate resistance lies between $3,535–3,560. A clean H4 close above this area may unlock the next natural expansion towards $3,580–3,600. On the downside, layered supports are found at $3,520–3,505, then $3,485–3,470, and deeper at $3,440–3,420, coinciding with the upper edge of the cloud, often tested during medium-term uptrends.
Fundamentally, the environment still favours buyers: safe-haven demand is rising, the Fed is expected to ease policy sooner, and the USD is weakening, all adding fuel to the bullish case. Unless gold closes back into the cloud and loses the $3,440–3,420 zone, the probability of trend continuation remains high.
Do you think gold can stretch further from here? Share your thoughts below!
XAUUSD Overextended: Waiting for Retrace & BoS Before LongsAt the moment, Gold is in a very strong bullish trend 🟢📈, pushing into all-time highs 🏆. However, price is now trading in an area of very thin liquidity 💧⚠️, which carries the risk of a potential pullback 🔻 as smart money 💼 looks to tap into liquidity pools from previous levels to position long.
🔎 In the video, we break down:
Price action 📊
Market structure 🧩
Some Wyckoff concepts 📚
My thoughts on trading when the market is overextended 🚀⚠️
💡 Remember: we don’t want to buy at a premium ❌💰. The better play is to wait for a meaningful pullback ⏳ and a market structure break 🔓 before looking for long opportunities.
⚠️ This analysis is educational and not financial advice. 📚

Gold. Bull Trap "triangle". 28/July/25XAUUSD, by checking gold latest speed of chart with its cycle. we might have a bull 'trap" triangle. A base for rallying to ATH again before a very deep pullback toward 233 Daily EMA which have not been "touched" for long time...

Gold 1H – Smart Money Plays Below 3,600Gold on the 1H timeframe is consolidating near 3,600 after sweeping short-term liquidity. Price is currently building imbalance around intraday highs, while demand sits lower at 3,565. This structure suggests engineered moves to trap both buyers and sellers before the next expansion.
________________________________________
📌 Key Structure & Liquidity Zones (1H):
• 🔼 Buy Zone 3,565 – 3,563 (SL 3,560): Discount demand block, aligned with bullish order flow.
• 📍 Scalp Sell Zone 3,594 – 3,596 (SL 3,601): Intraday rejection pocket; scalp opportunity.
• 🔽 Sell Zone 3,630 – 3,628 (SL 3,637): Premium supply zone, ideal for liquidity sweep reaction.
________________________________________
📊 Trading Ideas (Scenario-Based):
🔺 Buy Setup – Demand Block Reaction
• Entry: 3,565 – 3,563
• Stop Loss: 3,560
• Take Profits:
o TP1: 3,585
o TP2: 3,595
o TP3: 3,600+
👉 Expect liquidity sweep into discount demand before resuming bullish trend.
🔻 Sell Scalp Setup – Intraday Reaction
• Entry: 3,594 – 3,596
• Stop Loss: 3,601
• Take Profits:
o TP1: 3,592
o TP2: 3,590
o TP3: 3,585 → 3580 → 3570 → 3560
👉 Short-term liquidity pocket; scalp only with strict risk control.
🔻 Sell Setup – Premium Rejection
• Entry: 3,630 – 3,628
• Stop Loss: 3,637
• Take Profits:
o TP1: 3,610
o TP2: 3,600
o TP3: 3,590
👉 Targeting liquidity resting below intraday lows; best for quick shorts.
________________________________________
🔑 Strategy Note
Overall bias remains bullish, but smart money may engineer a sweep of 3,626 supply before driving price back into 3,565 demand. Cleaner setup is to buy dips, while sell scalps remain short-lived opportunities.

XAGUSD Overextended: Watching 40.50 NecklineIn the past months I argued that Silver should rise and reach 40, and the market not only achieved that but even exceeded the level, printing a high at 41.50.
However, just like Gold, this move looks overextended and vulnerable to correction.
📌 Technically, price has tapped 41.50 twice. While it cannot yet be called a confirmed double top, the possibility exists. The neckline of this potential pattern is at 40.50.
• A break below 40.50 could trigger a deeper correction.
• First target: under 40, toward the 39 technical support zone.
🔑 Trading Plan: I remain cautious at these levels.
If 40.50 gives way, I will look for shorts targeting the 39 area. Counter-trend trades carry very high risk, but the setup is worth monitoring. 🚀
