New Week on Gold and we could continue strong!Im looking for price to give more indication on what it wants to do but we are bullish until proven otherwise. for now its is not in a position that I would like to enter cause it can go either way. All moves are scalps untill we get some more breaks on levels.
Metals

Gold XAUUSD Intraday Analysis – September 8, 2025On the H1 timeframe, Gold (XAUUSD) continues to trade within a strong bullish structure. After forming a bullish flag pattern, price successfully broke out and extended toward the resistance zone at 3,585 – 3,590 USD/oz, where sellers stepped in to lock profits, leading to the current pullback.
Technical Outlook
Trendline & Price Structure
The dominant bias remains uptrend, confirmed by higher highs and higher lows.
The rising trendline from the 3,480 region is still intact, supporting bullish momentum.
Fibonacci Retracement
Measuring the breakout leg from 3,540 → 3,590:
Fibo 0.382 ≈ 3,570 USD → first support zone.
Fibo 0.618 ≈ 3,555 USD → stronger support.
EMA & Momentum
EMA20 and EMA50 on H1 are sloping upward, showing continuation bias.
RSI has cooled down from overbought, suggesting potential consolidation before another move higher.
Key Levels
Resistance: 3,585 – 3,590 (local top), extended to 3,610 – 3,620.
Support: 3,570 (Fibo 0.382), 3,555 (Fibo 0.618), extended to 3,540 (trendline confluence).
Trading Strategies
Buy on dip (trend-following):
Look for entries around 3,555 – 3,570.
Stop loss: below 3,540.
Targets: 3,590 – 3,610, extended toward 3,620.
Short-term Sell (counter-trend):
If price rejects strongly at 3,590, scalpers may consider a pullback trade toward 3,570 – 3,555.
Note: Counter-trend setups carry higher risk, use tight stops.
Conclusion: Gold remains in an intraday bullish trend. Current pullback is likely a healthy retest before buyers regain control toward the 3,600+ zone. Best setups remain buying dips at key support zones with proper risk management.
👉 Follow this analysis for more daily Gold trading strategies, and save it if you find it helpful.

GOLD hits $3,600 target, market focuses on CPIOANDA:XAUUSD continued to surge, hitting a record high of $3,600/ounce on Friday, following unusually weak U.S. non-farm payrolls data. The market now believes there is a 10% chance the Federal Reserve will cut interest rates by 50 basis points in September, leaving investors wary of the risk of a significant rate cut at this meeting.
The Federal Reserve is likely to cut interest rates by 50 basis points in September
According to the CME's "Fed Watch" tool, the probability of the Fed keeping interest rates unchanged in September is 0, the probability of cutting interest rates by 25 basis points is 88.3%, and the probability of cutting interest rates by 50 basis points is 11.7% (the probability was 0 before the release of non-farm payrolls data).
OANDA:XAUUSD is currently hitting new highs as bulls see a significant slowdown in employment as a sign of more rate cuts. The outlook for gold remains bullish as employment concerns continue to outweigh inflation in the short to medium term.
OANDA:XAUUSD is up 37% this year, driven largely by a weaker dollar, central bank buying, dovish monetary policy and rising geopolitical and economic uncertainty.
Gold itself does not generate interest, but it does well in low- or high-uncertainty environments, making it a safe haven for investors’ money.
The outlook for gold is positive as the Federal Reserve’s independence is under threat following Trump’s attempt to fire Fed Governor Tim Cook, weakening the dollar and boosting investor appetite for the precious metal. Gold traders are focused on next week’s US Consumer Price Index (CPI) data. If inflation continues to decline, that would strengthen the case for a rate cut at the September 16-17 meeting.
Technical Outlook Analysis OANDA:XAUUSD
First, gold has achieved the $3,600 price target and a new all-time high.
Currently, the technical conditions and technical positions are all bullish, with a short-term directional bullish channel and major support from the EMA21. Meanwhile, the Relative Strength Index (RSI) has not provided any signals of a possible correction in momentum, even though it has been operating in the overbought zone (80 to 100) for some time.
In the short term, gold may retest the all-time high, then target around $3,613 in the short term, which is the price point of the 0.382% Fibonacci extension. And the nearest support is noted at $3,574, which is the price point of the 0.236% Fibonacci extension.
As long as gold remains above $3,550, it is not in a position to correct lower, and any dips due to profit-taking should be considered as a short-term move rather than a trend.
Finally, the overall trend of gold is bullish, and the notable points will also be listed as follows.
Support: $3,574 – $3,550
Resistance: $3,600 – $3,613
SELL XAUUSD PRICE 3607 - 3605⚡️
↠↠ Stop Loss 3611
→Take Profit 1 3599
↨
→Take Profit 2 3593
BUY XAUUSD PRICE 3548 - 3550⚡️
↠↠ Stop Loss 3544
→Take Profit 1 3556
↨
→Take Profit 2 3562

SILVER SELLERS WILL DOMINATE THE MARKET|SHORT
SILVER SIGNAL
Trade Direction: short
Entry Level: 4,066.6
Target Level: 3,923.7
Stop Loss: 4,160.4
RISK PROFILE
Risk level: medium
Suggested risk: 1%
Timeframe: 12h
Disclosure: I am part of Trade Nation's Influencer program and receive a monthly fee for using their TradingView charts in my analysis.
✅LIKE AND COMMENT MY IDEAS✅

Gold: Rally Holds After Weak NFP ShockHello everyone, the latest NFP report came in far below expectations (+22k jobs, unemployment at 4.3%), sending USD and yields sharply lower. Gold instantly broke higher, touching the 3,600 mark – a fresh all-time high. Markets now price in a Fed rate cut in September with strong conviction, fueling safe-haven demand.
On the H4 charts, the bullish setup looks intact: price remains above the Ichimoku cloud with stacked demand FVGs supporting below. The 3,595–3,600 area is the key pivot; a clean breakout would unlock 3,615–3,630 and potentially 3,650. Closest supports sit at 3,575–3,565 and 3,555–3,548, while only a daily close under 3,515 would signal weakness.
My bias favors a shallow pullback before continuation, as Fed easing expectations remain the main driver. As long as gold stays above 3,555–3,548, the path toward 3,600+ remains open.
What’s your outlook—do you expect new highs soon?

XAUUSD - Daily | The breakout is REALSimple trading - Triangle pattern
Gold is back to making All-Time highs. Reaching as high as 3600. You can see the breakout was fast and instant. In less than 2 weeks, gold managed to move the price over 1500 pips.
The target of the triangle breakout is nearly reached. Roughly 3675.
Gold has already tested support that was previously a bullish daily FVG. With clean rejection, we see the price remaining bullish.

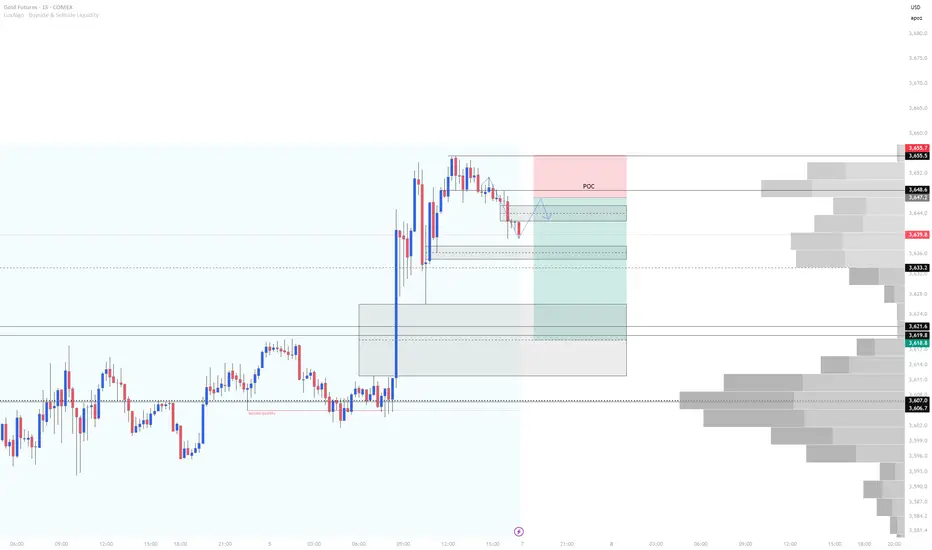
Gold Futures Short Into Asia 9/7/25Based on the current Fair Value Gap (FVG), Order Block (OB), and the liquidity resting below, I anticipate gold will retrace toward the Point of Control (POC) identified on the volume profile. This would provide an ideal setup for short-term selling opportunities during tonight’s PM session.
My expectation is for price to open lower, push into the 3658 range, and present a bearish entry signal. From there, I’ll be targeting shorts toward the equilibrium of the FVG around 3619, which also aligns closely with previous session highs and lows—adding confluence to the setup.
Gold 30Min Engaged ( Buy And sell Reversal Entry Detected )Time Frame: 30-Minute Warfare
Entry Protocol: Only after volume-verified breakout
🩸Bearish Reversal : 3557
🩸Bullish Reversal : 3484
➗ Hanzo Protocol: Volume-Tiered Entry Authority
➕ Zone Activated: Dynamic market pressure detected.
The level isn’t just price — it’s a memory of where they moved size.
Volume is rising beneath the surface — not noise, but preparation.
🔥 Tactical Note:
We wait for the energy signature — when volume betrays intention.
The trap gets set. The weak follow. We execute.
BRIEFING Week #36 : Oil Prices Diverge from RealityHere's your weekly update ! Brought to you each weekend with years of track-record history..
Don't forget to hit the like/follow button if you feel like this post deserves it ;)
That's the best way to support me and help pushing this content to other users.
Kindly,
Phil

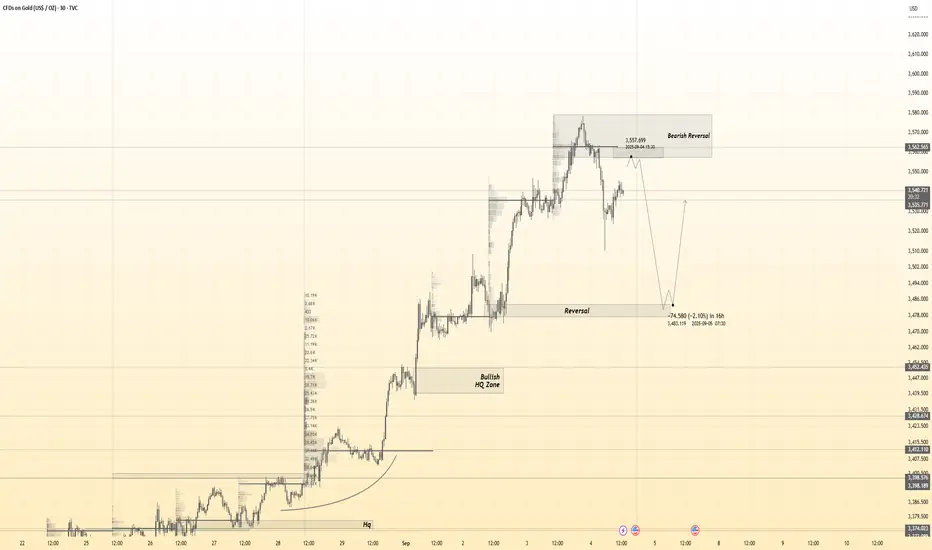
Gold Rally at Its Peak – Correction on the Horizon?Gold Rally at Its Peak – Correction on the Horizon?
Gold (XAUUSD) Technical–Fundamental Market Report
Over the past weeks, gold has shown a significant transition in market structure. After a prolonged distribution and corrective phase through late July into mid-August, price action shifted decisively into a strong bullish cycle. The early downtrend was marked by repeated breaks of structure to the downside, reflecting selling pressure and controlled liquidity grabs.
From late August onward, gold transitioned into accumulation, where price consolidated, absorbed liquidity, and built momentum. This was followed by a clear breakout phase, marked by multiple bullish break-of-structure signals. The market demonstrated aggressive upward expansion, driven by momentum and strong order flow, suggesting institutional positioning.
Fundamentally, this aligns with the current macro backdrop: gold often gains strength when investors anticipate monetary policy easing, inflationary risks, or geopolitical tensions. The consistent bullish run reflects a flight-to-safety narrative, supported by capital inflows.
Currently, price action shows extended bullish movement nearing exhaustion, with signs of potential short-term corrective pressure. The dotted projection suggests a retracement phase could be expected after testing higher liquidity zones, a natural reaction to overextended momentum.

XAUUSDGold remains in a strong uptrend. Last Friday, the release of the non-farm payrolls figures, which were lower than expected, and a weaker dollar, pushed gold prices higher, reaching an all-time high of $3,600.
Gold Direction: On Monday, as the gold price is currently facing no resistance, it appears to be trading very high. The RSI indicator is in the "overbought" zone, which could lead to short-term selling pressure.
Main scenario: At the price zone of 3599$-3613$, if the gold price cannot break above the level of 3613$, there is a possibility of a short-term price drop, consider selling the red zone.
(Very Risky Trade)
🔥Trading futures, forex, CFDs and stocks carries a risk of loss.
Please consider carefully whether such trading is suitable for you.
>>GooD Luck 😊
❤️ Like and subscribe to never miss a new idea!

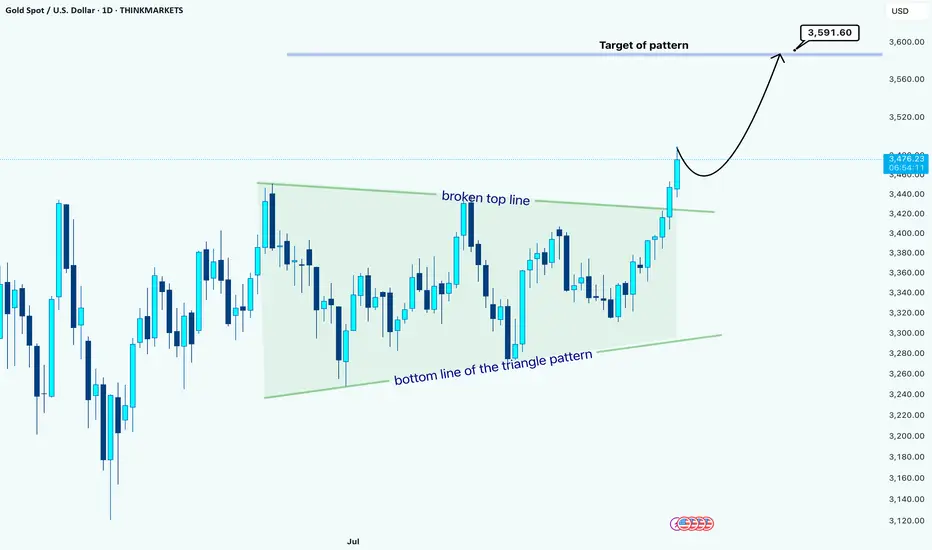
Gold Daily Chart Analysis –> Triangle BreakoutHello guys!
Gold has finally broken out of a large triangle consolidation pattern that has been building for weeks. The price action respected both the top resistance line and the bottom support line multiple times, showing clear compression before the breakout.
🚀 Recently, the price broke above the top line of the triangle, confirming a bullish breakout. This kind of move usually signals the start of a continuation phase with momentum in the direction of the breakout.
Based on the measured move from the triangle formation, the projected target sits around 3,591.60 USD. Price is currently trading near 3,476 USD, which still leaves room for further upside.
💡 Typically, after such a breakout, the market may retest the broken resistance line (now turned support) before resuming its move higher. (but the pullback is not certain now)
Summary:
Pattern: Symmetrical Triangle
Breakout Direction: Bullish
Current Price: 3,476 USD
Target: 3,591.60 USD
As long as Gold holds above the broken triangle resistance, the bias remains bullish toward the projected target.
Disclaimer: As part of ThinkMarkets’ Influencer Program, I am sponsored to share and publish their charts in my analysis.
GOLD MARKET ANALYSIS AND COMMENTARY - [Sep 08 - Sep 12]This week, the international OANDA:XAUUSD price increased sharply, from 3,436 USD/oz to 3,600 USD/oz and closed the week at 3,586 USD/oz. The reason for the sharp increase in gold price this week is due to the conflict between the Trump administration and the FED increasing when Mr. Trump announced the dismissal of FED Governor Lisa Cook. Previously, Mr. Trump repeatedly attacked FED Chairman Jerome Powell for not reducing interest rates and also threatened to fire Mr. Powell.
In addition, the US non-farm payrolls (NFP) report for August dealt a further blow to the already weak job market, as employers added just 22,000 jobs, far below economists' forecasts of 75,000. The dismal figure followed an equally worrying July report of 73,000 new jobs, while revisions reduced the number by 258,000 jobs from the previous two months. Meanwhile, the unemployment rate rose to 4.3%.
The worsening jobs picture has reinforced expectations that the Fed will cut interest rates at its meeting on September 16-17. Market participants now see a 0.25% rate cut as a near certainty, with some economists even suggesting the Fed could cut rates by as much as 0.5%.
Next week, the US will release two important inflation figures, CPI and PPI. If the monthly core CPI increases by 0.5% or more, it may cause investors to reassess the probability of multiple rate cuts by the FED this year. This will support the USD, which will be detrimental to gold prices next week. On the contrary, if the core CPI increases by only 0.3%, it may cause the USD to fall, supporting gold prices to continue to rise next week.
📌Technically, on the H4 chart, if the gold price maintains its uptrend, it will move up to the next resistance level determined at the Fibonacci extension Fibo261.8 level around the threshold of 3,680 USD/oz. In case of a correction, the support level should be noted around the hard resistance level as well as the dynamic resistance level at the area of 3,450 USD/oz.
Notable technical levels are listed below.
Support: 3,574 – 3,550USD
Resistance: 3,600 – 3,613USD
SELL XAUUSD PRICE 3681 - 3679⚡️
↠↠ Stop Loss 3685
BUY XAUUSD PRICE 3449 - 3451⚡️
↠↠ Stop Loss 3445

H1 XAUUSD Weekly Outlook – Full Map (Sep 8–12, 2025)Hello traders, gold trades around 3585–3600. The H1 chart now gives us the full structural map: all supply levels stacked above price, and all demand levels layered below. This is the tactical roadmap for the week 👇
🔑 H1 Structural Supply Zones (Upside Resistance)
Immediate Supply (3618–3628)
H1 OB + bearish FVG
Liquidity above Friday’s wick
Fib 127% extension
Primary Supply (3668–3678)
Refined H4 supply
Fib 161.8% extension
Gap inefficiency
Extended Supply (3725–3735)
Next liquidity pocket
H1 imbalance zone inside rally
Target only if CPI fuels expansion
Extreme Supply (3790–3805)
HTF fib 200% extension
Last clean H1 OB before weekly resistance cluster
🔑 H1 Structural Demand Zones (Downside Support)
Immediate Demand (3562–3552)
H1 OB + EMA21
Fib 61.8% retracement
Gap-fill from breakout
Primary Demand (3528–3515)
OB + EMA50 support
Unfilled FVG
Fib 78.6% retracement
Secondary Demand (3488–3475)
Previous accumulation base
Micro OB + gap imbalance
Aligned with EMA100
Deep Demand (3445–3430)
Institutional block
Strong HTF liquidity pool
Only tested on aggressive USD rally
📌 Scenarios
Bullish Path 🟢
Hold Immediate Demand (3562–3552) → retest 3618–3628.
Break above this → continuation toward 3668–3678.
If macro stays supportive, 3725–3735 may unlock later.
Bearish Path 🔴
Rejection at 3618–3628 sends gold back to 3562–3552.
Losing this opens 3528–3515, then deeper 3488–3475.
Strong CPI/PPI could flush into 3445–3430.
✅ Conclusion & Action Plan
The full H1 map frames this week clearly:
Supplies stacked: 3618–3628 → 3668–3678 → 3725–3735 → 3790–3805.
Demands layered: 3562–3552 → 3528–3515 → 3488–3475 → 3445–3430.
Between these zones is the battlefield — trade reactions, not guesses. Let PA confirm (BOS, rejection, slowdown) before execution.
✨ Which zone do you expect to trigger first — the Immediate Supply 3628 or the Immediate Demand 3552? Drop your view 👇,please 🚀🚀🚀and follow GoldFxMinds for precision weekly maps 🚀

GOLD (XAUUSD): Time For Correction
Gold nicely respected 3600 psychological level.
The market was rejected from that on Friday
and formed a bearish imbalance candle before closing.
I think that we can expect a retracement at least to 3577 level.
❤️Please, support my work with like, thank you!❤️
I am part of Trade Nation's Influencer program and receive a monthly fee for using their TradingView charts in my analysis.

H4 XAUUSD Weekly Outlook – September 8–12, 2025Hello traders, gold ended last week at 3585–3600, breaking into fresh highs. The H4 chart now sets the battlefield for this week: we refine the institutional zones into clear swing areas where liquidity and reactions are most likely. With PPI (Sep 10) and CPI (Sep 11) ahead, these zones will shape the flow 👇
🔸 H4 Structure & Trend
Trend: Strong bullish → higher highs and higher lows continue.
EMAs (5/21/50/100/200) → perfectly aligned, EMA21 supports short-term structure.
RSI: Near 68, showing momentum strength but stretched into premium levels.
Bias: Bullish, but with room for correction into lower demand zones.
🔑 H4 Structural Zones
Upside Supply / Resistance
3615–3635 → First H4 supply, immediate test zone above 3600.
3665–3685 → Main H4 supply of the week, strong resistance cluster.
3735–3755 → Extended upside supply, only unlocked if CPI/PPI favor gold.
Downside Demand / Support
3565–3545 → Nearest H4 demand, aligned with EMA21.
3525–3505 → Secondary demand, key support base if 3550 fails.
3465–3445 → Deeper H4 demand, liquidity zone and EMA100 alignment.
📌 Weekly Scenarios
Bullish Path 🟢
If gold holds above 3565–3545, buyers can defend and attack higher levels.
Break above 3615–3635 unlocks 3665–3685.
Macro momentum (weak CPI/PPI) could drive extension into 3735–3755.
Bearish Path 🔴
Rejection at 3615–3635 may drag gold back into 3565–3545.
Losing this zone opens 3525–3505.
If macro favors USD, deeper test into 3465–3445 becomes possible.
✅ Conclusion & Action Plan
The H4 map with wide zones gives clarity for the week:
3565–3545 → key demand lifeline.
3615–3635 → immediate ceiling.
3665–3685 → decisive zone for continuation or reversal.
Expect sideways early in the week, then breakout volatility around Wednesday’s PPI and Thursday’s CPI.
✨ Will bulls break 3615–3635 early, or do we dip into 3545–3525 first? Share your thoughts , 🚀🚀🚀and follow GoldFxMinds for weekly precision outlooks 🚀

Daily XAUUSD Weekly Outlook – September 8–12, 2025Hello traders, after gold closed last week near 3600, we step into a week dominated by U.S. inflation data (PPI on Sep 10, CPI + Unemployment Claims on Sep 11, UoM Sentiment on Sep 12). The daily chart is stretched bullish, but structure shows where buyers and sellers are likely to fight. Let’s break down the map 👇
🔸 Daily Structure & Trend
Trend: Strong bullish continuation → daily candles are stacked above EMA5/21, showing institutional control.
Momentum: RSI near 70, confirming overbought but still within expansion mode.
Price action: Last week printed a powerful bullish engulfing → buyers firmly in control.
Bias: Bullish overall, but sensitive to mid-week CPI/PPI.
🔑 Daily Structural Zones for the Week
Upside Supply / Resistance
3620–3640 → First resistance area above 3600. Expect rejections or breakouts here.
3665–3700 → Main daily supply zone, aligning with HTF resistance.
3810–3860 → Extended bullish target zone if CPI/PPI data weakens USD.
Downside Demand / Support
3550–3530 → Nearest daily support, aligned with EMA5. Bulls need to defend this zone to sustain momentum.
3485–3520 → Stronger daily demand zone, previous breakout base.
3375–3325 → Deep daily demand and structural defense for the bullish trend.
📌 Weekly Scenarios
Bullish Path 🟢
If gold holds 3550+, buyers can attempt another push toward 3620–3640.
A clean breakout opens the door for 3665–3700 and possibly 3810–3860 by end of week if CPI favors gold.
Bearish Path 🔴
If sellers reject 3620–3640, price could correct back into 3550–3530.
Losing 3550 exposes 3485–3520 as the deeper retracement zone.
Strong USD data (hot CPI/PPI) could pull price even lower into 3375–3325.
✅ Conclusion & Action Plan
The daily chart sets a clear battlefield for this week:
3550–3530 = immediate lifeline for bulls.
3620–3640 = first ceiling to break.
3665–3700 = main supply target for a bullish continuation.
Failure at these levels opens the way for a corrective dip into 3485–3520.
Expect a quiet start Monday–Tuesday, followed by heavy volatility from Wednesday’s PPI and Thursday’s CPI. Trade the reactions, not the guesses.
✨ Do you see gold climbing straight to 3700, or does it need a reset at 3550 first? Drop your thoughts , 🚀🚀🚀and follow GoldFxMinds for more weekly precision maps 🚀

Weekly XAUUSD Outlook – September 8–12, 2025Hello traders, this week we enter a heavy calendar for the USD with PPI (Sep 10), CPI + Unemployment Claims (Sep 11), and UoM Sentiment (Sep 12). Gold just printed new highs around 3600, breaking out of the summer consolidation, and the macro stage is set for another volatile ride. Let’s map the battlefield 👇
🔸 Macro Context
Inflation data dominates the week. PPI/CPI will steer the USD narrative – hotter prints may strengthen USD and trigger corrections in gold, while softer data could fuel further upside.
RSI on the weekly is at 70+, showing strong momentum but also an overextended condition that makes retracements likely.
Geopolitical tensions + global demand for safe havens remain supportive for gold in the bigger picture.
🔸 Weekly Structure & Trend
The weekly chart shows a clear bullish trend, with all EMAs (5, 21, 50, 100, 200) stacked in perfect alignment and price locked above them.
Momentum candles are wide and aggressive → signaling institutional push.
Bias: Bullish with corrective pullback risk.
🔑 Weekly Structural Zones
🔴Upside (Premium levels / Supply)
3669–3700 → First resistance cluster, near-term profit-taking zone.
3815–3860 → Next major supply block, aligning with Fibo extension from last leg.
3960–4000 → Psychological milestone + HTF supply above.
🟢Downside (Discount levels / Demand)
3525–3480 → First strong demand zone if CPI/PPI triggers retracement. Aligned with EMA5/21 support.
3375–3325 → Mid-range demand, previous breakout base.
3220–3180 → Deep correction zone, strong institutional support if major reversal occurs.
📌 Scenarios
Bullish case:
If USD data comes in softer, gold could extend above 3669–3700, targeting 3815+.
Continuation requires holding 3525+ as support.
Bearish case:
Hot CPI/PPI + stronger USD could drag gold into a correction.
A clean break below 3525 exposes 3375–3325 as the deeper retest zone.
✅ Conclusion & Action Plan
This week is a macro-driven battlefield. The 3600 breakout confirms bullish control, but price is extended and reactive to inflation data. Watch 3525–3480 as the key defense line for bulls, and 3669–3700 as the immediate supply ceiling. Beyond that, momentum could unlock the 3815–3860 zone.
Trade with confirmation around these institutional levels — this week is not about chasing, but about reacting with precision to data and structure.
✨ What do you think — will CPI unlock the 3700+ rally, or is gold due for a pullback into 3525? Drop your thoughts below 👇 and don’t forget to follow GoldFxMinds for more weekly and daily precision plans 🚀

GOLD 1H CHART ROUTE MAP UPDATE & TRADING PLAN FOR THE WEEKHey Everyone,
Please see our updated 1h chart levels and targets for the coming week.
We are seeing price play between two weighted levels with a gap above at 3593 and a gap below at 3562. We will need to see ema5 cross and lock on either weighted level to determine the next range.
We will see levels tested side by side until one of the weighted levels break and lock to confirm direction for the next range.
We will keep the above in mind when taking buys from dips. Our updated levels and weighted levels will allow us to track the movement down and then catch bounces up.
We will continue to buy dips using our support levels taking 20 to 40 pips. As stated before each of our level structures give 20 to 40 pip bounces, which is enough for a nice entry and exit. If you back test the levels we shared every week for the past 24 months, you can see how effectively they were used to trade with or against short/mid term swings and trends.
The swing range give bigger bounces then our weighted levels that's the difference between weighted levels and swing ranges.
BULLISH TARGET
3593
EMA5 CROSS AND LOCK ABOVE 3593 WILL OPEN THE FOLLOWING BULLISH TARGETS
3613
EMA5 CROSS AND LOCK ABOVE 3613 WILL OPEN THE FOLLOWING BULLISH TARGET
3638
EMA5 CROSS AND LOCK ABOVE 3638 WILL OPEN THE FOLLOWING BULLISH TARGET
3658
BEARISH TARGETS
3562
EMA5 CROSS AND LOCK BELOW 3562 WILL OPEN THE FOLLOWING BEARISH TARGET
3528
EMA5 CROSS AND LOCK BELOW 3528 WILL OPEN THE SWING RANGE
3492
3470
EMA5 CROSS AND LOCK BELOW 3470 WILL OPEN THE SECONDARY SWING RANGE
3438
3408
As always, we will keep you all updated with regular updates throughout the week and how we manage the active ideas and setups. Thank you all for your likes, comments and follows, we really appreciate it!
Mr Gold
GoldViewFX

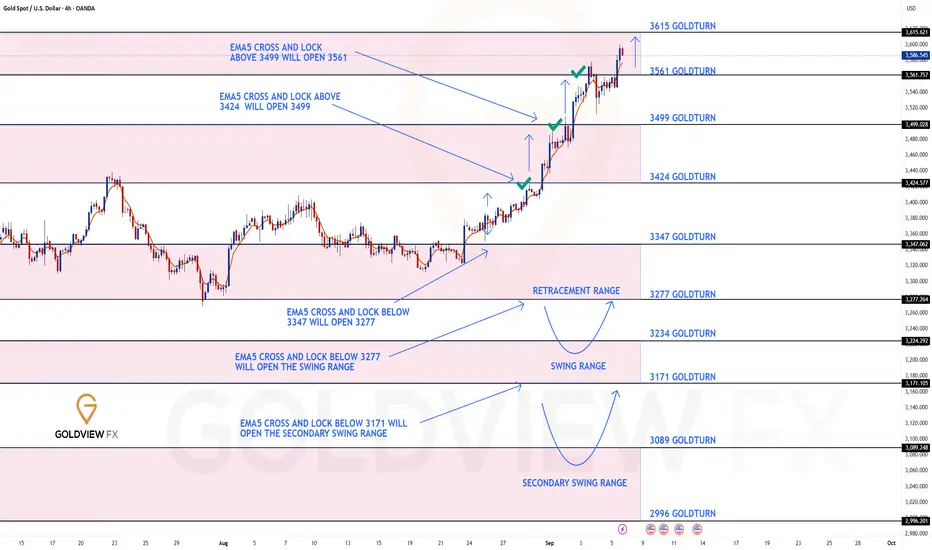
GOLD 4H CHART ROUTE MAP UPDATE & TRADING PLAN FOR THE WEEKHey Everyone,
This is still a follow up update on our 4chart idea which is still valid and in play with the final gap still in range.
Previously we had our Bullish target 3424 and finished off with ema5 cross and lock above this level opening 3499. This gap was filled last week just like we analysed followed with another cross and lock above 3499 opening 3561, which was also hit.
We now finished off last week with a cross and lock above 3561 leaving 3615 open. Failure to test this final target will see lower Goldturns tested for support and bounce.
We will keep the above in mind when taking buys from dips. Our updated levels and weighted levels will allow us to track the movement down and then catch bounces up.
We will continue to buy dips using our support levels taking 20 to 40 pips. As stated before each of our level structures give 20 to 40 pip bounces, which is enough for a nice entry and exit. If you back test the levels we shared every week for the past 24 months, you can see how effectively they were used to trade with or against short/mid term swings and trends.
The swing range give bigger bounces then our weighted levels that's the difference between weighted levels and swing ranges.
BULLISH TARGET
3424 - DONE
EMA5 CROSS AND LOCK ABOVE 3424 WILL OPEN THE FOLLOWING BULLISH TARGETS
3499 - DONE
EMA5 CROSS AND LOCK ABOVE 3499 WILL OPEN THE FOLLOWING BULLISH TARGET
3561 - DONE
EMA5 CROSS AND LOCK ABOVE 3561 WILL OPEN THE FOLLOWING BULLISH TARGET
2615 -
BEARISH TARGETS
3347
EMA5 CROSS AND LOCK BELOW 3347 WILL OPEN THE FOLLOWING BEARISH TARGET
3277
EMA5 CROSS AND LOCK BELOW 3277 WILL OPEN THE SWING RANGE
3234
3171
EMA5 CROSS AND LOCK BELOW 3171 WILL OPEN THE SECONDARY SWING RANGE
3089
2996
As always, we will keep you all updated with regular updates throughout the week and how we manage the active ideas and setups. Thank you all for your likes, comments and follows, we really appreciate it!
Mr Gold
GoldViewFX
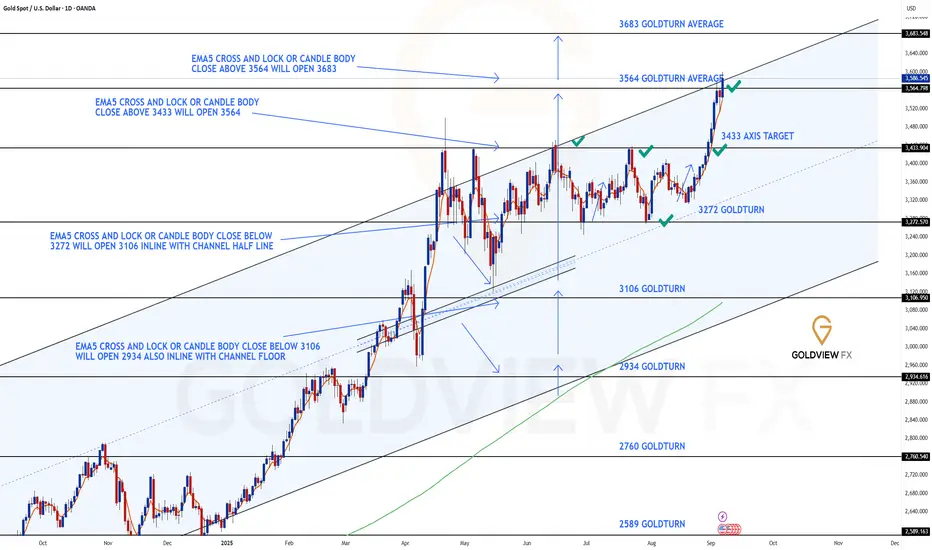
GOLD DAILY CHART ROUTE MAPDaily Chart Update
Range Break, Gap Confirmation & Next Target Achieved
As anticipated in our previous update, price finally pushed through for a test of 3433, confirming the strength of the upside momentum we discussed. This test produced a candle body close gap open for 3564, which has now been successfully achieved just as projected.
The close above 3564 further unlocks 3683 as the next long-term upside target. An EMA5 lock will serve as added confirmation for continuation toward this zone. Meanwhile, both 3564 and 3433 now transition into key support levels for this chart idea.
Current Outlook
🔹 3564 Target Reached
Our gap target has now been completed with a decisive candle body close above. This confirms bullish continuation and shifts focus to the next zone.
🔹 Next Objective – 3683
The successful 3564 break opens a fresh long-term target at 3683. EMA5 lock confirmation will strengthen the case for this move.
Updated Key Levels
📉 Support – 3272 (pivotal floor)
📉 Short Term Supports – 3433 & 3564
📈 Resistance / Next Upside Objective – 3683
Thanks as always for your continued support,
Mr Gold
GoldViewFX
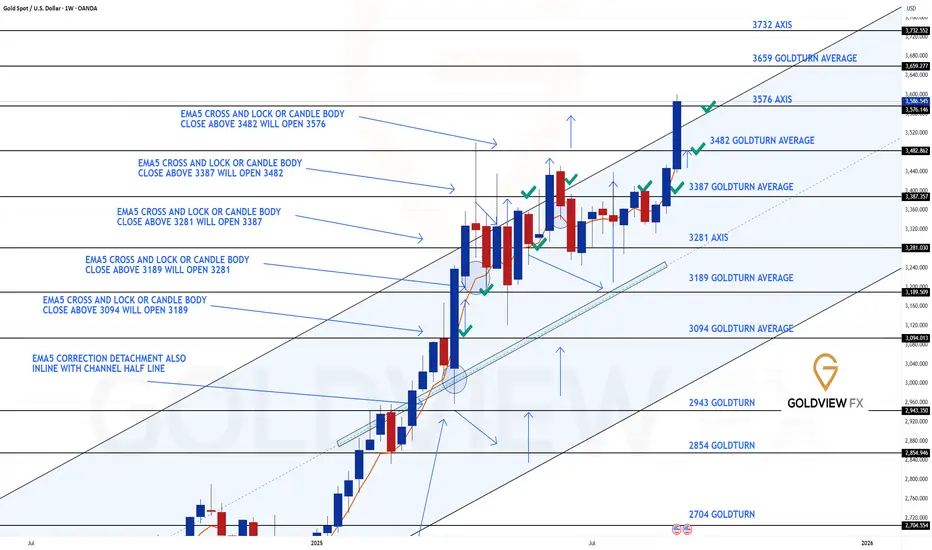
GOLD WEEKLY CHART MID/LONG TERM ROUTE MAPWeekly Chart Update
As anticipated, we got the 3482 gap target hit just as projected. Momentum carried further into the final channel top target at 3576, completing the upper channel move.
Current Outlook
🔹 Gap Targets Achieved
Both 3482 and 3576 have now been met. Price action delivered cleanly into these objectives, validating the prior bullish structure.
🔹 Candle Body Close Above 3576
The weekly body close above the channel top at 3576 has now opened the door to the larger 3659 long-term gap target. EMA5 would provide further confirmation if momentum sustains.
🔹 Channel Top Now Key Test
We need to see 3576 - 3482 (channel top) hold as support to confirm the new range zone play. If it holds, the 3659 - 3732 range becomes the next bullish zone. Failure to provide support above 3482 - 3576 will mean the breakout is short-lived, with risk of a swift correction back down.
🔹 Range Support Levels
3576 and 3482 now act as layered support levels to keep the bullish case intact within this range.
Updated Levels to Watch
📉 Support – 3482 & 3576
Key supports for this new range. Holding above 3576 strengthens the case for continuation toward 3659. A failure back below 3576 puts 3482 into play as the next defensive level.
📈 Resistance – 3659
The newly opened long-term gap target. This becomes the next upside objective if structure holds above 3576.
Plan
With 3482 and 3576 achieved, focus shifts to the 3659 gap. The bullish continuation depends on 3576 holding as support. If buyers defend it, the range extends upward into new territory. If not, expect a sharp corrective move back into the prior range.
Thanks as always for your support,
Mr Gold
GoldViewFX
BTC - Bullish continuation in the makingMarket Context
BTC has recently broken out of a long-standing descending trendline, marking a significant shift in sentiment. This breakout signals the end of the controlled downtrend and sets the stage for a possible bullish continuation. At the same time, the chart shows a clear sweep of sell-side liquidity at the lows, which often serves as the fuel for a reversal.
Trendline Breakout & Liquidity Sweep
The bullish breakout of the old upper trendline is an important technical event. Combined with the earlier sell-side liquidity sweep, this suggests that downside liquidity has been cleared and that the path of least resistance could now be higher. Such a combination often marks the start of a new leg in the trend.
Market Structure Shift Retest
Following the breakout, price has pushed higher and printed a market structure shift (MSS). The current retest of this MSS zone will be key — if it holds, it provides the ideal spot for bulls to reload positions. This retest acts as confirmation that the breakout is valid, not just a short-lived deviation.
Next Liquidity Grab & Upside Targets
Above the current range sits a clear buy-side liquidity pool. The next logical move would be a grab of that liquidity, which could extend into a more aggressive bullish expansion toward higher levels. The structure suggests a stair-step move higher: liquidity grab, retest, and then continuation toward 115k–117k zones.
Final Thoughts
The sell-side liquidity sweep, trendline breakout, and market structure shift all point to a bullish shift in momentum. The key lies in how price reacts to the retest — hold it, and the next liquidity levels are likely to be taken.
If this breakdown helped clarify the setup, a like is much appreciated — and let me know in the comments: are you playing the retest, or waiting for the liquidity grab above?
