GAMMA SQUEEZE: Why Gold Prices will hit 5 000 + USDBottom line
If 1% of Treasuries ($278B) rotates into gold, $5,000/oz is not only plausible—it sits inside the low end of what flow math + today’s market microstructure can deliver. The path (and whether we print $8k+ spikes) hinges on how much of that flow shows up as short-dated calls—because that is what turns steady demand into a self-feeding gamma loop.
________________________________________
Executive summary
• A 1% rotation out of U.S. Treasuries is roughly $278B of new gold demand (using SIFMA’s latest estimate that Treasuries outstanding ≈ $27.8T).
• At today’s context (gold ~$3.53k/oz on Sep 2–5, 2025), $278B buys ~79.4M oz ≈ 2,471 tonnes; at $5k/oz it buys ~55.6M oz ≈ 1,729 tonnes. For scale, annual mine supply ≈ 3,661 t and total above-ground stocks ≈ 216,265 t (bars/coins+ETFs ≈ 48,634 t).
• That flow is huge relative to both quarterly demand value (Q2’25 ≈ $132B) and typical daily trading turnover (~$290B/day across OTC, futures & ETFs). Even spread out, it materially tilts the tape; if concentrated and routed via options, it can produce dealer hedging feedback—i.e., a gamma squeeze.
• Price targets (framework, not prophecy):
o Conservative flow-only: +40–60% → $4,900–$5,600/oz
o Base case (flow + some options reflexivity): +70–110% → $6,000–$7,500/oz
o Squeeze/overshoot window (short-dated calls heavy): episodic spikes >$8,000/oz possible, but hard to sustain without continued flow.
These bands come from scaling prior ETF-driven episodes (notably ~877 t ETF inflow in 2020 alongside a ~+36% price run) and sizing against current market depth, while layering a realistic options-hedging multiplier (details below).
________________________________________
1) What a “gamma squeeze” in gold means (and why it can happen)
Definition (in one line): When call buying concentrates near-dated, near-the-money strikes, dealers short gamma must buy futures as price rises (and sell if it falls) to keep neutral—this feedback accelerates upside (“gamma squeeze”).
Why it’s plausible in gold right now:
• The listed derivatives stack is large. As of Fri, Sep 5, 2025, CME’s daily bulletin shows COMEX gold options open interest ~0.80M contracts (calls ~0.49–0.69M; puts ~0.30–0.38M depending on line item), each on 100 oz—i.e., option OI notionally ties to ~2,400–2,800 t of gold. That is the powder keg a call-wave can act on.
• Implied vol is moderate (GVZ ~18 for 30-day GLD options), so vega is “affordable,” gamma is punchy in the front end.
• CME’s CVOL framework and open-interest tools confirm where strikes/expiries cluster; when OI stacks close to spot and near expiry, market-wide gamma becomes most sensitive.
Back-of-envelope hedging math (illustrative):
For a 30-day, at-the-money option with σ≈18%, the Black-Scholes gamma is about
Γ≈ϕ(0)SσT≈0.399S⋅0.18⋅30/365\Gamma \approx \frac{\phi(0)}{S\sigma\sqrt{T}} \approx \frac{0.399}{S\cdot 0.18 \cdot \sqrt{30/365}}.
At S=$3,500/oz, that’s ~0.0022 per $. A +1% move (+$35) bumps delta by ~0.077 per option. If just 150k near-ATM front-tenor calls are held by customers (dealers short gamma), hedge buying ≈ 150,000 × 100 oz × 0.077 ≈ 1.16M oz ≈ 36 t—per 1% price pop. That’s only a slice of total OI; a broader crowding raises this number. Compare with ~2,500 t/day of global turnover and you can see how concentrated dealer hedging can move price intraday.
________________________________________
2) Sizing a 1% Treasury → gold rotation
Treasury base: latest SIFMA comment put U.S. Treasuries outstanding ≈ $27.8T (Q1’25). 1% → $278B.
Gold the rotation would buy:
• At $3,500/oz: $278B → ~79.4M oz → ~2,471 t
• At $5,000/oz: $278B → ~55.6M oz → ~1,729 t
For scale:
• Annual mine supply (2024): ~3,661 t; total supply (incl. recycling): ~4,974 t. A $278B buy ticket equals 47–67% of a year’s mine output (depending on price), or ~35–50% of total annual supply.
• ETF precedent: In 2020, ~877 t net ETF inflow (~$48B) coincided with a ~+36% move from Jan→Aug 2020. Today’s $278B is ~5–6× that dollar size (and ~2–3× the tonnes, depending on price), hinting at large flow-driven upside even before any options reflexivity.
• Turnover lens: WGC puts average daily trading across OTC/futures/ETFs at roughly $290B/day recently. A $278B program is ~one day’s global turnover. Pushed quickly (or skewed to options), that’s impactful; stretched over months, the price impact softens but still accumulates.
Futures-only lens (capacity check):
At $3,500/oz, one COMEX GC contract notionally = $350k (100 oz). $278B equals ~794k GC contracts. Current futures OI is ~0.49M contracts, so this exceeds all COMEX OI—you cannot push that much via futures quickly without major repricing. Even at $5,000/oz (~$500k/contract), it’s ~556k contracts, still comparable to the entire OI.
________________________________________
3) Price-target framework (with the math that gets you there)
Think of the price in layers: (A) base flow impact + (B) options-gamma reflexivity + (C) second-round effects (short-covering, momentum, FX, central banks).
A) Flow-only impact (calibrated to 2020)
• 2020 anchor: 877 t ETF inflow ↔ ~+36% price. Using a simple proportionality, 1,729–2,471 t (your $278B) maps to ~+71% to +101%.
• Apply to spot ≈ $3,532/oz (early Sep 2025):
o +71% → ~$6,050/oz
o +101% → ~$7,100/oz
Caveat: 2020 had unique macro tailwinds, so I treat this as upper-middle of base range.
B) Options reflexivity / gamma squeeze overlay
If 20–30% of the $278B rotation expresses via short-dated calls (common for levered macro expressions), dealer hedging can amplify flow impact:
• From the OI math earlier, a mere 1% up-move can demand ~20–40 t of dealer hedge buying if near-ATM OI is thick. A 3–5% multi-day grind can easily cascade into 100–200 t of incremental buying from hedgers alone. That’s non-trivial vs. mine supply pace, and it pulls forward upside.
• Result: add another +10–20% to the flow-only levels during a squeeze while it lasts.
C) Second-round effects
• Central banks: still persistent net buyers (>1,000 t/yr pace in recent years), tending to fade dips rather than rallies—a structural bid.
• FX & rates: the GVZ ~18 regime means bursts of vol aren’t “expensive”; a weakening USD or policy shocks can tilt the target higher.
Putting it together—scenario bands
Scenario Assumptions Implied move Target
Conservative $278B spread over 6–9 months, mostly physical/ETFs; limited options +40–60% $4,900–$5,600
Base case 50–70% to physical/ETFs, 30–50% to futures/options; moderate dealer short-gamma +70–110% $6,000–$7,500
Squeeze / overshoot Short-dated call concentration, dealers persistently short gamma; flow bunches in weeks +120–>150% (episodic) >$8,000 (brief spikes)
$5,000 target is well within the conservative band if any meaningful fraction of the $278B pushes through quickly, even without a full-blown gamma loop.
________________________________________
4) Why the market could mechanically gap higher
• Market size vs. flow: Q2’25 total demand value = $132B. Dropping $278B into this ecosystem is a 2× quarterly shock.
• Trading capacity: $278B ≈ one full day of global turnover; price impact is convex when the risk-absorption (dealers, miners, recyclers) cannot scale linearly day-by-day.
• Derivatives gearing: With ~0.8M options contracts OI outstanding and futures OI ~0.49M, even a partial shift into calls forces hedge-buys on the way up, the hallmark of a squeeze.
________________________________________
5) Key risks / reality checks
• Time profile of the rotation matters. A slow, programmatic shift spreads impact; a front-loaded move can overshoot then mean-revert as gamma decays.
• Elasticity is asymmetric. Jewelry/fabrication falls at high prices (demand destruction), recycling rises, both cushioning extremes. That moderates how long >$7k can persist without continued flow.
• Volatility regimes change. If GVZ spikes to high-20s/30s, option premia jump, slowing new call demand; conversely, put demand can flip net gamma long for dealers, dampening squeezes.
________________________________________
References (most load-bearing)
• Treasury base: SIFMA—Treasuries outstanding $27.8T (Feb 2025).
• Gold supply & stocks: WGC—Above-ground stock 216,265 t (end-2024); bars/coins+ETFs 48,634 t; mine supply 2024 ≈ 3,661 t.
• Trading turnover: WGC—gold trading ≈ $290B/day.
• ETF precedent: WGC—2020 ETF inflows 877 t (~$47.9B) alongside major price rise.
• Current price context: Reuters—record highs $3,532/oz set in early Sep 2025. (
• Options/hedging plumbing: CME daily bulletin (Sep 5, 2025) showing gold options OI ~0.8M contracts; CME CVOL/tools; Cboe GVZ ~18 as 30-day IV.
________________________________________
Metals

GOLD BEARISH BIAS RIGHT NOW| SHORT
GOLD SIGNAL
Trade Direction: short
Entry Level: 3,377.31
Target Level: 3,327.89
Stop Loss: 3,409.93
RISK PROFILE
Risk level: medium
Suggested risk: 1%
Timeframe: 9h
Disclosure: I am part of Trade Nation's Influencer program and receive a monthly fee for using their TradingView charts in my analysis.
✅LIKE AND COMMENT MY IDEAS✅

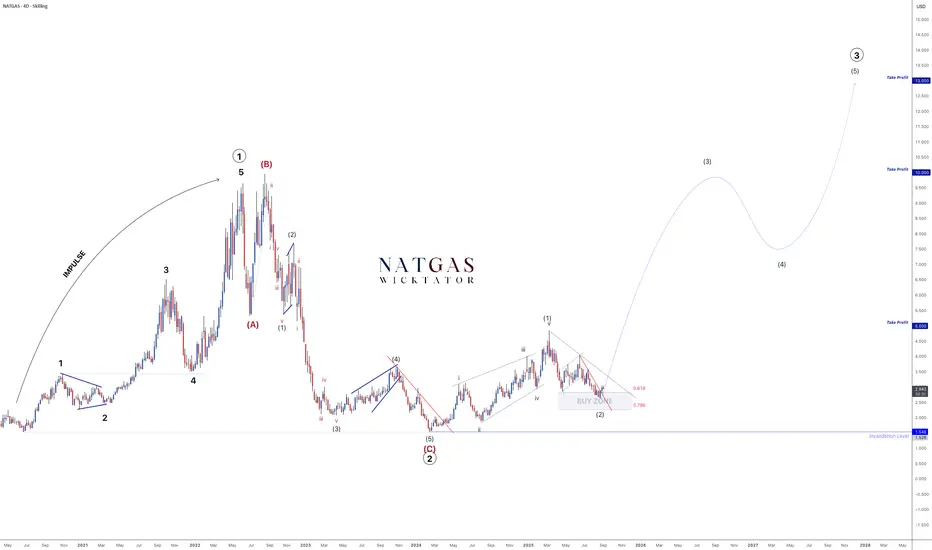
NATGAS – Wave 3 Impulse Confirmed. Multi-Year Rally Started!Our roadmap has played out with precision.
Wave 2 correction is complete, price tapped the buy zone, and the entry is now active.
We’re in the early stages of Wave 3 - historically the strongest and longest Elliott Wave.
🎯 Targets remain:
TP1: 5
TP2: 10
TP3: 13
The impulse has begun - now it’s about riding the wave.
Plan the trade. Trade the plan.

Bitcoin Maxis - Brace for Impact !!!🚨 Bitcoin Maxis, brace for Impact 🚨
There is clear, recent evidence that Tether is actively diversifying its reserves and investments by both selling some of its Bitcoin holdings and significantly increasing its exposure to gold, including direct investments in gold mining:
1. Selling Bitcoin and Buying Gold
Tether has reported substantial profits from both Bitcoin and gold price appreciation. In 2024, the company booked. How does Tether generate its profits beyond Bitcoin and gold investments?" with \5 billion coming from unrealized appreciation of its gold and Bitcoin holdings. However, recent reports indicate Tether has been increasing its gold reserves while adjusting its Bitcoin treasury. For example, Tether disclosed holding $8.7 billion in gold bars in its Q2 2025 attestation report, and its gold-backed stablecoin (XAU₮) is backed by over 7.7 tons of physical gold as of April 2025.
2. Entering Gold Mining
Tether is in active discussions to invest in gold mining, aiming to channel its crypto profits into the metals market. CEO Paolo Ardoino has publicly referred to gold as “natural Bitcoin” and expressed a strong affinity for gold as a foundational asset. The company is exploring opportunities across the entire gold supply chain, including mining, refining, and trading.
Tether has already invested over $200 million in Elemental Altus Royalties, a Canadian firm that buys future revenue streams from gold mines, giving Tether exposure to multiple mines with less operational risk.
3. Strategic Shift
Tether’s move into gold and gold mining is part of a broader diversification strategy, which also includes investments in AI, Bitcoin mining, and other sectors. The company’s leadership has repeatedly emphasized gold’s role as a hedge and a complement to Bitcoin.
In summary, Tether is not only selling some Bitcoin and buying gold but is also directly entering the gold mining sector as part of its diversification and profit deployment strategy.
Sources:
www.zerohedge.com
www.coindesk.com
www.fxleaders.com
bitcoinethereumnews.com
BITSTAMP:BTCUSD NASDAQ:TSLA NASDAQ:NVDA NASDAQ:MSTR TVC:DXY TVC:GOLD TVC:SILVER VANTAGE:SP500 FX:EURUSD COINBASE:USDTUSD AMEX:NUGT AMEX:GDX

September 5th Gold Trend Analysis and Trading Strategy:
Key Focus: US Non-Farm Payroll Data
I. Core Fundamental Analysis
Bullish Factors:
Federal Reserve Rate Cut Expectations: Market expectations of the Fed starting rate cuts at its mid-month meeting are the core driver of gold's consecutive record highs. The prospect of an accommodative monetary policy reduces the opportunity cost of holding gold, providing fundamental support for gold prices.
Geopolitical Risk: Ongoing geopolitical tensions have enhanced gold's appeal as a traditional safe-haven asset.
Bearish/Risk Factors:
Technical Profit-Taking: After gold prices reached a record high for seven consecutive days, they accumulated significant short-term profit-taking. Thursday's (September 4th) pullback of over 1% suggests that bulls are partially closing their positions and locking in profits, which is the primary pressure for the price correction.
Bond Market Sell-off: Global bond markets experienced a sell-off, sending interest rates (yields) soaring. This typically signals market concerns about inflation or the economic outlook, potentially attracting some funds from non-interest-bearing gold to interest-bearing assets. This diverges from gold's upward trend and presents a significant risk signal.
Non-farm Payroll Data Preview: Today's release of the US August non-farm payroll data is the biggest variable of the day. The data's performance will directly impact expectations of a Fed rate cut:
Strong data → Cooling rate cut expectations → Bullish for the US dollar, bearish for gold.
Weak data → increased expectations of rate cuts → bad for the dollar, good for gold.
II. Key Technical Analysis
Current Trend: The long-term uptrend remains intact, but a short-term correction from the highs is indicated. The daily line closed with a long upper shadow, indicating heavy selling pressure from above.
Key Resistance Levels:
Primary Resistance: $3555-3560/oz (hourly resistance, yesterday's US rebound high, today's bull-bear watershed)
Strong Resistance: $3570-3580/oz (historical high)
Key Support Levels:
Initial Support: $3530-3520/oz (4-hour mid-line congestion zone, yesterday's Asia-Europe consolidation platform)
Important Support: $3510-3508/oz (Thursday's correction low, strong support from the 5-day moving average on the daily chart and a psychological barrier)
Ultimate Support: $3490-3480/oz (deep correction target)
III. Comprehensive Trading Strategy
Core Principle: Exercise caution and trade within a range before data releases; follow the trend after data releases. 1. Pre-Data Strategy (Before the Non-Farm Payrolls Data Release): Range-Bound Trading
Sell on Rebounds: If gold prices rebound to the $3555-3565 area and show signs of stagflation (such as a bearish close with a long upper shadow on the hourly chart), try a small short position with a stop-loss above $3570, targeting $3540-3530.
Buy on Pullbacks: If gold prices pull back to the $3520-3530 support area and show signs of stabilization (such as a hammer candlestick or bullish engulfing candlestick), try a small long position with a stop-loss below $3515, targeting $3545-3555.
2. Post-Data Strategy (After the Non-Farm Payrolls Data Release): Trade on Breakouts
Breakout Scenario: If weak data leads to a strong breakout and consolidation of gold prices above $3560, follow up with a long position, targeting $3570-3580. Breakout Scenario: If strong data causes gold prices to effectively break below the $3,510 support level, short positions can be followed, targeting the $3,500-3,490 area.
3. Conservative Strategy:
Primarily wait and see, waiting for the release of the non-farm payroll data to clarify the market direction before entering the market. Avoid the risk of sharp fluctuations and spread widening immediately after the data release.
IV. Risk Warning and Position Management
Major Risk Event: All operations today must prioritize the non-farm payroll data. The data results are unpredictable and could trigger sharp market fluctuations.
Strict Stop-Loss: Regardless of the strategy chosen, a stop-loss must be set to prevent significant losses due to data trends that go against expectations.
Light position operation: Before the data, all transactions should be kept light, and sufficient funds should be reserved to cope with the trend market after the data.
Summary: Gold's medium- to long-term bullish logic remains unchanged, but it faces short-term technical correction pressure. The key to successful trading today lies in its response to the non-farm payroll data. It is recommended to buy low and sell high with a range-bound approach in the Asian and European sessions, and enter and exit quickly.
XAUUSD: The Correction Phase BeginsHello everyone, here is my breakdown of the current Gold setup.
Market Analysis
From a broader perspective, the price of Gold has been in a strong uptrend since breaking out of a prior Downward Channel. This entire bullish phase has been developing within the confines of a large broadening wedge, a pattern that indicates expanding volatility as price makes higher highs and higher lows.
Currently, the price is at a critical point, testing the Broadening Resistance Line at the very top of this wedge. This test comes after a very strong and steep upward impulse, which often suggests that a trend might be overextended and due for a correction.
My Scenario & Strategy
My scenario is a tactical short, based on the idea that this strong rally is due for a healthy pullback. Trends rarely move in a straight line forever, and the resistance line of this multi-week wedge is a high-probability area for sellers to step in.
I'm looking for the price to make one final, small push higher and then show a clear sign of rejection. The primary target for this corrective fall is 3500 points. As you noted, this is an intermediate target, not the major Support 1, making it a logical first objective for a pullback.
That's the setup I'm tracking. Thank you for your attention, and always manage your risk.

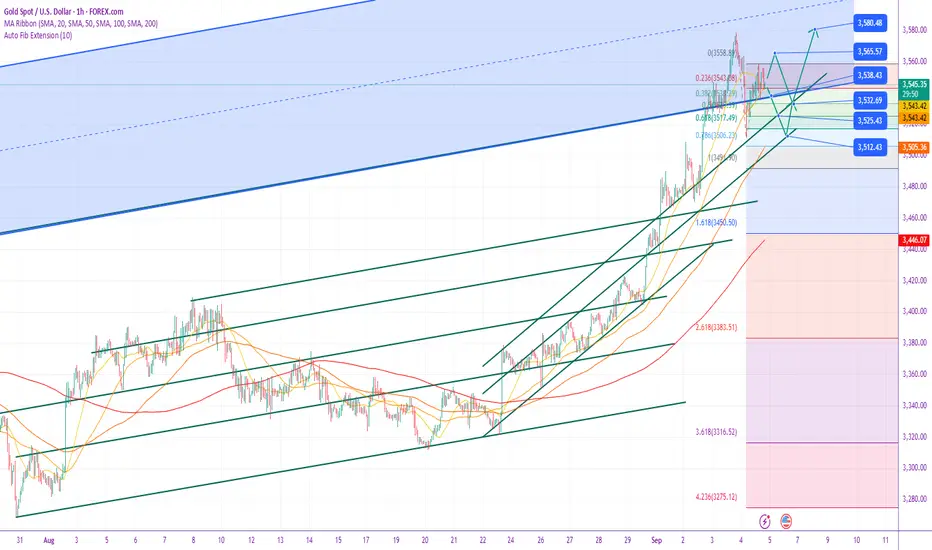
Gold will continue to grow inside upward channelHello traders, I want share with you my opinion about Gold. The market context for Gold has been firmly bullish since the price broke out of its prior consolidation range, a move that originated from the deep buyer zone. This breakout shifted the market structure, initiating a new impulsive phase that has since been neatly contained within a well-defined upward channel. The price action for XAU has been respecting the boundaries of this channel, creating a clear sequence of higher highs and higher lows. Currently, after being rejected from the channel's upper resistance line, the asset is undergoing a healthy correction movement. This pull-back is guiding the price back towards a significant confluence of support, where the ascending support line of the channel converges with the horizontal support zone near the 3485 current support level. The primary working hypothesis is a long scenario, based on the expectation that buyers will defend this area and maintain the integrity of the uptrend. A confirmed bounce from this dynamic support would signal the end of the correction and the resumption of the primary bullish trend. Therefore, the TP is logically placed at 3610 points, representing a new structural high and a measured objective for the next impulsive wave. Please share this idea with your friends and click Boost 🚀

BITCOIN VS. GOLDAlthough there is a time difference between bitcoin, known as digital gold, and spot gold, it continues to follow suit, which we can clearly see on the chart.

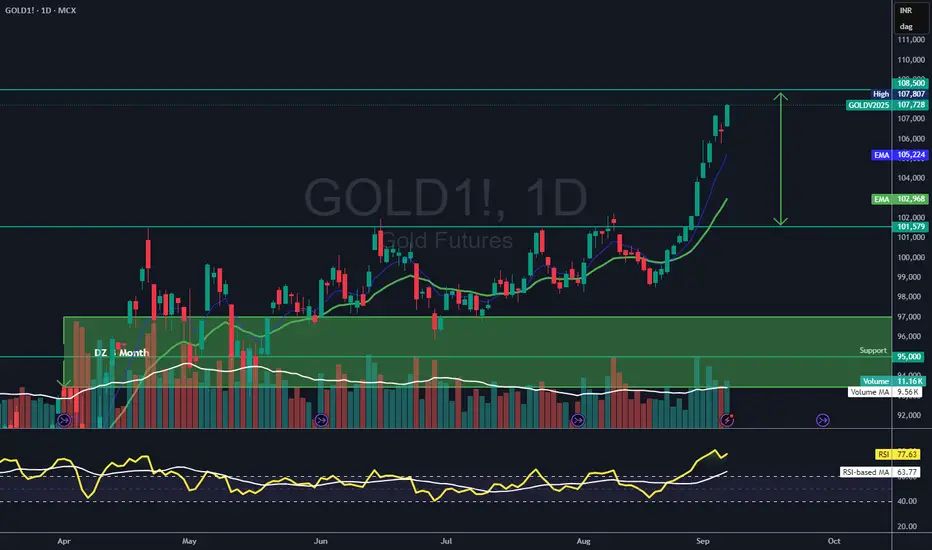
Gold Should Find its Correction at the Level of 108500As Per My Analysis.
Gold Should Find its ATH @ 108500
and should Start Correction from this Point.
1st support Level is 101500
and if It breaks this it should find Support @ 95000
Best Trend-Following Price Model For Gold XAUUSD Trading
In this article, I will show you a powerful chart setup for profitable trend following trading Gold. I will break down how it works with examples.
Here is how this price model looks:
It is based on 5 important conditions that should be strictly met.
1 - Gold should trade in a global bullish trend.
The price should consistently update Higher Highs HH and Higher Lows HL.
2 - Higher Lows should respect a rising trend line, acting as a support.
It should be respected by at least 3 consequent bullish movements from that.
3 - After a formation of a high above a trend line, the price should start a correctional movement in a minor trend in a bullish flag pattern.
It can be a horizontal, parallel or expanding channel.
4 - Correcting, Gold should test a major rising trend line, being within a flag.
5 - A bullish movement should initiate after a trend line test and the price should break and close above a resistance line of a flag.
When all these 5 conditions are met, we can expect a bullish movement on Gold at least to a level of a current high from where a correction started.
A broken resistance line of a flag and a major rising trend line will compose a safe zone to buy Gold from.
The best time frame for this model will be a daily.
Let's study a real example of such a price model on Gold chart on a daily.
Examine a price chart of Gold on a daily time frame above.
All 5 conditions are met, and we can anticipate a rise to the underlined red resistance.
Our buy zone will be based on a broken resistance of the flag and a major rising trend line.
You can see that our goal was successfully reached.
Here is the proof -
This price model will help you to predict strong bullish waves , trading Gold. A simple combination of a trend analysis and a price action are the 2 basic components that you need to study to identify that properly.
❤️Please, support my work with like, thank you!❤️
I am part of Trade Nation's Influencer program and receive a monthly fee for using their TradingView charts in my analysis.

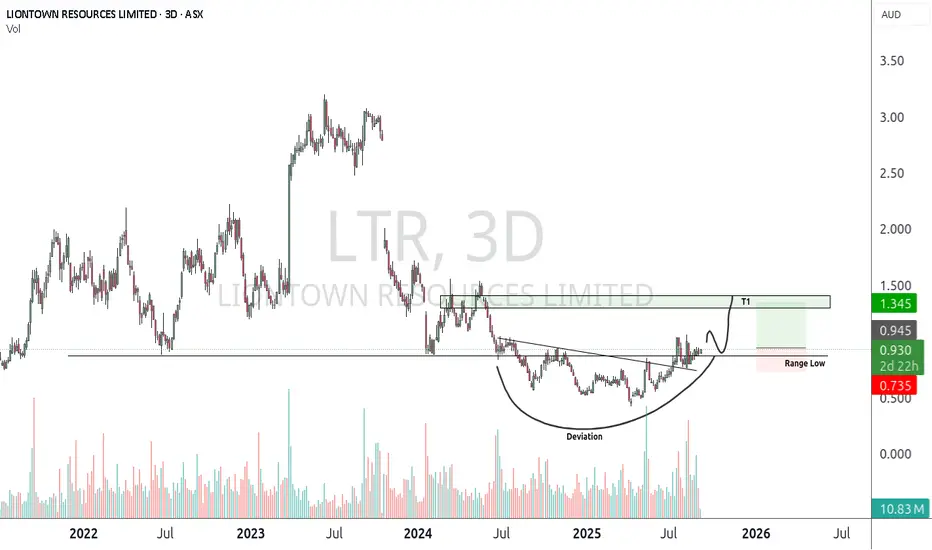
LTRlooking to trade green box in the coming weeks/months as LIT etf has broken out LTR is back inside range with big deviation of range low
GOLD SENDS CLEAR BEARISH SIGNALS|SHORT
GOLD SIGNAL
Trade Direction: short
Entry Level: 3,586.96
Target Level: 3,559.28
Stop Loss: 3,605.13
RISK PROFILE
Risk level: medium
Suggested risk: 1%
Timeframe: 1h
Disclosure: I am part of Trade Nation's Influencer program and receive a monthly fee for using their TradingView charts in my analysis.
✅LIKE AND COMMENT MY IDEAS✅

Gold 4H Outlook – Buy the Dip or Fade the Drop?Gold on the 4H timeframe is consolidating below 3,600 after a strong bullish run. Current structure shows price resting near premium levels, with liquidity building both above 3,600 and below 3,530. This suggests engineered sweeps before the next expansion.
________________________________________
📌 Key Structure & Liquidity Zones (4H):
• 🔼 Buy Zone 3,572 – 3,574 (SL 3,565): Fresh demand zone sitting at intraday discount; potential continuation area.
• 🔽 Sell Scalp Zone 3,530 – 3,526 (SL 3,537): Short-term supply/pivot area; scalp opportunity if price rejects.
• 📍 Liquidity Magnet 3,603 – 3,605: Upside imbalance zone likely to be rebalanced.
________________________________________
📊 Trading Ideas (Scenario-Based):
🔺 Buy Setup – Demand Zone Reaction
• Entry: 3,572 – 3,574
• Stop Loss: 3,565
• Take Profits:
o TP1: 3,585
o TP2: 3,595
o TP3: 3,605
👉 Demand block aligned with bullish order flow. Look for liquidity sweep and rejection to resume trend.
________________________________________
🔻 Sell Scalp Setup – Short-Term Reaction
• Entry: 3,530 – 3,528
• Stop Loss: 3,537
• Take Profits:
o TP1: 3,520
o TP2: 3,510
o TP3: 3,500
👉 Intraday supply zone and pivot. Best used for quick scalps against trend, targeting downside liquidity.
________________________________________
🔑 Strategy Note
Bias remains bullish overall, but intraday shorts are valid for scalps. The cleaner setup is buying into 3,572–3,574 for continuation toward 3,600+. Smart money may sweep liquidity at 3,530 before reversing higher.

Gold - A+ Trade Setup🔎 Weekly View (Macro Bias)
Trend: Strong bullish trend intact with multiple BOS (Break of Structure) confirming upward continuation.
Resistance: Price has cleared a prior major resistance near 3,400 and is pushing higher.
Implication: Weekly bias remains bullish unless we see a sharp rejection back under 3,400 – 3,450 demand.
📉 Daily View (Intermediate Bias)
Trend: Clear bullish structure with consistent higher highs and higher lows.
Key Levels:
Major Resistance: Broken at 3,100, now acting as historical support.
Support Zone: Fresh daily demand sits around 3,450 – 3,500.
Implication: As long as daily demand holds, expectation is for continuation into 3,600+.
⏱ 8H View (Execution Frame)
Structure: Bullish channel still intact. Price broke above resistance and is holding well above 3,560–3,570 demand.
Scenario: Possible retest of the 3,560 – 3,570 zone (aligned with bullish trendline) before continuation upward.
Upside Target: 3,600 – 3,620 in the near-term.
⏱ 30M View (Fine-Tuned Entry)
Recent Action: Price rallied sharply after clearing resistance and is now consolidating.
Fib Level: The 71% retracement aligns with prior breakout structure near 3,570, offering a strong intraday buy zone.
Plan: Intraday longs on retests into 3,570 – 3,580 with continuation toward 3,600 – 3,610.
✅ Trade Outlook
Bias: Bullish on all timeframes.
Setup:
Buy retracements into 3,570 – 3,580 (30M / 8H demand).
Hold for continuation into 3,600 – 3,620 near-term.
Invalidation: Clean break below 3,550 (trendline + demand zone) would suggest a deeper pullback toward 3,450 – 3,500.

Gold at the Crossroads: Decisive Battle at $3,600 After BreakoutAsset: XAUUSD ( Gold Spot / US Dollar )
Analysis Date: September 5, 2025
Current Closing Price: $3,586.54 (as of 12:59 AM UTC+4)
Timeframes Analyzed: 1H, 4H, D, W
Market Context: Record High Territory - Bullish Momentum Sustained
Executive Summary & Market Outlook
Gold (XAUUSD) has executed a critical technical breakout, pushing above the $3,580 resistance and challenging the monumental $3,600 psychological and technical barrier. The asset is in a firm bullish trend but is now testing a zone where profit-taking and fresh selling pressure historically emerge. The price action in the coming sessions will be decisive. A sustained break above $3,600 could trigger a momentum-fueled rally towards $3,650, while a rejection here may form a short-term top, leading to a retracement towards $3,550 support. This analysis integrates multi-timeframe signals for intraday and swing traders.
Multi-Timeframe Technical Analysis
1. Trend Analysis (Daily & 4-Hour Chart):
Primary Trend: Bullish. The sequence of Higher Highs (HH) and Higher Lows (HL) is unequivocal on the daily chart.
Momentum: The breakout above the previous resistance near $3,580 is a significant bullish victory. However, the rapid ascent has left the price extended, increasing the probability of a consolidation or pullback.
2. Key Chart Patterns & Theories:
Breakout & Re-test Pattern: The move above $3,580 has broken the structure of the previous consolidation. The ideal bullish scenario now involves a successful re-test of the $3,580 level as new support. This would confirm the breakout's validity and offer a high-probability long entry.
Elliott Wave Theory: The rally from the last significant low is impulsive in nature. We are likely in a later stage of a Wave 3 or a Wave 5 extension. This suggests that while the trend is up, the cycle is maturing. Wave 4 corrections typically retrace to the 38.2% Fibonacci level of Wave 3, which would be near $3,520.
Gann Theory: The $3,600 level represents a key psychological and mathematical resistance. A decisive break and close above it could open the path to the next Gann angle/resistance level, projected near $3,620-$3,630.
Ichimoku Cloud (H4/D1): Price is trading well above the Senkou Span (Cloud) on both timeframes, confirming the strong bullish trend. The Cloud itself is thick and rising, providing strong dynamic support far below current levels.
3. Critical Support & Resistance Levels:
Resistance (R1): $3,600 - $3,610 (Key Psychological & Technical Barrier)
Resistance (R2): $3,630 (Next Projected Target)
Resistance (R3): $3,650 (Measured Move Target)
Current Closing Price: ~$3,586.54
Support (S1): $3,580 (Previous Resistance - New Potential Support)
Support (S2): $3,550 - $3,555 (Bullish Trend Line & 21-period EMA confluence)
Support (S3): $3,520 (Major Swing Low & 38.2% Fib Retracement)
4. Indicator Consensus:
RSI (14-period on 4H): Reading is in the 68-72 range, touching on overbought territory. This does not signal an immediate reversal but warns that buying momentum may be overextended in the short term. Watch for bearish divergence on the 1H chart for early signs of a pullback.
Bollinger Bands (4H): Price is peeking outside the upper band, a classic sign of a strong trending move. A move back inside the bands will signal a pause in the trend.
Moving Averages: The bullish alignment (EMA8 > EMA21 > EMA50) is perfect on all timeframes. The EMA 21 on the 4H chart (~$3,555) has acted as dynamic support and is a key level for the bullish thesis.
Volume & VWAP: Volume spiked on the initial breakout. The Anchored VWAP (from the recent swing low) shows price is extended above the mean. A pullback to the VWAP would be a healthy development.
Trading Strategy & Forecast
A. Intraday Trading Strategy (5M - 1H Charts):
Bullish Scenario (Breakout Hold): A pullback to the $3,580 - $3,582 area that finds support (e.g., bullish pin bar, engulfing pattern) presents a low-risk long opportunity. Entry: On bullish confirmation at support. Stop Loss: Below $3,575. Target: $3,600 (TP1), $3,610 (TP2).
Bearish Scenario (Rejection at Highs): If price fails to break $3,600 and shows rejection (long upper wicks, RSI divergence), a short trade for a pullback to $3,570 - $3,575 is viable. Entry: On rejection signals. Stop Loss: Tight, above $3,605. Target: $3,565 (S1).
Momentum Breakout: A strong 1H close above $3,605 could be faded with a small long position, targeting $3,620.
B. Swing Trading Strategy (4H - D Charts):
Bullish Bias: The strategy remains "buy the dip." The most attractive zones for adding long positions are a successful re-test of $3,580 or a deeper pullback to the stronger support confluence at $3,550 - $3,555.
Bearish Risk: A daily close back below $3,560 would be a warning sign that the breakout may have failed (a potential bull trap), opening the door for a deeper correction to $3,520. This would invalidate the immediate upside breakout scenario.
Risk Management & Conclusion
Key Risk Events: Monitor for any surprise geopolitical developments or unexpectedly hawkish comments from Fed officials, which could trigger a "flight-to-safety" rally or a dollar-strength selloff in gold, respectively.
Position Sizing: The increased volatility at key levels demands conservative position sizing. Risk no more than 1% of capital per trade.
Conclusion: XAUUSD is at a critical technical and psychological juncture. The breakout is bullish, but the battle for $3,600 is the key to the next directional move. Swing traders should be patient for a better risk/reward entry on a pullback. Intraday traders can play the range between $3,580 and $3,600 until a decisive break occurs. The overall structure favors the bulls, but a period of consolidation is the most likely immediate outcome.
Overall Bias: 🟢 Bullish above $3,555 | 🟡 Neutral/Bearish below $3,560
For individuals seeking to enhance their trading abilities based on the analyses provided, I recommend exploring the mentoring program offered by Shunya Trade. (Website: shunya dot trade)
I would appreciate your feedback on this analysis, as it will serve as a valuable resource for future endeavors.
Sincerely,
Shunya.Trade
Website: shunya dot trade
Disclaimer: This post is intended solely for educational purposes and does not constitute investment advice, financial advice, or trading recommendations. The views expressed herein are derived from technical analysis and are shared for informational purposes only. The stock market inherently carries risks, including the potential for capital loss. Therefore, readers are strongly advised to exercise prudent judgment before making any investment decisions. We assume no liability for any actions taken based on this content. For personalized guidance, it is recommended to consult a certified financial advisor.

XAUUSD – Bulls Gaining the Edge?👋Hello everyone, what do you think about OANDA:XAUUSD ?
Yesterday, the market received a series of key US data, sending gold into constant swings. Here’s a quick breakdown of the impact on the precious metal:
🔻 ADP Non-Farm Employment Change: 54K < 73K (forecast) < 106K (previous) → Labor market weakens → USD down → Gold supported.
🔻 Unemployment Claims: 237K > 230K (forecast) > 229K (previous) → Jobless claims rise → USD down → Gold supported.
🔺 ISM Services PMI: 52.0 > 50.9 (forecast) > 50.1 (previous) → Services expand → USD stronger → Gold under pressure.
👉 Overall: 2 out of 3 data points came in negative for the USD, creating downward pressure on the dollar and supporting gold. Even though services data was positive, market sentiment still leans toward expectations of a less hawkish Fed → easing yields → gold benefits.
Preferred Strategy: Look for potential buying zones at support and Fibonacci retracement levels. The main target is a safe move above the trendline, with 3575 in focus.
Risk: If price closes below support, wait for fresh signals to identify safer entry points.
So, what do you think? Where will XAUUSD head next, and at what price will today’s session end?
Good luck!

Next Target for Gold: $3600?👋Hello everyone, what do you think about the trend of OANDA:XAUUSD ?
Gold has just made a powerful breakout, breaking through the old resistance zone and forming new support. Currently, the price is hovering around $3530 with signs of a minor top forming. The area around the Fib 0.5–0.618 is considered the Expected Retracement Zone where buyers are waiting to accumulate.
The EMA34 and EMA89 continue to support the trend, acting as dynamic support levels. The new resistance zone at $3,580 – $3,600 will be the next target if price sustains its rebound.
With the Fed likely to cut rates and the USD weakening, gold is once again being viewed as a top safe-haven asset. Each pullback now seems more like a springboard for the next rally.
So, what do you think? Will gold sustain this bullish trend? Share your thoughts in the comments💬!

PLATINUM Sell Signal triggered.We couldn't have had a more timely signal on Platinum (XPTUSD) last time we looked at it (April 08, see chart below) as we made a buy call exactly at the bottom of the Descending Triangle with the immediate rebound that followed, quickly hitting our $985.00 Target:
This time, the price has triggered a Sell Signal as the 1D MA50 (blue trend-line) broke and a Lower High potentially initiates a Channel Down similar to those of 2024. Both declined to their 1.236 Fibonacci extensions before breaking upwards.
As a result, we treat this as a sell opportunity, targeting 1220.
-------------------------------------------------------------------------------
** Please LIKE 👍, FOLLOW ✅, SHARE 🙌 and COMMENT ✍ if you enjoy this idea! Also share your ideas and charts in the comments section below! This is best way to keep it relevant, support us, keep the content here free and allow the idea to reach as many people as possible. **
-------------------------------------------------------------------------------
💸💸💸💸💸💸
👇 👇 👇 👇 👇 👇

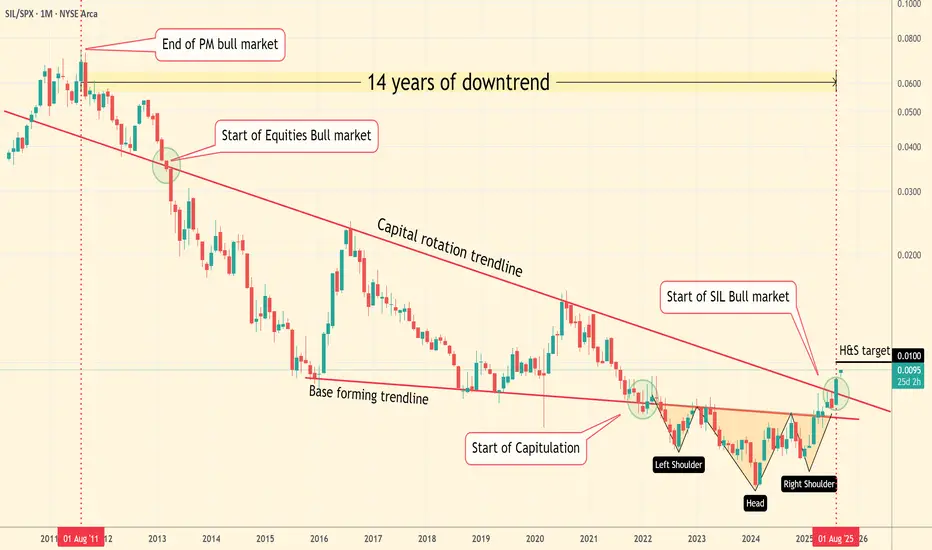
Why Silver Miners Are Poised for a Historic Breakout...After 14 long years of being left in the dust by the S&P 500, the silver mining sector is finally signaling that its time has come. The chart of the SIL/SPX ratio tells a powerful story, suggesting we're on the brink of a massive capital rotation.
The Technical Evidence Is Clear
The long-term downtrend, which has defined this ratio for well over a decade, is officially over. Following the completion of a classic Inverse Head and Shoulders pattern, the ratio has now logged a decisive monthly close above its crucial "Capital Rotation Trendline." This isn't just a minor blip; it's a major technical breakout that signals a fundamental shift in market sentiment.
The Fundamental Logic Is Unstoppable
For years, capital has overwhelmingly funneled into technology and the broader S&P 500. Now, as those sectors look increasingly overvalued, the money has to go somewhere. The asymmetry here is staggering: the sheer difference in market capitalization means that even a small percentage of funds rotating out of tech and into silver miners could trigger an explosive price move in the silver mining sector.
Physical Silver Is Providing the Catalyst
This breakout isn't happening in isolation. It's being confirmed by the price of physical silver itself, which is pushing past key resistance levels at $40 and has its sights set on $50. This move provides the perfect fuel for the miners, as higher silver prices dramatically increase their profit margins and overall value.
The situation is clear: the smart money is likely already moving. The question is, are you ready to join them?
Gold. Expect entry into the fifth waveThe current decline looks like the 4th wave
Before it, 3 in 3 is visible
There is an alternative probability of the marking, that the marking will lengthen and we will get a stronger upward impulse.
But in both scenarios there is another increase in quotes with a target of 3600-3650
In general, the growth of gold is due to a reduction in central bank investments from American treasuries.
Just today we described how investments of India and other non-Western countries in American debt are decreasing.
All this spurred the growth of gold quotes

GOLD WEEKLY CHART ROUTE MAP UPDATEHey Everyone,
After completing our 1h, 4h and daily chart ideas this week, please now see update on our weekly chart idea, which we also smashed into pips!!!
As anticipated -
This time, bulls followed through in full force:
✅ We got our Target Hit at 3482 after confirming the gap from the body close above 3387.
✅ To finish the week on a high, we also completed our long-range axis target at 3576, which has been highlighted on the chart since the beginning of our tracking on this chart idea.
🔹 3482 Gap Target Achieved
The upside gap has now been fully confirmed and met.
🔹 Axis Target 3576 Completed
The higher-timeframe target we’ve tracked since the start has been fulfilled, marking a strong close to the week.
With both the 3482 gap and 3576 axis target achieved, the bullish roadmap we’ve tracked has now played out to completion. Near-term, we’ll watch how price reacts around 3576. A strong close above could open fresh upside extensions, while failure here may trigger a healthy pullback toward 3387 for retest.
We will now come back Sunday with a full multi timeframe analysis to prepare for next week’s setups, including updated views on the higher timeframes, EMA5 alignments, and structure expectations going forward.
Thanks again for all your likes, comments, and follows.
Wishing you all a fantastic weekend!!
Mr Gold
GoldViewFX

THE KOG REPORT - NFP THE KOG REPORT – NFP
This is our view for NFP, please do your own research and analysis to make an informed decision on the markets. It is not recommended you try to trade the event if you have less than 6 months trading experience and have a trusted risk strategy in place. The markets are extremely volatile, and these events can cause aggressive swings in price.
For this months NFP, due to the aggressive stretch on gold upside, we’re only looking for the extreme levels to attempt the trade. Even then, we’re of the view that we will let this play out for today and next week look for a clean reversal before getting in and taking what is needed.
We have the immediate level of support below 3550-40, which needs to be held in order to attempt the upside levels of 3580-5 and if that level is broken 3603-10. It’s that higher level that we feel if attempted, could present a decent opportunity to attempt the short trade, unless broken of course.
Lower down, the red box bias level is sitting at 3540 which needs a clean break below to then confirm the bearish move has started and we can then either capture the retracements in attempt to target the 3480-5 level or, wait lower for price to exhaust, and once a clean reversal is formed, attempt the long trade back upside.
The ideal scenario here is a break above the 3585 level an attempt on 3600, exhaustion there and then a possible short for next week. It’s been a choppy week but we’ve hit all of our bullish targets so lets observe more than we trade today.
RED BOXES:
Break above 3555 for 3561, 3568, 3576 and 3588 in extension of the move
Break below 3540 for 3533, 3530, 3520, 3506 and 3490 in extension of the move
Please do support us by hitting the like button, leaving a comment, and giving us a follow. We’ve been doing this for a long time now providing traders with in-depth free analysis on Gold, so your likes and comments are very much appreciated.
As always, trade safe.
KOG
