AXS OutlookGiven the current market conditions, I think AXS could move above $2 at any time with a single move.
Metaverse


Meta - The major triangle rejection!💡Meta ( NASDAQ:META ) will reverse soon:
🔎Analysis summary:
Just a couple of months ago we witnessed a textbook all time high break and retest on Meta. This retest was followed by a major rejection higher and the second retest of the triangle resistance trendline. Therefore, Meta is very likely to create another rejection.
📝Levels to watch:
$750 and $500
SwingTraderPhil
SwingTrading.Simplified. | Investing.Simplified. | #LONGTERMVISION

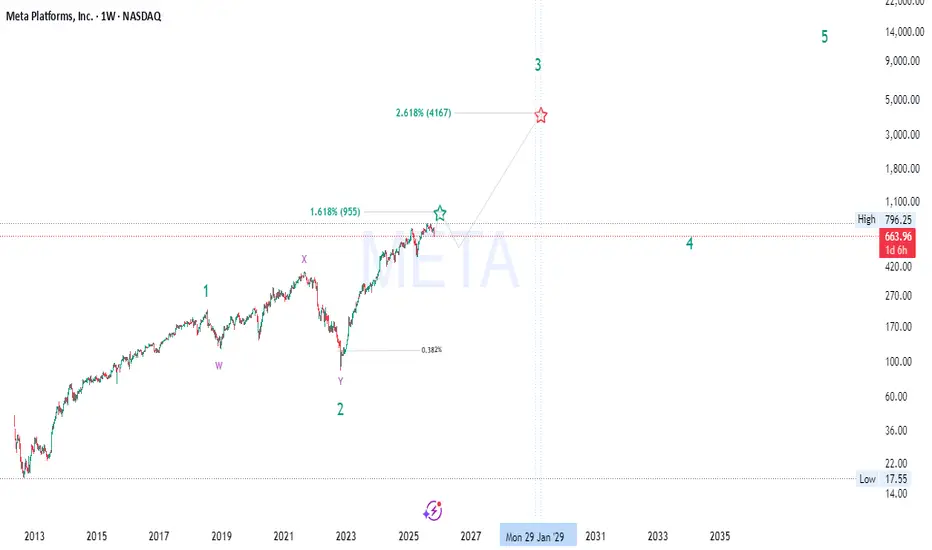
META’s Hidden Fibonacci Path to 4000+ — Don’t Miss Wave 3🚀 META Long-Term Elliott Wave + Smart Money Macro Outlook
🌊 Elliott Wave Structure (662→955→4000+)
META appears to be progressing through a major impulsive 5-wave supercycle on the weekly timeframe:
Wave 1: The initial breakout from accumulation (2015–2021), fueled by growth in advertising dominance and metaverse expansion narratives.
Wave 2: Deep corrective W–X–Y structure into the 2022 low around $90 — a classic multi-year liquidity sweep and re-accumulation phase.
Wave 3 (in progress): This is typically the strongest and most extended wave , with Fibonacci projections aligning near the 2.618 extension ≈ $4,160 , targeting 2028–2029 based on current momentum.
Wave 4: Expected to form a macro re-distribution or range between ~$900–$1,000 before the final parabolic Wave 5, likely extending toward $10K+ .
💡 Wave Confluence:
1.618 Fib extension of Wave 1 → Wave 3 aligns around $955 , acting as the first major resistance (and your current high zone).
2.618 Fib extension → next macro target $4,160 , confirming bullish impulsive momentum.
🧠 Smart Money Concepts (SMC)
The 2022–2023 bottom represents a “Displacement + Re-accumulation” phase , with institutions absorbing liquidity beneath previous demand zones.
Current price action (mid-2025) shows a premium range reaction , where smart money is likely taking partial profits before the next accumulation leg.
Expect a retracement into the 0.382–0.5 Fib zone ($420–$500) to rebalance inefficiencies before continuation toward macro Wave 3 targets.
Key Reaccumulation Zone: $420–$500 — watch for BOS (Break of Structure) confirmation and liquidity sweeps below equal lows.
🔍 Fibonacci Alignment
0.382 retrace marks ideal Wave 4 re-entry.
1.618 & 2.618 extensions align perfectly with the Wave 3 and 5 confluences — textbook impulsive expansion.
Each extension zone has been confirmed with prior liquidity sweeps and displacement candles, increasing Fibonacci reliability 📈.
📊 Market Structure & Price Action
META maintains a strong bullish market structure of Higher Highs (HH) and Higher Lows (HL) since 2023.
The recent 9% correction (-$69) is likely a short-term liquidity grab — not structural weakness.
As long as price holds above $420 , macro bullish market structure remains intact.
Volume profile shows heavy accumulation between $300–$450 , suggesting smart money is still positioned long-term bullish.
💰 Fundamental Confluence
META’s fundamentals are catching up with technicals:
Massive AI CapEx and ad recovery boosting EPS growth 📊
Metaverse burn rate shrinking , improving profitability
Share buybacks providing a floor for price corrections
Macro environment supports tech leadership rotation , and META remains a key beneficiary of the AI + social data synergy cycle 🔄
🔮 Market Cycle View
We’re entering the “Expansion Phase” of the broader innovation cycle.
2018–2022 = Accumulation/Disbelief
2023–2025 = Early Markup / Smart Money Entry
2025–2029 = Public Participation Phase (Wave 3) 💥
Post-2029 = Euphoria / Distribution (Wave 5) 😱
⚙️ Key Levels to Watch
Support Zones: $420 – $500 (Wave 4 re-entry)
Resistance Levels: $955 → $4,160 (Wave 3 targets)
Invalidation: Sustained break below $300 on weekly close
📈 Summary
META remains one of the strongest macro bullish charts in big tech — with perfect alignment across Elliott Wave, SMC, Fibonacci , and fundamental cycle theory .
We’re currently witnessing the mid-phase of Wave 3 , with institutional repositioning before the next vertical leg. Patience and precision around the reaccumulation zone ($420–$500) could provide the golden setup before the next expansion wave 🚀🌕
#META #ElliottWave #SmartMoneyConcepts #Fibonacci #Wave3 #BullMarket #AIStocks #TechnicalAnalysis #TradingView
Bloktopia OutlookNobody is talking about #BLOK, so it's the best time to rise. It's like #SAND and #MANA when nobody knew them. 700X possible!

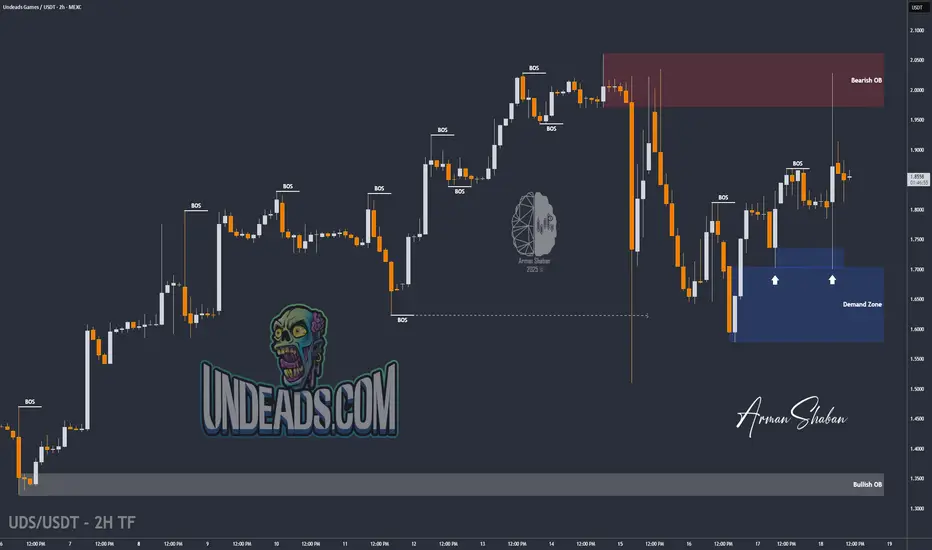
UDS/USDT | GameFi Token UDS Surges – Post-to-Earn Hype ContinuesIn the past two weeks, UDS (Undeads) has gained over 50%! UDS is a GameFi/Web3 project built on a metaverse economy, with staking and NFTs, and it uses a post-to-earn model to boost community engagement.
Looking at the 2-hour chart, we can see that yesterday the price surged by 19%, from $1.70 to $2.02, before correcting again. Right now, UDS is trading around $1.85. If the price can hold above the $1.78–$1.83 demand zone, we can expect more upside.
Keep in mind, this coin is highly volatile, so be cautious if trading it. The next bullish targets, if the rally continues, are $1.88, $1.91, and $1.97. This analysis will be updated again!
Please support me with your likes and comments to motivate me to share more analysis with you and share your opinion about the possible trend of this chart with me !
Best Regards , Arman Shaban
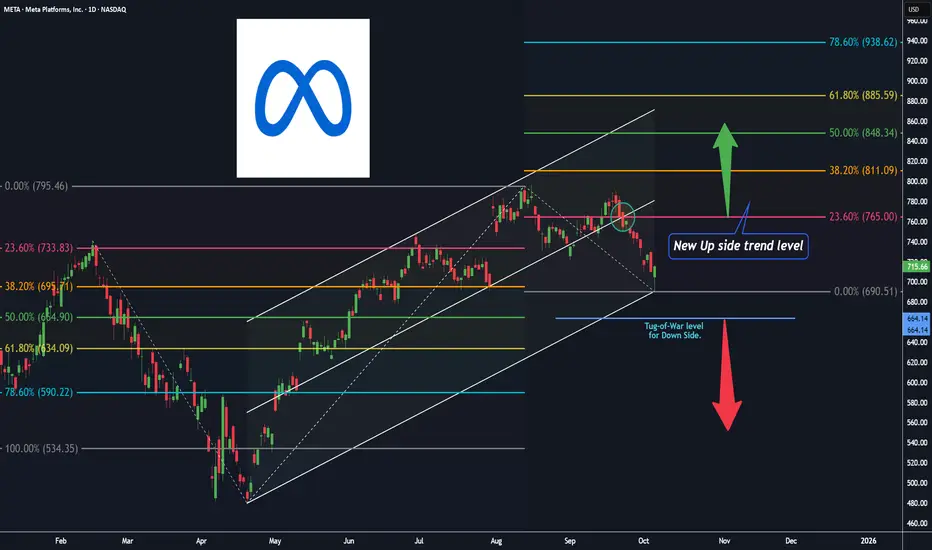
Meta platforms, D ( Channel + 2 Fibonacci Extensions up & down )Hey Traders and Investors, I hope you all are doing well in your life.
market is nature's response and Price is the God .
Let's check the market with the help of natural levels tool : Trend Based Fibonacci Extension in addition with Trend Channel .
After forming almost a ' Head and Shoulders ' pattern on Daily chart, Meta platforms has given a pull-back ( base for Fib-Extension UP level tool on the right side , $690.51 ).
The Pull-back trend expect to continue till the retest level of 23.6% ( $765 ) of Fib-Extension UP level tool on the right side .
The most near level for the re-test is the 50% level ( $664.14 ) of Fib-Extension Down level tool on the left side , for a new UP trend Entry ( investors ).
Note: The marked Circle ⭕ enclosed candle is the important level candle, Up Trend channel's 50% trend line is intersecting with 23.6% of Fib-Extension UP level tool on the right side .
Keep on checking this Level for your future trading decisions.
" Buy 🟢 "above $731 with the stop loss🔻of $690 for the
🎯 Target 1: $765
🎯 Target 2: $811
🎯 Target 3: open.
" Sell 🔴 " below $664 with the stop loss🔺of $690 for the
🎯 Target 1: $634
🎯 Target 2: $590
🎯 Target 3: open.
Smart Levels is Smart Trading 👨🎓
⚠ RISK DISCLAIMER :
All content provided by "TradeWithKeshhav" is for information & educational purposes only.
It does not constitute any financial advice or a solicitation to buy or sell any securities of any type. All investments / trading involve risks. Past performance does not guarantee future results / returns.
Always do your own analysis before taking any trade.
Regards :
Team @TradeWithKeshhav
Happy Trading and Investing!
MAVIA/USDT Analysis: Ready for a Major Breakout!🚀 MAVIA/USDT Recommendation 🚀
🔍 Technical Analysis:
We’re in a Strong Accumulation Phase, presenting an excellent opportunity to buy before a major breakout!
TP1: 2.44
TP2: 3.50
Ultimate Target (Talking to the Moon): 6.6660.
💡 About MAVIA:
MAVIA is an innovative metaverse project focused on building virtual worlds where users can own, develop, and profit from their digital assets. It offers strategy-based blockchain games that reward users for battles and base-building efforts.
🛠 Strong Partnerships:
MAVIA is backed by some of the most powerful names in the crypto industry, including:
Binance Labs : The investment arm of Binance, the world’s largest cryptocurrency exchange, adding enormous weight to MAVIA's credibility.
Crypto.com : A leading global cryptocurrency exchange supporting MAVIA’s mission to scale.
Animoca Brands : A leader in blockchain gaming and the metaverse, bringing valuable expertise to the project.
Delphi Digital : A premier research and investment firm in blockchain and crypto, providing strategic insights and support.
Merit Circle : A platform specializing in play-to-earn games, supporting MAVIA’s gaming ecosystem.
📈 Strategy:
Monitor price movements closely and keep an eye on key entry and exit levels to maximize profit potential.
We deliver top-tier insights and strategies that keep you ahead of the game.
#Crypto #MAVIA #Trading #MAVIAUSDT #Metaverse #Partnerships #CryptoHoneyTraders

Undeads (UDS) Bullish Setup: Targeting 3 USD After CorretionSince the beginning of September, UDS (Undeads) has delivered a nice rally of more than +50%, showing strong momentum and growing interest from both gamers and investors.
Built on a solid GameFi and Web3 foundation, Undeads combines a metaverse economy, staking, NFTs, and a post-to-earn model that keeps the community engaged and expanding.
With the native UDS token at the core of the ecosystem, every step of the game’s evolution drives fresh demand: from in-game purchases to staking rewards and community participation.
What makes this project even more attractive is its growing fan base and accessibility, with the game available on Steam, opening the door to mainstream adoption. At the same time, staking opportunities and play-to-earn mechanics add a strong incentive to hold UDS, reinforcing its long-term value proposition.
The fundamentals remain bullish, positioning UDS as one of the standout performers in the GameFi sector. 🚀
________________________________________
Key Question
Is this just the beginning of UDS’s bullish run, or will the current correction push prices lower before the next breakout?
________________________________________
Why a Healthy Correction is Good
• 2 USD resistance: Price just tested this area twice, creating a double top before pulling back.
• Support retest: The 1.35–1.30 zone, which acted as resistance since late August, is now turning into support – a classic technical setup.
• Higher lows structure: Since April, UDS has consistently made higher lows, confirming the broader bullish trend remains intact.
________________________________________
Trading Plan
The correction we see now could provide a better entry zone around 1.35–1.30, aligning with both technical and structural support. As long as this zone holds, bulls remain in control.
A soft target for this bullish scenario stands around 3 USD, which would represent the next key resistance and a natural profit-taking zone for short-term traders.
________________________________________
Final Thoughts
UDS combines strong fundamentals with a clear technical structure: bullish trend, healthy corrections, and expanding adoption. If the 1.35–1.30 support zone holds, we may see the next leg higher toward 3 USD in the weeks ahead.

ROBLOX RBLX 211% explosive predictionRoblox has been accumulated since 2022. It is ready to take off.
How long it will take to get to 211% gain? Who knows, end of the year or may be middle 25
This a swing trade idea, buy and forget for at least six months
I added some important levels if you want to take profits along the way
Sharing is caring.
GLGT
-roosgart

Meta - The breakout in question?🪓Meta ( NASDAQ:META ) is retesting major structure:
🔎Analysis summary:
After Meta perfectly retested a major previous support trendline in 2022, the trend shifted bullish. We have been witnessing an incredible rally of about +700% with a current retest of the previous all time highs. Time will tell but a bullish breakout remains quite likely.
📝Levels to watch:
$750
🙏🏻#LONGTERMVISION
Philip - Swing Trader

META WEEKLY TRADE SETUP – JULY 25, 2025
📈 META WEEKLY TRADE SETUP – JULY 25, 2025 📈
🔥 Institutional Bulls Are In Control — 3.05 C/P Ratio!
🚨 BUT — It’s 0DTE Friday, so don’t get caught in gamma fire.
⸻
🧠 Model Consensus:
✅ All Models = STRONG BULLISH
⚠️ Entry Timing: Monday preferred (due to gamma + time decay)
📉 Volume still weak = caution on conviction
⸻
🔍 META Flow Stats:
• 🟢 Calls: 65,379
• 🔴 Puts: 21,409
• 📊 C/P Ratio: 3.05 = Institutional bulls stepping in hard
⸻
✅ RECOMMENDED TRADE – PLAN FOR MONDAY
🎯 Instrument: META Call Option
🟢 Strike: $720
📅 Expiry: August 1, 2025
💵 Entry Price: $0.97
💰 Profit Target: $1.45
🛑 Stop Loss: $0.49
⚖️ Confidence: 75%
🕒 Entry Timing: Market open Monday
⸻
⚠️ TRADE NOTES:
• Don’t enter on Friday – too much gamma risk
• Wait for volume confirmation Monday morning
• Expect short-duration swing (hold 3–5 days max)
⸻
📊 Smart money is bullish, timing is everything.
👍 Like & Follow if META is on your radar!
#META #OptionsTrading #0DTE #GammaSqueeze #BullishSetup #TradingView #WeeklyOptions #TechStocks

SAND – Rotation in PlaySAND is showing early signs of strength off the long-term demand zone near $0.23–0.24, where it's been accumulating for several months. Price just printed a strong weekly bounce, up +16%, reclaiming the bottom of the range.
This area has acted as a key base since mid-2023 — with each touch producing a notable reaction. Now trading at $0.286, SAND is attempting to rotate toward the top of the established range.
Key Levels
Support (Range Low): $0.23–0.24 (strong demand zone)
Resistance (Mid-Range): $0.43
Range High: $0.85
A clean flip of the mid-range ($0.43) could open the door to test $0.70+.
📌 Risk management: A break and weekly close below $0.23 invalidates this setup. As long as it holds, the upside potential is attractive from a risk/reward standpoint.
This is a classic accumulation > reclaim > expansion structure. Let the chart speak if the range holds, the rotation is in play.

#AXSUSDT #4h (Bitget Futures) Falling wedge breakout and retestAxie Infinity just pulled back to 50MA support where it's bouncing, looks ready for recovery towards 200MA resistance and more.
⚡️⚡️ #AXS/USDT ⚡️⚡️
Exchanges: Bitget Futures
Signal Type: Regular (Long)
Leverage: Isolated (4.0X)
Amount: 4.7%
Current Price:
2.509
Entry Zone:
2.489 - 2.407
Take-Profit Targets:
1) 2.758
2) 2.991
3) 3.224
Stop Targets:
1) 2.189
Published By: @Zblaba
NYSE:AXS BITGET:AXSUSDT.P #4h #AxieInfinity #P2E axieinfinity.com
Risk/Reward= 1:1.2 | 1:2.1 | 1:3.0
Expected Profit= +50.7% | +88.7% | +126.8%
Possible Loss= -42.3%
Estimated Gaintime= 1-2 weeks

TradeCityPro | APE: Key Breakout Watch in Gaming Token’s Range👋 Welcome to TradeCity Pro!
In this analysis, we’re taking a look at the APE coin — one of the prominent American gaming and metaverse projects that gained major traction during the last bull run.
⭐ Currently, APE holds a market cap of $540 million and ranks 110th on CoinMarketCap.
📅 Daily Timeframe
As shown on the daily chart, price has reached a key resistance zone and has tested it several times.
✔️ If this resistance breaks, it could confirm a trend reversal, potentially opening the way toward higher levels like 0.8990 and even 1.973.
🛒 For spot buying, an entry can be considered upon the breakout of this resistance, though it's safer to wait for confirmation of bearish momentum in Bitcoin dominance before entering a spot position on APE.
📈 However, for futures positions, this same breakout trigger can be used — either on the daily chart or lower timeframes.
🔽 On the short side, a support level has formed at 0.6073. A break below this could extend the bearish trend toward 0.3833.
⚡️ Still, there’s a major support level nearby at 0.5633. If you’re looking for a more conservative short entry, you might wait for a clean break below 0.5633.
💥 Momentum confirmation for the short position would come with an RSI breakdown below 46.46, which would signal stronger bearish pressure entering the market.
📝 Final Thoughts
This analysis reflects our opinions and is not financial advice.
Share your thoughts in the comments, and don’t forget to share this analysis with your friends! ❤️

META cup and handle breakout retestMETA daily cup and handle broke out and is trading to a retest of the breakout level at ~662. A hold over 661~663 area confirms the breakout and would be a good location to add longs. The proper measured move would put the price target far past the ATH in the 900s, which I think is a bit excessive in the short term given the current economic and geopolitical climate. My price targets are a bit more conservative, with the first PT at 681.25 and a secondary PT at 688.65.

"MASTER OF SOCIAL REALMS, META" How Does Meta Make Money?The long-term outlook for META stock looks pretty promising. Thanks to heavy investments in AI and the metaverse, along with steady growth in its advertising business, analysts predict the stock price could climb from its current level (around $640) to anywhere between $700 and even $2,000 by 2030. AI-driven improvements in ad efficiency and growing user engagement on platforms like Facebook and Instagram are major drivers. Plus, the company’s solid financials give it plenty of room to keep investing in the future.
That said, there are risks to watch out for, like tougher regulations in Europe, increasing competition, and uncertainty around the metaverse’s success. Overall, though, META’s strong position in tech and the market makes it a solid pick for long-term investors. Just make sure to weigh those risks before jumping in.

META PUTS IN THE MORNINGHere is META currently rejecting the supply zone around 660.60. If price returns anywhere within the RED Zone tomorrow I will entering. If it Wicks at OPEN ill be entering heavy.

Meta Platforms (META) 4H Outlook – May 2025Following a liquidity sweep and several confirmed Breaks of Structure (BoS), META has shown a bullish market shift. Price is currently hovering near $592.49 after a strong rally.
There is a clearly defined demand zone around the $555–$570 area (highlighted in green). If price retraces to this zone and holds, it could act as a launchpad for a continuation move toward the $636.95 target, aligned with a previous structural high and potential supply.
The setup reflects strong smart money behavior—monitor price reaction at the demand zone for bullish confirmation before engaging.

ALICE Looks Bearish (4H)The ALICE structure is bearish. It has been rejected from premium zones and a bearish internal CHoCH has also formed.
A move from the identified supply zone toward the demand zone is expected.
A daily candle close above the invalidation level would invalidate this analysis.
Do not enter the position without capital management and stop setting
Comment if you have any questions
thank you

TradeCityPro | SAND: Critical Support Test After Pullback👋 Welcome to TradeCity Pro!
In this analysis, I want to review the SAND coin for you. It’s one of the most popular Metaverse projects, widely recognized and among the top in its category.
✔️ This project’s coin currently holds a market cap of $693 million and ranks 91st on CoinMarketCap.
⏳ 4-Hour Timeframe
As you can see on the 4H chart, after a bullish leg that pushed the price up to 0.3140, a correction phase began. Following the break of 0.2903, the price has now corrected down to 0.2714.
🔍 If this 0.2714 level breaks, the price could continue down to the support at 0.2437 — so a break below 0.2714 would be a valid short entry.
👀 Personally, I prefer waiting for the price to first bounce off 0.2714, move upward, and print a lower high relative to 0.2903, then break 0.2714 on a second attempt. In that case, the short setup becomes much more reliable.
🔽 That said, even if the level breaks now without a bounce — since RSI is already near the oversold zone — I’ll still open a short. If RSI enters oversold, it could lead to a sharp drop.
⚡️ One negative factor for short positions is that volume has been decreasing since the price started correcting from 0.3140, which isn't a good signal for further downside — there’s a divergence between price and volume.
📈 However, that’s a positive signal for potential long positions. When volume drops during a correction in an uptrend, it shows buyers still have control. As long as this divergence persists, the uptrend is more likely to continue than to reverse.
📊 For long positions, if buying volume enters the market and the price holds above 0.2714, you can enter based on lower-timeframe structure breaks. The main long entry will be confirmed once the price breaks above the 0.3140 high.
📝 Final Thoughts
This analysis reflects our opinions and is not financial advice.
Share your thoughts in the comments, and don’t forget to share this analysis with your friends! ❤️

Meta: Is the Plunge Inevitable?Despite its vast reach and market presence, Meta Platforms faces significant and compounding challenges that suggest a potentially turbulent future. While appearing dominant, the company is increasingly vulnerable to external pressures stemming from legal, regulatory, and competitive fronts. These growing headwinds threaten to erode its financial stability and alter its fundamental business model.
A critical area of concern involves the human cost of content moderation. Meta faces multiple lawsuits in Africa, alleging severe psychological harm to moderators exposed to disturbing content. These legal actions, particularly in Ghana and Kenya, argue that Meta bears responsibility for the well-being of these outsourced workers, citing inadequate support and exploitative conditions. A loss in these cases could set costly precedents, forcing Meta to significantly invest in or restructure its global content moderation operations and potentially face substantial liabilities.
Simultaneously, Meta confronts escalating regulatory action, particularly in Europe. Recent significant fines from the EU under the Digital Markets Act highlight regulatory intent to control how tech giants handle user data and maintain market dominance. These penalties, including a substantial fine over its "consent or pay" model and a previous one for unfair trading practices, signal a global trend towards stricter oversight that could constrain Meta's core advertising business model. Adding to this pressure is the ongoing US FTC antitrust trial, which seeks to unwind Meta's key acquisitions of Instagram and WhatsApp, citing anti-competitive practices. The potential forced divestiture of these highly lucrative platforms represents an existential threat, as Instagram alone accounts for a significant portion of Meta's advertising revenue.
These intertwined legal and regulatory battles, combined with intense competition in the digital landscape and the uncertain return on large investments like the Metaverse, create a challenging outlook for Meta. The cumulative effect of these pressures could significantly impact the company's profitability, market share, and public perception. Navigating this complex environment requires Meta to address these fundamental issues effectively, or face the increasing likelihood of a substantial downturn.

TradeCityPro | MANAUSDT Fake Breakout Trigger Activated!👋 Welcome to TradeCityPro Channel!
Let’s dive into the analysis of one of the metaverse coins and quickly check the trigger and the action unfolding on its chart together!
🌐 Overview Bitcoin
Before starting the analysis, I want to remind you again that we moved the Bitcoin analysis section from the analysis section to a separate analysis at your request, so that we can discuss the status of Bitcoin in more detail every day and analyze its charts and dominances together.
This is the general analysis of Bitcoin dominance, which we promised you in the analysis to analyze separately and analyze it for you in longer time frames.
📊 Weekly Timeframe
On the weekly timeframe, MANA is one of those coins still oscillating within its range box. After a rejection from the key ceiling at 0.7679, we moved back toward the lower end and continued to fluctuate within our range box.
The candle from two weeks ago attempted to close below the critical support at 0.2484—and it did close below this box’s floor. However, this didn’t trigger a sharp drop; instead, we saw a fake breakout!
A fake breakout occurs when a support or resistance level is breached, but the next candle reverses back above the support or below the resistance. This is often called a fake breakout, and it typically signals a trend reversal or the start of a new trend.
That’s exactly what happened here. After the break, the next candle closed as a strong green candle, returning MANA to its box. This could mark the start of a new trend. You can take this trigger with a stop loss at 0.1722 and capitalize on the potential move!
📉 Daily Timeframe
In the daily timeframe, MANA has continued to show the aftermath of the fake breakout. After the failed attempt to break below 0.2484, the price quickly recovered, with buyers stepping in to push it back into the range box.
The strong green candle that followed the fake breakout confirms the buying pressure, and the price is now testing the upper boundaries of the box. If we see a break above 0.7679, it could signal a strong bullish move. However, caution is needed—failure to break this resistance could lead to another rejection.
For buying, the fake breakout trigger at 0.2484 is active, and you can enter with a stop loss at 0.1722. Confirmation would come from sustained volume and a push above the 50-day moving average. For selling, if we break below 0.1722, it’s a sign to exit, as the downtrend could resume.
✍️ Final Thoughts
Stay level-headed, trade with precision, and let’s capitalize on the market’s top opportunities!
This is our analysis, not financial advice always do your own research.
What do you think? Share your ideas below and pass this along to friends! ❤️
